85029 Investment Properties for Sale
Browse homes for sale and investment properties in 85029. Refine your search by price, property type, or more.
Best cash flowing properties in 85029
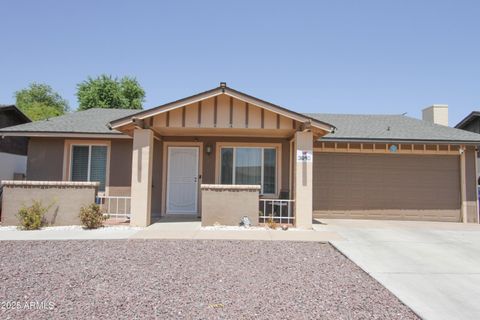
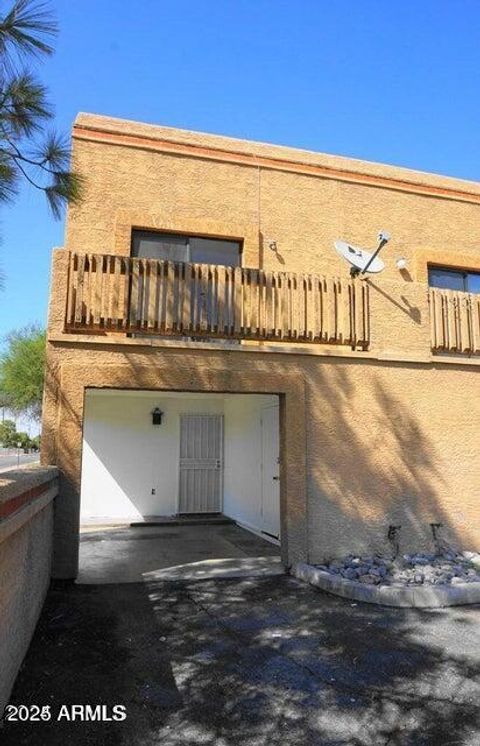
Active
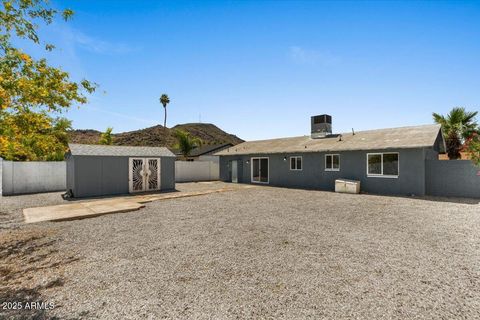
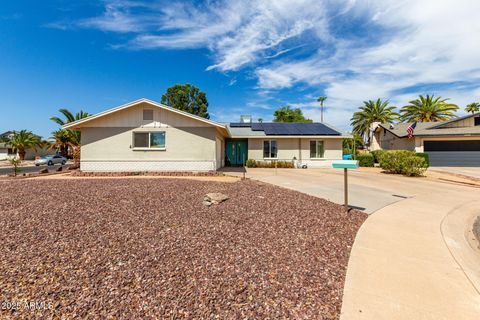
$399,900
5
bds
|
3
ba
|
1,880
sqft
|
built
1971
13039 N 19th Ave, Phoenix, AZ 85029
$-43
Cash flow
-0.6%
Cash-on-Cash Return
5.5%
Cap rate
0.7%
Rent to Value Ratio
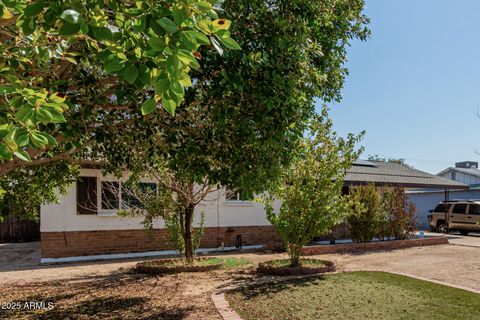
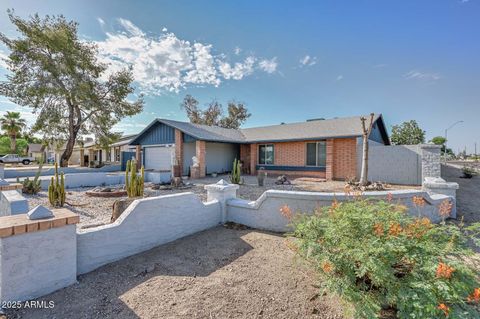
Active
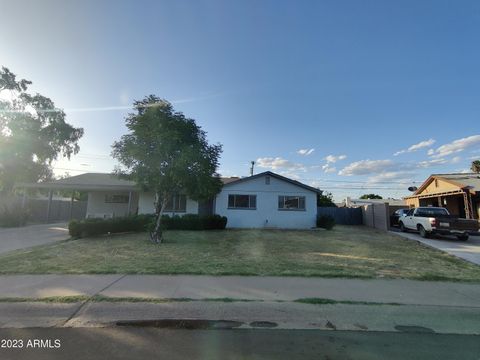
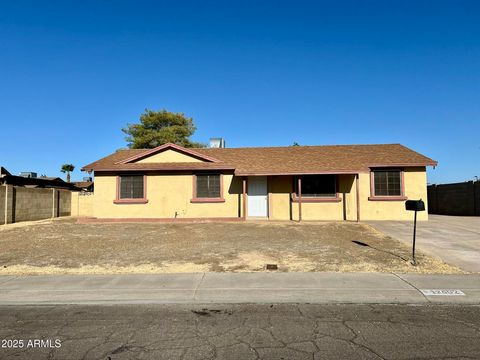
$325,000
3
bds
|
2
ba
|
1,224
sqft
|
built
1966
3433 W Poinsettia Dr, Phoenix, AZ 85029
$-227
Cash flow
-3.6%
Cash-on-Cash Return
4.8%
Cap rate
0.6%
Rent to Value Ratio
64 out of 69 properties for sale in 85029
Limited Results Shown
Create a free account, or log in to reveal all property listings and enjoy the complete experience.

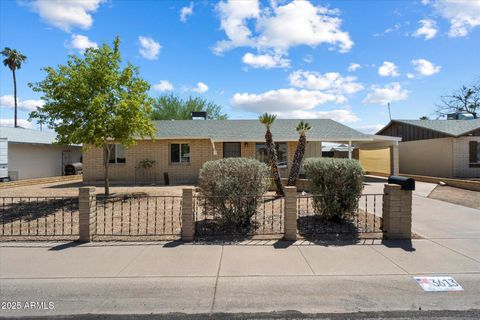
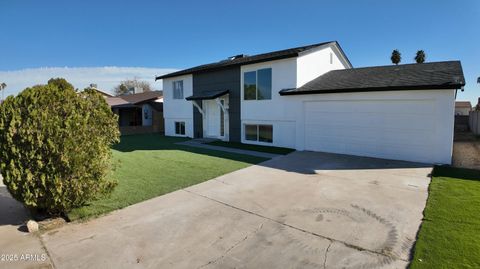
Active
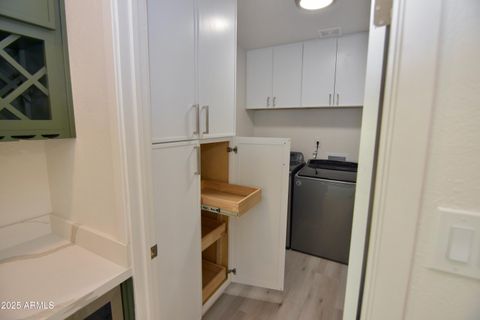
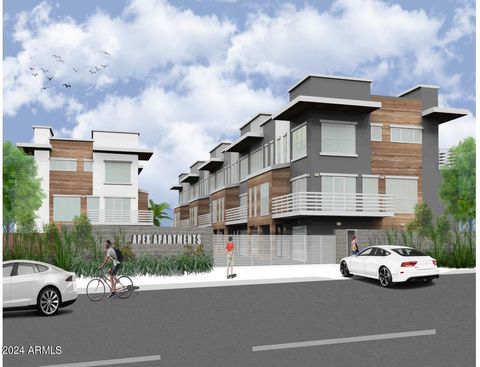
$925,000
4
bds
|
2
ba
|
2,581
sqft
|
built
1980
207 W Surrey Ave, Phoenix, AZ 85029
$-2,629
Cash flow
-14.8%
Cash-on-Cash Return
2.3%
Cap rate
0.3%
Rent to Value Ratio

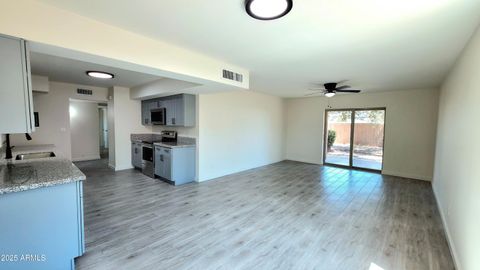
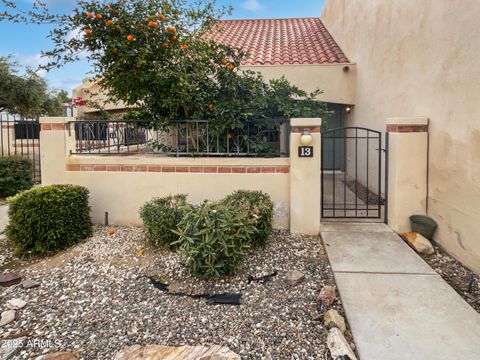
Active
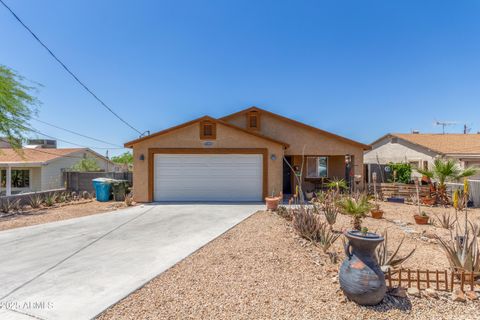
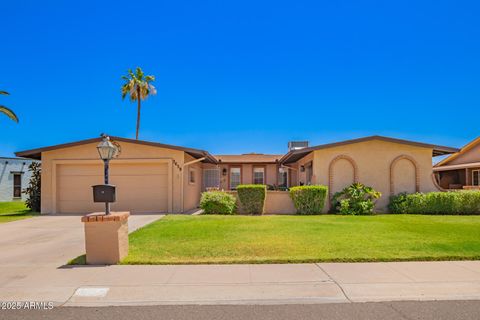
$744,000
4
bds
|
3
ba
|
2,676
sqft
|
built
1971
13249 N 11th Ave, Phoenix, AZ 85029
$-1,112
Cash flow
-7.8%
Cash-on-Cash Return
3.9%
Cap rate
0.5%
Rent to Value Ratio
Active
$355,000
3
bds
|
2
ba
|
1,542
sqft
|
built
1960
3314 W Corrine Dr, Phoenix, AZ 85029
$-396
Cash flow
-5.8%
Cash-on-Cash Return
4.3%
Cap rate
0.6%
Rent to Value Ratio

Active
$400,000
3
bds
|
2
ba
|
1,650
sqft
|
built
1973
1930 W Voltaire Ave, Phoenix, AZ 85029
$-477
Cash flow
-6.2%
Cash-on-Cash Return
4.2%
Cap rate
0.5%
Rent to Value Ratio
Active
$359,000
3
bds
|
2
ba
|
1,400
sqft
|
built
1961
13614 N 33rd Ave, Phoenix, AZ 85029
$-392
Cash flow
-5.7%
Cash-on-Cash Return
4.4%
Cap rate
0.6%
Rent to Value Ratio
Active
$382,950
4
bds
|
3
ba
|
1,284
sqft
|
built
1971
2036 W Windrose Dr, Phoenix, AZ 85029
$-707
Cash flow
-9.6%
Cash-on-Cash Return
3.5%
Cap rate
0.4%
Rent to Value Ratio

Active
$575,000
3
bds
|
2
ba
|
1,871
sqft
|
built
1966
12835 N 16th Dr, Phoenix, AZ 85029
$-1,316
Cash flow
-11.9%
Cash-on-Cash Return
2.9%
Cap rate
0.4%
Rent to Value Ratio
Active
$419,900
4
bds
|
2
ba
|
2,143
sqft
|
built
1960
3208 W Bloomfield Rd, Phoenix, AZ 85029
$-301
Cash flow
-3.7%
Cash-on-Cash Return
4.8%
Cap rate
0.6%
Rent to Value Ratio

Active
$429,700
4
bds
|
2
ba
|
2,262
sqft
|
built
1970
1550 W Willow Ave, Phoenix, AZ 85029
$-804
Cash flow
-9.8%
Cash-on-Cash Return
3.4%
Cap rate
0.5%
Rent to Value Ratio
Active
$492,500
5
bds
|
3
ba
|
1,791
sqft
|
built
1969
3310 W Sweetwater Ave, Phoenix, AZ 85029
$-1,056
Cash flow
-11.2%
Cash-on-Cash Return
3.1%
Cap rate
0.4%
Rent to Value Ratio
Active
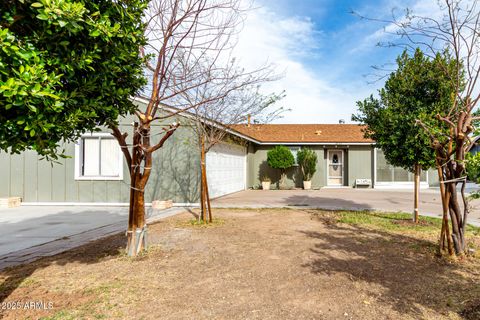
$409,900
3
bds
|
2
ba
|
1,672
sqft
|
built
2017
11048 N 16th Ave, Phoenix, AZ 85029
$-540
Cash flow
-6.9%
Cash-on-Cash Return
4.1%
Cap rate
0.6%
Rent to Value Ratio

Active
$489,950
4
bds
|
3
ba
|
2,258
sqft
|
built
1973
2032 W Eugie Ave, Phoenix, AZ 85029
$-1,214
Cash flow
-12.9%
Cash-on-Cash Return
2.7%
Cap rate
0.4%
Rent to Value Ratio
Active
$370,000
3
bds
|
2
ba
|
1,962
sqft
|
built
1968
10713 N 36th Ave, Phoenix, AZ 85029
$-507
Cash flow
-7.1%
Cash-on-Cash Return
4.0%
Cap rate
0.5%
Rent to Value Ratio
Active
$448,000
4
bds
|
3
ba
|
2,101
sqft
|
built
1969
11846 N 30th Dr, Phoenix, AZ 85029
$-634
Cash flow
-7.4%
Cash-on-Cash Return
4.0%
Cap rate
0.5%
Rent to Value Ratio
Active
$485,000
6
bds
|
4
ba
|
2,830
sqft
|
built
1952
1517 W Sahuaro Dr, Phoenix, AZ 85029
$-498
Cash flow
-5.4%
Cash-on-Cash Return
4.4%
Cap rate
0.6%
Rent to Value Ratio
Active
$389,900
3
bds
|
2
ba
|
1,678
sqft
|
built
1961
13148 N 21st Ave, Phoenix, AZ 85029
$-604
Cash flow
-8.1%
Cash-on-Cash Return
3.8%
Cap rate
0.5%
Rent to Value Ratio
Active
$440,000
3
bds
|
2
ba
|
1,444
sqft
|
built
1971
3840 W Sierra St, Phoenix, AZ 85029
$-646
Cash flow
-7.7%
Cash-on-Cash Return
3.9%
Cap rate
0.5%
Rent to Value Ratio
Active
$412,000
3
bds
|
2
ba
|
1,148
sqft
|
built
1959
2901 W Corrine Dr, Phoenix, AZ 85029
$-768
Cash flow
-9.7%
Cash-on-Cash Return
3.4%
Cap rate
0.4%
Rent to Value Ratio
Active
$375,000
3
bds
|
2
ba
|
1,273
sqft
|
built
1971
3613 W Lupine Ave, Phoenix, AZ 85029
$-614
Cash flow
-8.5%
Cash-on-Cash Return
3.7%
Cap rate
0.5%
Rent to Value Ratio
Active
$385,000
3
bds
|
2
ba
|
1,616
sqft
|
built
1970
3708 W Peoria Ave, Phoenix, AZ 85029
$-657
Cash flow
-8.9%
Cash-on-Cash Return
3.6%
Cap rate
0.5%
Rent to Value Ratio
Active
$200,000
2
bds
|
2
ba
|
999
sqft
|
built
1985
12245 N 21st Ave, Phoenix, AZ 85029
$-259
Cash flow
-6.8%
Cash-on-Cash Return
4.1%
Cap rate
0.7%
Rent to Value Ratio
Active
$399,999
3
bds
|
2
ba
|
1,554
sqft
|
built
1977
4235 W Aster Dr, Phoenix, AZ 85029
$-341
Cash flow
-4.4%
Cash-on-Cash Return
4.7%
Cap rate
0.6%
Rent to Value Ratio
Active
$414,900
5
bds
|
2
ba
|
1,632
sqft
|
built
1971
3717 W Columbine Dr, Phoenix, AZ 85029
$-955
Cash flow
-12.0%
Cash-on-Cash Return
2.9%
Cap rate
0.4%
Rent to Value Ratio
Active
$250,000
2
bds
|
3
ba
|
1,498
sqft
|
built
1981
11444 N 28th Dr, Phoenix, AZ 85029
$-444
Cash flow
-9.3%
Cash-on-Cash Return
3.5%
Cap rate
0.7%
Rent to Value Ratio

Active
$390,000
3
bds
|
3
ba
|
1,800
sqft
|
built
1971
1733 W Surrey Ave, Phoenix, AZ 85029
$-542
Cash flow
-7.3%
Cash-on-Cash Return
4.0%
Cap rate
0.5%
Rent to Value Ratio
Active
$475,000
4
bds
|
2
ba
|
2,060
sqft
|
built
1962
13121 N 21st Dr, Phoenix, AZ 85029
$-868
Cash flow
-9.5%
Cash-on-Cash Return
3.5%
Cap rate
0.5%
Rent to Value Ratio
Active
$412,900
3
bds
|
2
ba
|
1,464
sqft
|
built
1969
3238 W Altadena Ave, Phoenix, AZ 85029
$-798
Cash flow
-10.1%
Cash-on-Cash Return
3.4%
Cap rate
0.4%
Rent to Value Ratio
Active
$375,000
4
bds
|
2
ba
|
1,469
sqft
|
built
1968
2345 W Shaw Butte Dr, Phoenix, AZ 85029
$-468
Cash flow
-6.5%
Cash-on-Cash Return
4.2%
Cap rate
0.5%
Rent to Value Ratio
Active
$799,900
4
bds
|
2
ba
|
2,662
sqft
|
built
1970
13034 N 8th Ave, Phoenix, AZ 85029
$-1,609
Cash flow
-10.5%
Cash-on-Cash Return
3.3%
Cap rate
0.5%
Rent to Value Ratio
Active
$450,000
3
bds
|
2
ba
|
1,808
sqft
|
built
1970
11033 N 34th Ave, Phoenix, AZ 85029
$-595
Cash flow
-6.9%
Cash-on-Cash Return
4.1%
Cap rate
0.5%
Rent to Value Ratio

Active
$195,000
2
bds
|
2
ba
|
939
sqft
|
built
1985
11666 N 28th Dr, Phoenix, AZ 85029
$-228
Cash flow
-6.1%
Cash-on-Cash Return
4.3%
Cap rate
0.7%
Rent to Value Ratio

Active
$389,999
3
bds
|
2
ba
|
1,570
sqft
|
built
1978
10852 N 39th Ave, Phoenix, AZ 85029
$-345
Cash flow
-4.6%
Cash-on-Cash Return
4.6%
Cap rate
0.6%
Rent to Value Ratio
Active
$349,400
3
bds
|
2
ba
|
1,414
sqft
|
built
1972
12602 N 38th Ave, Phoenix, AZ 85029
$-508
Cash flow
-7.6%
Cash-on-Cash Return
3.9%
Cap rate
0.5%
Rent to Value Ratio

Active
$2,450,000
bds
|
0
ba
|
0
sqft
|
built
1963
1302 W Becker Ln, Phoenix, AZ 85029
$-9,697
Cash flow
-20.7%
Cash-on-Cash Return
0.9%
Cap rate
0.1%
Rent to Value Ratio
Active
$6,900,000
bds
|
0
ba
|
0
sqft
|
built
2024
11830 N 28th Dr, Phoenix, AZ 85029
$-31,770
Cash flow
-24.0%
Cash-on-Cash Return
0.2%
Cap rate
0.0%
Rent to Value Ratio
Active
$429,900
4
bds
|
2
ba
|
1,726
sqft
|
built
1971
3659 W Windrose Dr, Phoenix, AZ 85029
$-815
Cash flow
-9.9%
Cash-on-Cash Return
3.4%
Cap rate
0.5%
Rent to Value Ratio
Active
$359,950
3
bds
|
2
ba
|
1,372
sqft
|
built
1974
2112 W Dahlia Dr, Phoenix, AZ 85029
$-592
Cash flow
-8.6%
Cash-on-Cash Return
3.7%
Cap rate
0.5%
Rent to Value Ratio
Active
$400,000
3
bds
|
2
ba
|
1,646
sqft
|
built
1973
2143 W Eugie Ave, Phoenix, AZ 85029
$-422
Cash flow
-5.5%
Cash-on-Cash Return
4.4%
Cap rate
0.6%
Rent to Value Ratio