85033 Investment Properties for Sale
Browse homes for sale and investment properties in 85033. Refine your search by price, property type, or more.
Best cash flowing properties in 85033
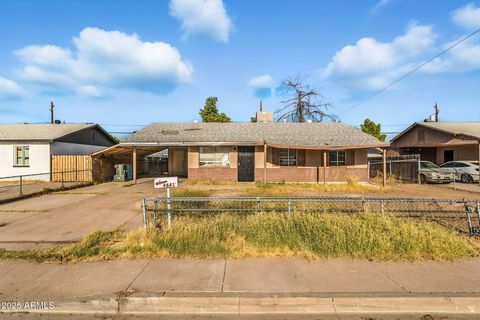
Active
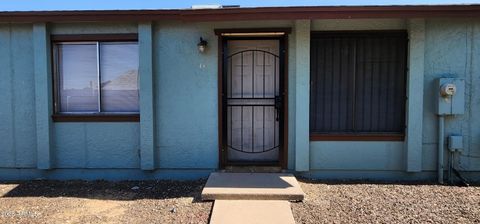
$194,500
2
bds
|
1
ba
|
700
sqft
|
built
1982
3645 N 69th Ave, Phoenix, AZ 85033
$-102
Cash flow
-2.7%
Cash-on-Cash Return
5.0%
Cap rate
0.7%
Rent to Value Ratio

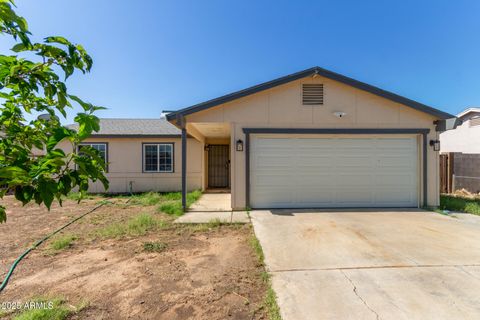
Active
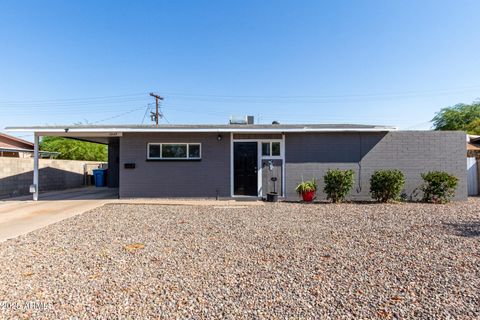
$199,950
2
bds
|
1
ba
|
700
sqft
|
built
1982
3645 N 71st Ave, Phoenix, AZ 85033
$-131
Cash flow
-3.4%
Cash-on-Cash Return
4.9%
Cap rate
0.7%
Rent to Value Ratio
43 out of 46 properties for sale in 85033
Limited Results Shown
Create a free account, or log in to reveal all property listings and enjoy the complete experience.
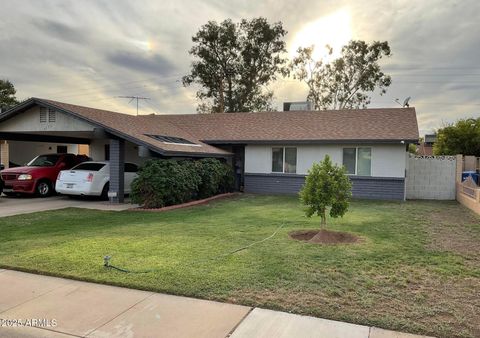
Active
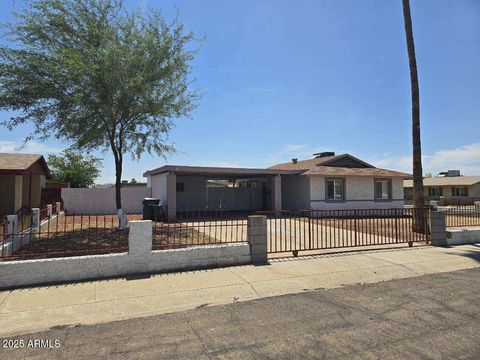
$325,000
2
bds
|
1
ba
|
896
sqft
|
built
1961
7649 W Whitton Ave, Phoenix, AZ 85033
$-489
Cash flow
-7.9%
Cash-on-Cash Return
3.9%
Cap rate
0.5%
Rent to Value Ratio
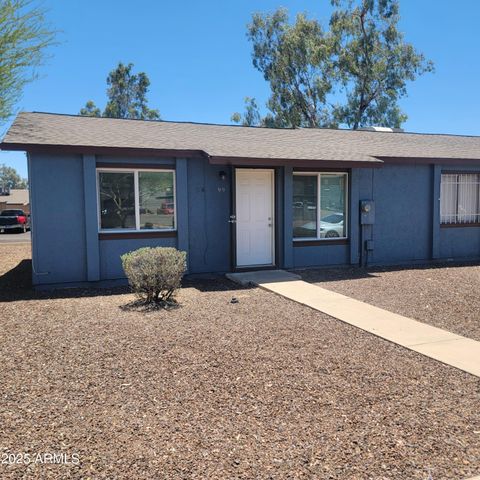
Active
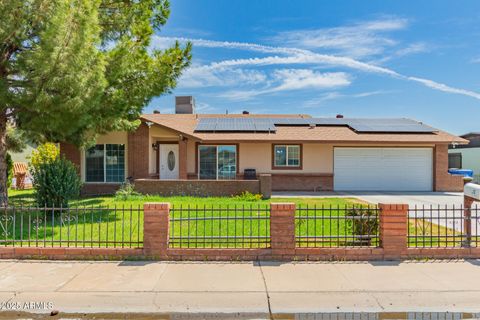
$319,995
2
bds
|
1
ba
|
925
sqft
|
built
1972
5977 W Britton Ave, Phoenix, AZ 85033
$-540
Cash flow
-8.8%
Cash-on-Cash Return
3.7%
Cap rate
0.5%
Rent to Value Ratio
Active
$375,000
4
bds
|
2
ba
|
1,383
sqft
|
built
1978
3107 N 79th Ave, Phoenix, AZ 85033
$-629
Cash flow
-8.8%
Cash-on-Cash Return
3.7%
Cap rate
0.5%
Rent to Value Ratio
Active
$400,000
3
bds
|
2
ba
|
1,217
sqft
|
built
1983
7748 W Minnezona Ave, Phoenix, AZ 85033
$-690
Cash flow
-9.0%
Cash-on-Cash Return
3.6%
Cap rate
0.5%
Rent to Value Ratio
Active
$379,900
4
bds
|
2
ba
|
1,271
sqft
|
built
1961
8147 W Clarendon Ave, Phoenix, AZ 85033
$-760
Cash flow
-10.4%
Cash-on-Cash Return
3.3%
Cap rate
0.4%
Rent to Value Ratio
Active
$355,000
3
bds
|
2
ba
|
1,305
sqft
|
built
1961
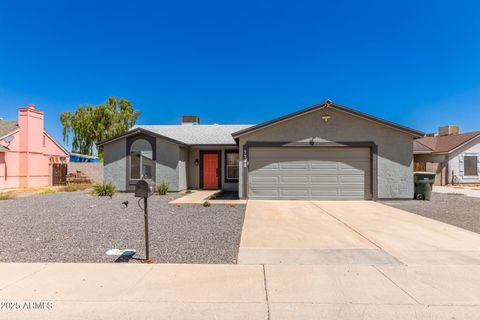
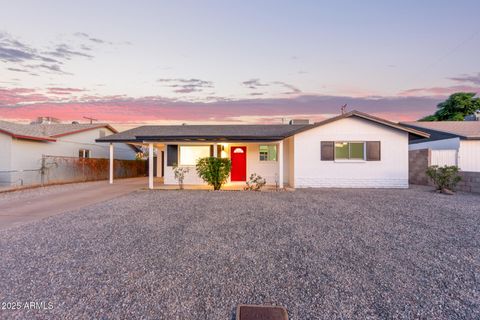
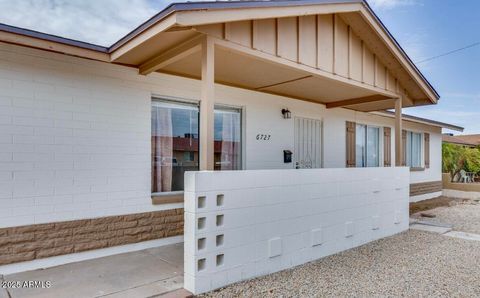
6727 W Roma Ave, Phoenix, AZ 85033
$-516
Cash flow
-7.6%
Cash-on-Cash Return
3.9%
Cap rate
0.5%
Rent to Value Ratio

Active
$219,900
2
bds
|
2
ba
|
1,006
sqft
|
built
1987
6902 W Devonshire Ave, Phoenix, AZ 85033
$-370
Cash flow
-8.8%
Cash-on-Cash Return
3.7%
Cap rate
0.6%
Rent to Value Ratio
Active
$380,000
3
bds
|
2
ba
|
1,770
sqft
|
built
1961
8201 W Whitton Ave, Phoenix, AZ 85033
$-570
Cash flow
-7.8%
Cash-on-Cash Return
3.9%
Cap rate
0.5%
Rent to Value Ratio
Active
$305,000
3
bds
|
1
ba
|
1,010
sqft
|
built
1960
3806 N 64th Dr, Phoenix, AZ 85033
$-325
Cash flow
-5.6%
Cash-on-Cash Return
4.4%
Cap rate
0.6%
Rent to Value Ratio
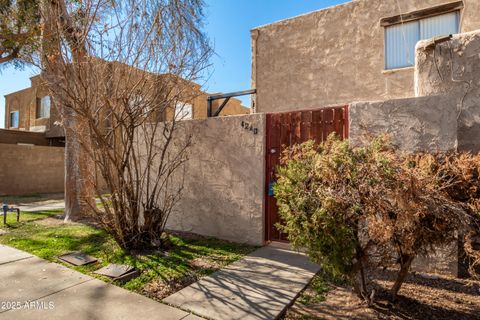
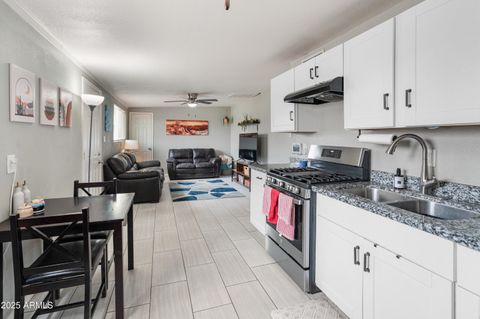
Active
$208,900
2
bds
|
2
ba
|
966
sqft
|
built
1973
4240 N 67th Ln, Phoenix, AZ 85033
$-200
Cash flow
-5.0%
Cash-on-Cash Return
4.5%
Cap rate
0.8%
Rent to Value Ratio
Active
$415,000
4
bds
|
2
ba
|
1,750
sqft
|
built
1968
4728 N 61st Ave, Phoenix, AZ 85033
$-688
Cash flow
-8.6%
Cash-on-Cash Return
3.7%
Cap rate
0.5%
Rent to Value Ratio

Active
$285,000
3
bds
|
2
ba
|
1,435
sqft
|
built
1962
3802 N 79th Ave, Phoenix, AZ 85033
$-185
Cash flow
-3.4%
Cash-on-Cash Return
4.9%
Cap rate
0.6%
Rent to Value Ratio
Active
$327,500
3
bds
|
2
ba
|
1,358
sqft
|
built
1961
7940 W Avalon Dr, Phoenix, AZ 85033
$-391
Cash flow
-6.2%
Cash-on-Cash Return
4.2%
Cap rate
0.5%
Rent to Value Ratio
Active
$388,000
3
bds
|
2
ba
|
1,410
sqft
|
built
1961
4031 N 81st Ave, Phoenix, AZ 85033
$-676
Cash flow
-9.1%
Cash-on-Cash Return
3.6%
Cap rate
0.5%
Rent to Value Ratio
Active
$393,000
5
bds
|
4
ba
|
1,710
sqft
|
built
1960
2909 N 60th Ave, Phoenix, AZ 85033
$-695
Cash flow
-9.2%
Cash-on-Cash Return
3.6%
Cap rate
0.5%
Rent to Value Ratio
Active
$349,900
4
bds
|
2
ba
|
1,180
sqft
|
built
1974
4425 N 70th Ave, Phoenix, AZ 85033
$-693
Cash flow
-10.3%
Cash-on-Cash Return
3.3%
Cap rate
0.5%
Rent to Value Ratio
Active
$349,900
4
bds
|
2
ba
|
1,154
sqft
|
built
1971
4240 N 73rd Ave, Phoenix, AZ 85033
$-627
Cash flow
-9.3%
Cash-on-Cash Return
3.5%
Cap rate
0.5%
Rent to Value Ratio
Active
$369,000
4
bds
|
2
ba
|
2,006
sqft
|
built
1962
3317 N 80th Ave, Phoenix, AZ 85033
$-531
Cash flow
-7.5%
Cash-on-Cash Return
4.0%
Cap rate
0.5%
Rent to Value Ratio
Active
$330,000
4
bds
|
2
ba
|
1,417
sqft
|
built
1962
6530 W Turney Ave, Phoenix, AZ 85033
$-402
Cash flow
-6.4%
Cash-on-Cash Return
4.2%
Cap rate
0.5%
Rent to Value Ratio
Active
$320,000
3
bds
|
2
ba
|
1,344
sqft
|
built
1979
7959 W Coolidge St, Phoenix, AZ 85033
$-692
Cash flow
-11.3%
Cash-on-Cash Return
3.1%
Cap rate
0.4%
Rent to Value Ratio
Active
$299,900
4
bds
|
2
ba
|
1,261
sqft
|
built
1962
7750 W Clarendon Ave, Phoenix, AZ 85033
$-247
Cash flow
-4.3%
Cash-on-Cash Return
4.7%
Cap rate
0.6%
Rent to Value Ratio
Active
$268,000
3
bds
|
2
ba
|
1,020
sqft
|
built
1960
4641 N 71st Ave, Phoenix, AZ 85033
$-234
Cash flow
-4.6%
Cash-on-Cash Return
4.6%
Cap rate
0.6%
Rent to Value Ratio
Active
$340,000
3
bds
|
2
ba
|
1,078
sqft
|
built
1978
8051 W Mariposa Dr, Phoenix, AZ 85033
$-432
Cash flow
-6.6%
Cash-on-Cash Return
4.2%
Cap rate
0.5%
Rent to Value Ratio

Active
$199,900
2
bds
|
1
ba
|
700
sqft
|
built
1983
3120 N 67th Ln, Phoenix, AZ 85033
$-351
Cash flow
-9.2%
Cash-on-Cash Return
3.6%
Cap rate
0.6%
Rent to Value Ratio
Active
$390,000
3
bds
|
2
ba
|
1,377
sqft
|
built
1974
4138 N 79th Ave, Phoenix, AZ 85033
$-687
Cash flow
-9.2%
Cash-on-Cash Return
3.6%
Cap rate
0.5%
Rent to Value Ratio
Active
$162,950
1
bds
|
1
ba
|
528
sqft
|
built
1983
3645 N 69th Ave, Phoenix, AZ 85033
$-158
Cash flow
-5.1%
Cash-on-Cash Return
4.5%
Cap rate
0.7%
Rent to Value Ratio
Active
$377,777
4
bds
|
2
ba
|
1,498
sqft
|
built
1962
7764 W Whitton Ave, Phoenix, AZ 85033
$-745
Cash flow
-10.3%
Cash-on-Cash Return
3.3%
Cap rate
0.4%
Rent to Value Ratio
Active
$314,500
3
bds
|
2
ba
|
1,412
sqft
|
built
1978
7506 W Devonshire Ave, Phoenix, AZ 85033
$-346
Cash flow
-5.7%
Cash-on-Cash Return
4.4%
Cap rate
0.6%
Rent to Value Ratio
Active
$390,000
6
bds
|
2
ba
|
2,209
sqft
|
built
1972
6137 W Britton Ave, Phoenix, AZ 85033
$-608
Cash flow
-8.1%
Cash-on-Cash Return
3.8%
Cap rate
0.5%
Rent to Value Ratio
Active
$199,499
2
bds
|
2
ba
|
950
sqft
|
built
1983
3646 N 67th Ave, Phoenix, AZ 85033
$-133
Cash flow
-3.5%
Cash-on-Cash Return
4.9%
Cap rate
0.7%
Rent to Value Ratio

Active
$279,999
3
bds
|
2
ba
|
1,152
sqft
|
built
1961
6521 W Flower St, Phoenix, AZ 85033
$-289
Cash flow
-5.4%
Cash-on-Cash Return
4.4%
Cap rate
0.6%
Rent to Value Ratio
Active
$369,000
3
bds
|
2
ba
|
1,665
sqft
|
built
1960
6223 W Earll Dr, Phoenix, AZ 85033
$-583
Cash flow
-8.2%
Cash-on-Cash Return
3.8%
Cap rate
0.5%
Rent to Value Ratio

Active
$316,000
3
bds
|
1
ba
|
960
sqft
|
built
1974
3614 N 64th Dr, Phoenix, AZ 85033
$-450
Cash flow
-7.4%
Cash-on-Cash Return
4.0%
Cap rate
0.5%
Rent to Value Ratio
Active
$325,000
3
bds
|
2
ba
|
1,300
sqft
|
built
1960
6447 W Piccadilly Rd, Phoenix, AZ 85033
$-628
Cash flow
-10.1%
Cash-on-Cash Return
3.4%
Cap rate
0.4%
Rent to Value Ratio
Active
$470,000
5
bds
|
3
ba
|
2,656
sqft
|
built
1963
6010 W Coolidge St, Phoenix, AZ 85033
$-502
Cash flow
-5.6%
Cash-on-Cash Return
4.4%
Cap rate
0.6%
Rent to Value Ratio
Active
$365,000
3
bds
|
2
ba
|
1,432
sqft
|
built
1975
7553 W Montecito Ave, Phoenix, AZ 85033
$-645
Cash flow
-9.2%
Cash-on-Cash Return
3.6%
Cap rate
0.5%
Rent to Value Ratio
Active
$375,000
4
bds
|
2
ba
|
1,568
sqft
|
built
1961
6516 W Cheery Lynn Rd, Phoenix, AZ 85033
$-633
Cash flow
-8.8%
Cash-on-Cash Return
3.7%
Cap rate
0.5%
Rent to Value Ratio
Active
$389,000
3
bds
|
2
ba
|
1,408
sqft
|
built
1979
7752 W Flower St, Phoenix, AZ 85033
$-699
Cash flow
-9.4%
Cash-on-Cash Return
3.5%
Cap rate
0.5%
Rent to Value Ratio