85045 Investment Properties for Sale
Browse homes for sale and investment properties in 85045. Refine your search by price, property type, or more.
Best cash flowing properties in 85045
Active
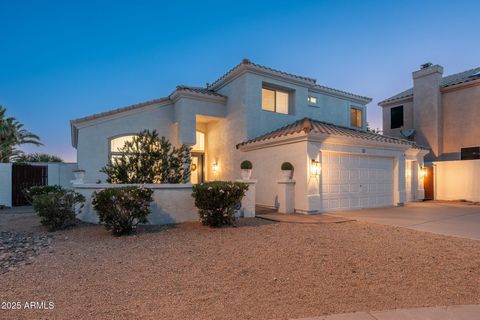
$500,000
4
bds
|
3
ba
|
2,055
sqft
|
built
2019
1654 W Redwood Ln, Phoenix, AZ 85045
$-675
Cash flow
-7.0%
Cash-on-Cash Return
4.1%
Cap rate
0.6%
Rent to Value Ratio
Active
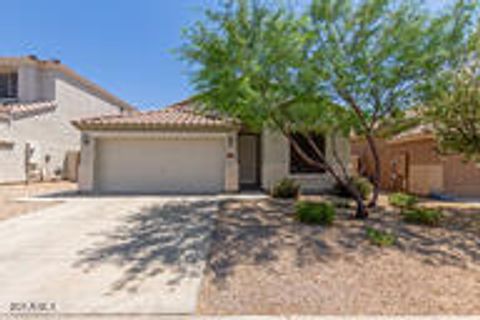
$435,000
3
bds
|
2
ba
|
1,165
sqft
|
built
2000
1702 W Amberwood Dr, Phoenix, AZ 85045
$-678
Cash flow
-8.1%
Cash-on-Cash Return
3.8%
Cap rate
0.5%
Rent to Value Ratio
22 out of 22 properties for sale in 85045
Limited Results Shown
Create a free account, or log in to reveal all property listings and enjoy the complete experience.
Active
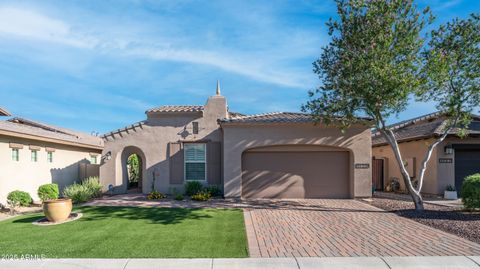
$839,900
4
bds
|
2
ba
|
2,472
sqft
|
built
2017
15628 S 11th Ln, Phoenix, AZ 85045
$-1,360
Cash flow
-8.4%
Cash-on-Cash Return
3.7%
Cap rate
0.5%
Rent to Value Ratio
Active
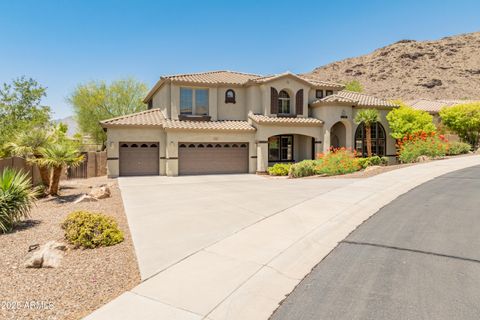
$525,000
4
bds
|
3
ba
|
2,283
sqft
|
built
1999
227 W Mountain Sage Dr, Phoenix, AZ 85045
$-869
Cash flow
-8.6%
Cash-on-Cash Return
3.7%
Cap rate
0.5%
Rent to Value Ratio
Active
$699,999
4
bds
|
3
ba
|
2,602
sqft
|
built
1994
15421 S 16th Dr, Phoenix, AZ 85045
$-1,160
Cash flow
-8.6%
Cash-on-Cash Return
3.7%
Cap rate
0.5%
Rent to Value Ratio
Active
$474,900
3
bds
|
2
ba
|
1,628
sqft
|
built
2004
3022 W Redwood Ln, Phoenix, AZ 85045
$-910
Cash flow
-10.0%
Cash-on-Cash Return
3.4%
Cap rate
0.5%
Rent to Value Ratio
Active
$674,999
5
bds
|
3
ba
|
2,823
sqft
|
built
1994
15825 S 1st Ave, Phoenix, AZ 85045
$-1,320
Cash flow
-10.2%
Cash-on-Cash Return
3.3%
Cap rate
0.5%
Rent to Value Ratio
Active
$449,000
2
bds
|
2
ba
|
1,593
sqft
|
built
2020
15550 S 5th Ave, Phoenix, AZ 85045
$-757
Cash flow
-8.8%
Cash-on-Cash Return
3.7%
Cap rate
0.6%
Rent to Value Ratio
Active
$735,000
5
bds
|
3
ba
|
2,823
sqft
|
built
1994
13 W Silverwood Dr, Phoenix, AZ 85045
$-1,174
Cash flow
-8.3%
Cash-on-Cash Return
3.8%
Cap rate
0.5%
Rent to Value Ratio
Active
$489,000
4
bds
|
2
ba
|
1,894
sqft
|
built
2004
16813 S 30th Ave, Phoenix, AZ 85045
$-863
Cash flow
-9.2%
Cash-on-Cash Return
3.6%
Cap rate
0.5%
Rent to Value Ratio

Active
$585,000
4
bds
|
2
ba
|
1,903
sqft
|
built
1990
15226 S 14th Dr, Phoenix, AZ 85045
$-1,330
Cash flow
-11.9%
Cash-on-Cash Return
2.9%
Cap rate
0.4%
Rent to Value Ratio
Active
$839,900
3
bds
|
2
ba
|
2,267
sqft
|
built
2017
1123 W Thunderhill Dr, Phoenix, AZ 85045
$-1,556
Cash flow
-9.7%
Cash-on-Cash Return
3.5%
Cap rate
0.5%
Rent to Value Ratio

Active
$550,000
3
bds
|
3
ba
|
2,343
sqft
|
built
2004
17012 S 27th Ln, Phoenix, AZ 85045
$-920
Cash flow
-8.7%
Cash-on-Cash Return
3.7%
Cap rate
0.5%
Rent to Value Ratio

Active
$565,000
3
bds
|
2
ba
|
1,740
sqft
|
built
1999
16404 S 18th Dr, Phoenix, AZ 85045
$-1,013
Cash flow
-9.4%
Cash-on-Cash Return
3.5%
Cap rate
0.5%
Rent to Value Ratio
Active
$980,000
4
bds
|
4
ba
|
4,004
sqft
|
built
2005
16224 S Reserve Dr, Phoenix, AZ 85045
$-2,713
Cash flow
-14.4%
Cash-on-Cash Return
2.4%
Cap rate
0.4%
Rent to Value Ratio
Active
$469,000
2
bds
|
2
ba
|
1,435
sqft
|
built
2016
15550 S 5th Ave, Phoenix, AZ 85045
$-1,117
Cash flow
-12.4%
Cash-on-Cash Return
2.8%
Cap rate
0.6%
Rent to Value Ratio
Active
$2,530,000
4
bds
|
5
ba
|
5,514
sqft
|
built
2013
3118 W Glenhaven Dr, Phoenix, AZ 85045
$-8,854
Cash flow
-18.3%
Cash-on-Cash Return
1.5%
Cap rate
0.2%
Rent to Value Ratio

Active
$969,000
5
bds
|
4
ba
|
2,729
sqft
|
built
2020
16226 S 35th Dr, Phoenix, AZ 85045
$-2,602
Cash flow
-14.0%
Cash-on-Cash Return
2.5%
Cap rate
0.4%
Rent to Value Ratio

Active
$699,000
4
bds
|
3
ba
|
2,329
sqft
|
built
1992
1311 W Thunderhill Dr, Phoenix, AZ 85045
$-1,493
Cash flow
-11.1%
Cash-on-Cash Return
3.1%
Cap rate
0.4%
Rent to Value Ratio
Active
$619,000
4
bds
|
3
ba
|
2,532
sqft
|
built
1999
15852 S 18th Ln, Phoenix, AZ 85045
$-1,053
Cash flow
-8.9%
Cash-on-Cash Return
3.6%
Cap rate
0.5%
Rent to Value Ratio
Active
$750,000
4
bds
|
3
ba
|
2,742
sqft
|
built
1994
16436 S 1st Ave, Phoenix, AZ 85045
$-1,257
Cash flow
-8.7%
Cash-on-Cash Return
3.7%
Cap rate
0.5%
Rent to Value Ratio
Active
$540,000
3
bds
|
2
ba
|
2,343
sqft
|
built
2004
3033 W Redwood Ln, Phoenix, AZ 85045
$-899
Cash flow
-8.7%
Cash-on-Cash Return
3.7%
Cap rate
0.5%
Rent to Value Ratio