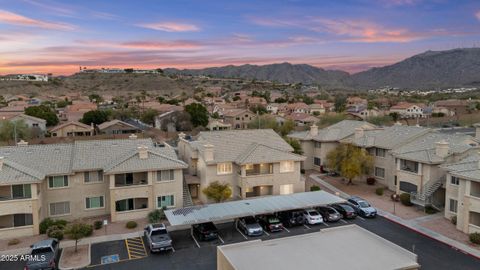
85048 Investment Properties for Sale
Browse homes for sale and investment properties in 85048. Refine your search by price, property type, or more.
Best cash flowing properties in 85048

Active
$230,000
1
bds
|
1
ba
|
693
sqft
|
built
1995
3830 E Lakewood Pkwy E, Phoenix, AZ 85048
$-328
Cash flow
-7.4%
Cash-on-Cash Return
4.6%
Cap rate
0.6%
Rent to Value Ratio

Active
$240,000
1
bds
|
1
ba
|
750
sqft
|
built
1997
16013 S Desert Foothills Pkwy, Phoenix, AZ 85048
$-450
Cash flow
-9.8%
Cash-on-Cash Return
4.0%
Cap rate
0.7%
Rent to Value Ratio
86 out of 86 properties for sale in 85048
Limited Results Shown
Create a free account, or log in to reveal all property listings and enjoy the complete experience.
Active
$514,999
4
bds
|
4
ba
|
1,751
sqft
|
built
1987
4043 E Mountain Vista Dr, Phoenix, AZ 85048
$-909
Cash flow
-9.2%
Cash-on-Cash Return
3.6%
Cap rate
0.5%
Rent to Value Ratio
Active
$695,000
6
bds
|
3
ba
|
2,956
sqft
|
built
2001
4331 E Redwood Ln, Phoenix, AZ 85048
$-1,383
Cash flow
-10.4%
Cash-on-Cash Return
3.3%
Cap rate
0.5%
Rent to Value Ratio
Active
$414,400
3
bds
|
2
ba
|
1,183
sqft
|
built
2004
16818 S 23rd St, Phoenix, AZ 85048
$-843
Cash flow
-10.6%
Cash-on-Cash Return
3.2%
Cap rate
0.5%
Rent to Value Ratio
Active
$595,000
3
bds
|
2
ba
|
1,736
sqft
|
built
1999
15634 S 31st St, Phoenix, AZ 85048
$-1,319
Cash flow
-11.6%
Cash-on-Cash Return
3.0%
Cap rate
0.4%
Rent to Value Ratio

Active
$624,500
3
bds
|
2
ba
|
1,683
sqft
|
built
1989
1228 E Mountain Vista Dr, Phoenix, AZ 85048
$-1,705
Cash flow
-14.2%
Cash-on-Cash Return
3.0%
Cap rate
0.4%
Rent to Value Ratio

Active
$594,950
3
bds
|
3
ba
|
2,191
sqft
|
built
1992
16242 S 12th Pl, Phoenix, AZ 85048
$-1,524
Cash flow
-13.4%
Cash-on-Cash Return
3.2%
Cap rate
0.5%
Rent to Value Ratio

Active
$780,000
5
bds
|
3
ba
|
3,235
sqft
|
built
1990
2549 E Desert Trumpet Rd, Phoenix, AZ 85048
$-2,222
Cash flow
-14.9%
Cash-on-Cash Return
2.8%
Cap rate
0.4%
Rent to Value Ratio

Active
$739,000
5
bds
|
3
ba
|
2,986
sqft
|
built
1990
15829 S 13th Pl, Phoenix, AZ 85048
$-2,014
Cash flow
-14.2%
Cash-on-Cash Return
3.0%
Cap rate
0.4%
Rent to Value Ratio

Active
$600,000
3
bds
|
3
ba
|
2,275
sqft
|
built
1987
16805 S 29th Pl, Phoenix, AZ 85048
$-1,226
Cash flow
-10.7%
Cash-on-Cash Return
3.8%
Cap rate
0.5%
Rent to Value Ratio
Active
$600,000
4
bds
|
3
ba
|
2,041
sqft
|
built
1995
16823 S 24th Pl, Phoenix, AZ 85048
$-1,485
Cash flow
-12.9%
Cash-on-Cash Return
3.3%
Cap rate
0.5%
Rent to Value Ratio

Active
$290,000
2
bds
|
1
ba
|
1,071
sqft
|
built
1996
3236 E Chandler Blvd, Phoenix, AZ 85048
$-648
Cash flow
-11.7%
Cash-on-Cash Return
3.6%
Cap rate
0.6%
Rent to Value Ratio

Active
$289,000
2
bds
|
2
ba
|
997
sqft
|
built
1995
3830 E Lakewood Pkwy E, Phoenix, AZ 85048
$-816
Cash flow
-14.7%
Cash-on-Cash Return
2.9%
Cap rate
0.6%
Rent to Value Ratio

Active
$775,000
4
bds
|
3
ba
|
3,111
sqft
|
built
1997
408 E Silverwood Dr, Phoenix, AZ 85048
$-1,743
Cash flow
-11.7%
Cash-on-Cash Return
3.6%
Cap rate
0.5%
Rent to Value Ratio

Active
$675,000
4
bds
|
2
ba
|
2,236
sqft
|
built
1995
15809 S 31st St, Phoenix, AZ 85048
$-1,830
Cash flow
-14.1%
Cash-on-Cash Return
3.0%
Cap rate
0.4%
Rent to Value Ratio
Active
$675,000
4
bds
|
3
ba
|
2,347
sqft
|
built
1993
14801 S 8th St, Phoenix, AZ 85048
$-1,867
Cash flow
-14.4%
Cash-on-Cash Return
2.9%
Cap rate
0.4%
Rent to Value Ratio

Active
$845,000
5
bds
|
3
ba
|
2,900
sqft
|
built
1991
1667 E Saltsage Dr, Phoenix, AZ 85048
$-2,357
Cash flow
-14.6%
Cash-on-Cash Return
2.9%
Cap rate
0.4%
Rent to Value Ratio
Active
$618,000
3
bds
|
3
ba
|
1,755
sqft
|
built
1994
1414 E Cathedral Rock Dr, Phoenix, AZ 85048
$-1,219
Cash flow
-10.3%
Cash-on-Cash Return
3.9%
Cap rate
0.5%
Rent to Value Ratio

Active
$525,000
3
bds
|
2
ba
|
1,443
sqft
|
built
1992
16044 S 41st Pl, Phoenix, AZ 85048
$-1,111
Cash flow
-11.0%
Cash-on-Cash Return
3.1%
Cap rate
0.4%
Rent to Value Ratio
Active
$949,000
5
bds
|
4
ba
|
4,007
sqft
|
built
1995
3166 E Desert Willow Rd, Phoenix, AZ 85048
$-2,368
Cash flow
-13.0%
Cash-on-Cash Return
2.7%
Cap rate
0.4%
Rent to Value Ratio
Active
$540,000
3
bds
|
2
ba
|
1,503
sqft
|
built
1995
16823 S 8th St, Phoenix, AZ 85048
$-1,452
Cash flow
-14.0%
Cash-on-Cash Return
3.0%
Cap rate
0.4%
Rent to Value Ratio
Active
$769,000
5
bds
|
3
ba
|
2,631
sqft
|
built
1991
14833 S 14th Pl, Phoenix, AZ 85048
$-2,001
Cash flow
-13.6%
Cash-on-Cash Return
3.1%
Cap rate
0.5%
Rent to Value Ratio

Active
$245,000
1
bds
|
1
ba
|
693
sqft
|
built
1995
3830 E Lakewood Pkwy E, Phoenix, AZ 85048
$-777
Cash flow
-16.5%
Cash-on-Cash Return
2.5%
Cap rate
0.5%
Rent to Value Ratio
Active
$1,480,000
4
bds
|
4
ba
|
3,859
sqft
|
built
2000
16441 S Mountain Stone Trl, Phoenix, AZ 85048
$-5,529
Cash flow
-19.5%
Cash-on-Cash Return
1.8%
Cap rate
0.3%
Rent to Value Ratio

Active
$585,000
3
bds
|
2
ba
|
1,806
sqft
|
built
1993
16633 S 14th St, Phoenix, AZ 85048
$-1,117
Cash flow
-10.0%
Cash-on-Cash Return
4.0%
Cap rate
0.5%
Rent to Value Ratio
Active
$570,000
3
bds
|
2
ba
|
1,832
sqft
|
built
1988
16235 S 39th Pl, Phoenix, AZ 85048
$-1,478
Cash flow
-13.5%
Cash-on-Cash Return
3.2%
Cap rate
0.4%
Rent to Value Ratio

Active
$570,000
4
bds
|
2
ba
|
1,817
sqft
|
built
1990
2218 E Desert Trumpet Rd, Phoenix, AZ 85048
$-1,287
Cash flow
-11.8%
Cash-on-Cash Return
3.6%
Cap rate
0.5%
Rent to Value Ratio

Active
$910,000
3
bds
|
3
ba
|
2,667
sqft
|
built
1991
1668 E Saltsage Dr, Phoenix, AZ 85048
$-3,000
Cash flow
-17.2%
Cash-on-Cash Return
2.3%
Cap rate
0.4%
Rent to Value Ratio
Active
$390,000
3
bds
|
2
ba
|
1,357
sqft
|
built
1997
16013 S Desert Foothills Pkwy, Phoenix, AZ 85048
$-1,136
Cash flow
-15.2%
Cash-on-Cash Return
2.8%
Cap rate
0.5%
Rent to Value Ratio
Active
$390,000
3
bds
|
2
ba
|
1,357
sqft
|
built
1997
16013 S Desert Foothills Pkwy, Phoenix, AZ 85048
$-874
Cash flow
-11.7%
Cash-on-Cash Return
3.6%
Cap rate
0.6%
Rent to Value Ratio

Active
$725,000
4
bds
|
3
ba
|
2,765
sqft
|
built
1992
2249 E Taxidea Way, Phoenix, AZ 85048
$-1,407
Cash flow
-10.1%
Cash-on-Cash Return
3.9%
Cap rate
0.5%
Rent to Value Ratio

Active
$600,000
3
bds
|
2
ba
|
1,953
sqft
|
built
1996
1022 E Hiddenview Dr, Phoenix, AZ 85048
$-1,224
Cash flow
-10.6%
Cash-on-Cash Return
3.8%
Cap rate
0.5%
Rent to Value Ratio
Active
$535,000
4
bds
|
3
ba
|
2,080
sqft
|
built
1992
1705 E Windsong Dr, Phoenix, AZ 85048
$-998
Cash flow
-9.7%
Cash-on-Cash Return
4.0%
Cap rate
0.5%
Rent to Value Ratio
Active
$2,200,000
4
bds
|
3
ba
|
4,651
sqft
|
built
1974
2809 E Frye Rd, Phoenix, AZ 85048
$-5,776
Cash flow
-13.7%
Cash-on-Cash Return
3.1%
Cap rate
0.4%
Rent to Value Ratio
Active
$468,000
3
bds
|
2
ba
|
1,210
sqft
|
built
1988
4112 E Tanglewood Dr, Phoenix, AZ 85048
$-669
Cash flow
-7.5%
Cash-on-Cash Return
4.5%
Cap rate
0.6%
Rent to Value Ratio
Active
$615,000
3
bds
|
2
ba
|
1,927
sqft
|
built
1994
902 E Goldenrod St, Phoenix, AZ 85048
$-1,264
Cash flow
-10.7%
Cash-on-Cash Return
3.8%
Cap rate
0.5%
Rent to Value Ratio
Active
$820,000
4
bds
|
3
ba
|
3,111
sqft
|
built
1995
16016 S 7th St, Phoenix, AZ 85048
$-1,530
Cash flow
-9.7%
Cash-on-Cash Return
4.0%
Cap rate
0.5%
Rent to Value Ratio
Active
$699,900
3
bds
|
3
ba
|
2,669
sqft
|
built
1993
16008 S 13th Way, Phoenix, AZ 85048
$-2,005
Cash flow
-14.9%
Cash-on-Cash Return
2.8%
Cap rate
0.4%
Rent to Value Ratio
Active
$939,000
6
bds
|
5
ba
|
3,580
sqft
|
built
1996
818 E Hiddenview Dr, Phoenix, AZ 85048
$-2,840
Cash flow
-15.8%
Cash-on-Cash Return
2.6%
Cap rate
0.4%
Rent to Value Ratio