85050 Investment Properties for Sale
Browse homes for sale and investment properties in 85050. Refine your search by price, property type, or more.
Best cash flowing properties in 85050
Active
$464,999
3
bds
|
2
ba
|
1,570
sqft
|
built
1994
20044 N 30th Pl, Phoenix, AZ 85050
$-572
Cash flow
-6.4%
Cash-on-Cash Return
4.2%
Cap rate
0.6%
Rent to Value Ratio
Active
$369,500
3
bds
|
3
ba
|
1,379
sqft
|
built
1988
4114 E Union Hills Dr, Phoenix, AZ 85050
$-688
Cash flow
-9.7%
Cash-on-Cash Return
3.4%
Cap rate
0.5%
Rent to Value Ratio
73 out of 74 properties for sale in 85050
Limited Results Shown
Create a free account, or log in to reveal all property listings and enjoy the complete experience.
Active
$540,000
3
bds
|
3
ba
|
1,638
sqft
|
built
1996
18823 N 39th Way, Phoenix, AZ 85050
$-1,000
Cash flow
-9.7%
Cash-on-Cash Return
3.5%
Cap rate
0.5%
Rent to Value Ratio

Active
$875,000
4
bds
|
3
ba
|
2,608
sqft
|
built
2007
21622 N 39th Ter, Phoenix, AZ 85050
$-2,289
Cash flow
-13.6%
Cash-on-Cash Return
2.5%
Cap rate
0.4%
Rent to Value Ratio

Active
$658,450
3
bds
|
2
ba
|
2,023
sqft
|
built
1995
4615 E Prickly Pear Trl, Phoenix, AZ 85050
$-1,450
Cash flow
-11.5%
Cash-on-Cash Return
3.0%
Cap rate
0.4%
Rent to Value Ratio
Active
$399,900
2
bds
|
2
ba
|
1,161
sqft
|
built
2004
20660 N 40th St, Phoenix, AZ 85050
$-1,048
Cash flow
-13.7%
Cash-on-Cash Return
2.5%
Cap rate
0.5%
Rent to Value Ratio
Active
$420,000
2
bds
|
2
ba
|
1,228
sqft
|
built
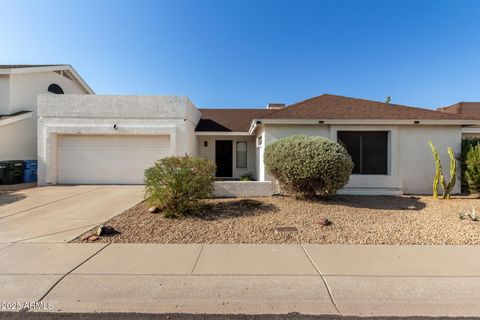
1989
3228 E Taro Ln, Phoenix, AZ 85050
$-781
Cash flow
-9.7%
Cash-on-Cash Return
3.4%
Cap rate
0.5%
Rent to Value Ratio
Active
$479,800
3
bds
|
2
ba
|
1,314
sqft
|
built
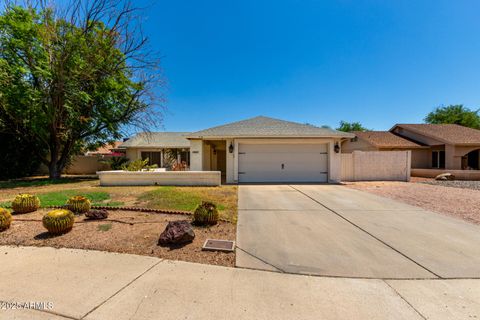
1986
18807 N 37th Pl, Phoenix, AZ 85050
$-860
Cash flow
-9.4%
Cash-on-Cash Return
3.5%
Cap rate
0.5%
Rent to Value Ratio
Active
$594,000
3
bds
|
2
ba
|
1,508
sqft
|
built
1996
4441 E Tether Trl, Phoenix, AZ 85050
$-1,297
Cash flow
-11.4%
Cash-on-Cash Return
3.1%
Cap rate
0.4%
Rent to Value Ratio
Active
$520,000
3
bds
|
3
ba
|
1,444
sqft
|
built
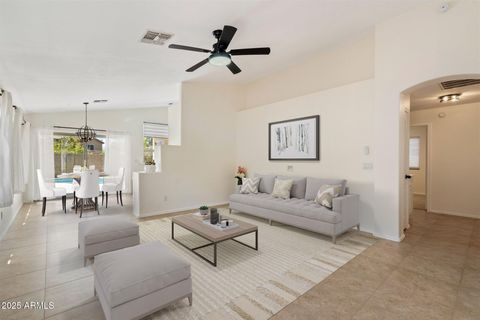
2010
3651 E Zachary Dr, Phoenix, AZ 85050
$-1,279
Cash flow
-12.8%
Cash-on-Cash Return
2.7%
Cap rate
0.5%
Rent to Value Ratio
Active
$660,000
5
bds
|
3
ba
|
2,253
sqft
|
built
1951
2940 E Union Hills Dr, Phoenix, AZ 85050
$-1,312
Cash flow
-10.4%
Cash-on-Cash Return
3.3%
Cap rate
0.4%
Rent to Value Ratio
Active
$560,000
3
bds
|
3
ba
|
2,017
sqft
|
built
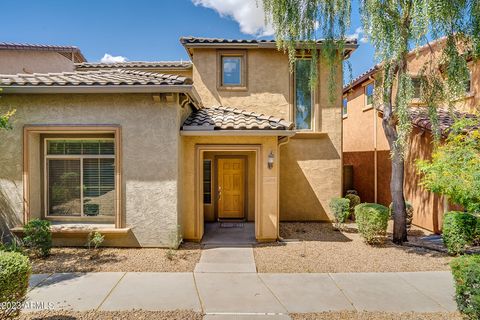
2006
3935 E Rough Rider Rd, Phoenix, AZ 85050
$-1,089
Cash flow
-10.1%
Cash-on-Cash Return
3.3%
Cap rate
0.6%
Rent to Value Ratio

Active
$450,000
3
bds
|
2
ba
|
1,370
sqft
|
built
1997
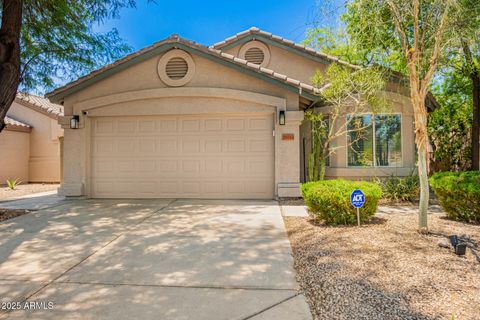
3242 E Kristal Way, Phoenix, AZ 85050
$-783
Cash flow
-9.1%
Cash-on-Cash Return
3.6%
Cap rate
0.5%
Rent to Value Ratio
Active
$595,000
3
bds
|
2
ba
|
1,971
sqft
|
built
1991
3425 E Rosemonte Dr, Phoenix, AZ 85050
$-1,322
Cash flow
-11.6%
Cash-on-Cash Return
3.0%
Cap rate
0.4%
Rent to Value Ratio
Active
$819,000
5
bds
|
3
ba
|
2,713
sqft
|
built
1997
25830 N 40th Pl, Phoenix, AZ 85050
$-1,770
Cash flow
-11.3%
Cash-on-Cash Return
3.1%
Cap rate
0.4%
Rent to Value Ratio
Active
$810,000
4
bds
|
4
ba
|
2,734
sqft
|
built
1997
4025 E Paso Trl, Phoenix, AZ 85050
$-1,692
Cash flow
-10.9%
Cash-on-Cash Return
3.2%
Cap rate
0.4%
Rent to Value Ratio
Active
$939,999
4
bds
|
2
ba
|
2,471
sqft
|
built
1996
4010 E Hamblin Dr, Phoenix, AZ 85050
$-2,378
Cash flow
-13.2%
Cash-on-Cash Return
2.6%
Cap rate
0.4%
Rent to Value Ratio
Active
$665,000
4
bds
|
3
ba
|
2,041
sqft
|
built
2000
20722 N 38th St, Phoenix, AZ 85050
$-997
Cash flow
-7.8%
Cash-on-Cash Return
3.9%
Cap rate
0.5%
Rent to Value Ratio
Active
$695,000
4
bds
|
2
ba
|
1,845
sqft
|
built
1996
4440 E Tether Trl, Phoenix, AZ 85050
$-876
Cash flow
-6.6%
Cash-on-Cash Return
4.2%
Cap rate
0.6%
Rent to Value Ratio
Active
$1,085,000
4
bds
|
4
ba
|
2,984
sqft
|
built
1996
4511 E Kirkland Rd, Phoenix, AZ 85050
$-2,819
Cash flow
-13.6%
Cash-on-Cash Return
2.6%
Cap rate
0.4%
Rent to Value Ratio
Active
$964,999
3
bds
|
3
ba
|
2,380
sqft
|
built
2020
22218 N 28th St, Phoenix, AZ 85050
$-2,721
Cash flow
-14.7%
Cash-on-Cash Return
2.3%
Cap rate
0.4%
Rent to Value Ratio
Active
$500,000
2
bds
|
2
ba
|
1,940
sqft
|
built
2006
3935 E Rough Rider Rd, Phoenix, AZ 85050
$-1,060
Cash flow
-11.1%
Cash-on-Cash Return
3.1%
Cap rate
0.6%
Rent to Value Ratio
Active
$930,000
3
bds
|
2
ba
|
2,042
sqft
|
built
2020
3411 E Louise Dr, Phoenix, AZ 85050
$-1,998
Cash flow
-11.2%
Cash-on-Cash Return
3.1%
Cap rate
0.4%
Rent to Value Ratio
Active
$1,319,999
4
bds
|
4
ba
|
3,842
sqft
|
built
2021
22306 N 34th Pl, Phoenix, AZ 85050
$-4,244
Cash flow
-16.8%
Cash-on-Cash Return
1.8%
Cap rate
0.3%
Rent to Value Ratio
Active
$935,000
5
bds
|
3
ba
|
3,508
sqft
|
built
2011
23116 N 41st St, Phoenix, AZ 85050
$-1,874
Cash flow
-10.5%
Cash-on-Cash Return
3.3%
Cap rate
0.5%
Rent to Value Ratio
Active
$679,900
4
bds
|
2
ba
|
1,962
sqft
|
built
1997
4506 E Lone Cactus Dr, Phoenix, AZ 85050
$-1,302
Cash flow
-10.0%
Cash-on-Cash Return
3.4%
Cap rate
0.5%
Rent to Value Ratio

Active
$550,000
3
bds
|
3
ba
|
1,448
sqft
|
built
2008
3932 E Melinda Dr, Phoenix, AZ 85050
$-1,409
Cash flow
-13.4%
Cash-on-Cash Return
2.6%
Cap rate
0.5%
Rent to Value Ratio
Active
$1,697,000
5
bds
|
4
ba
|
3,984
sqft
|
built
2007
3741 E Ember Glow Way, Phoenix, AZ 85050
$-3,914
Cash flow
-12.0%
Cash-on-Cash Return
2.9%
Cap rate
0.4%
Rent to Value Ratio
Active
$575,000
3
bds
|
2
ba
|
1,530
sqft
|
built
1988
4525 E Rosemonte Dr, Phoenix, AZ 85050
$-1,245
Cash flow
-11.3%
Cash-on-Cash Return
3.1%
Cap rate
0.4%
Rent to Value Ratio
Active
$484,900
3
bds
|
2
ba
|
1,397
sqft
|
built
2007
3756 E Kerry Ln, Phoenix, AZ 85050
$-1,042
Cash flow
-11.2%
Cash-on-Cash Return
3.1%
Cap rate
0.5%
Rent to Value Ratio

Active
$564,000
3
bds
|
2
ba
|
1,705
sqft
|
built
1995
4714 E Paso Trl, Phoenix, AZ 85050
$-986
Cash flow
-9.1%
Cash-on-Cash Return
3.6%
Cap rate
0.5%
Rent to Value Ratio
Active
$439,000
1
bds
|
2
ba
|
1,490
sqft
|
built
2007
3935 E Rough Rider Rd, Phoenix, AZ 85050
$-1,140
Cash flow
-13.5%
Cash-on-Cash Return
2.6%
Cap rate
0.5%
Rent to Value Ratio
Active
$528,500
3
bds
|
2
ba
|
1,491
sqft
|
built
1996
3353 E Blackhawk Dr, Phoenix, AZ 85050
$-1,114
Cash flow
-11.0%
Cash-on-Cash Return
3.1%
Cap rate
0.4%
Rent to Value Ratio
Active
$528,900
3
bds
|
3
ba
|
1,751
sqft
|
built
2007
4363 E Morrow Dr, Phoenix, AZ 85050
$-1,245
Cash flow
-12.3%
Cash-on-Cash Return
2.9%
Cap rate
0.4%
Rent to Value Ratio
Active
$499,950
3
bds
|
2
ba
|
1,705
sqft
|
built
1998
26201 N 47th Pl, Phoenix, AZ 85050
$-770
Cash flow
-8.0%
Cash-on-Cash Return
3.8%
Cap rate
0.5%
Rent to Value Ratio
Active
$599,000
3
bds
|
2
ba
|
1,860
sqft
|
built
1988
19206 N 40th St, Phoenix, AZ 85050
$-1,123
Cash flow
-9.8%
Cash-on-Cash Return
3.4%
Cap rate
0.5%
Rent to Value Ratio
Active
$549,995
3
bds
|
2
ba
|
1,845
sqft
|
built
1997
4454 E Rowel Rd, Phoenix, AZ 85050
$-922
Cash flow
-8.7%
Cash-on-Cash Return
3.7%
Cap rate
0.5%
Rent to Value Ratio
Active
$1,189,900
4
bds
|
4
ba
|
3,812
sqft
|
built
2009
3829 E Rockingham Rd, Phoenix, AZ 85050
$-1,835
Cash flow
-8.0%
Cash-on-Cash Return
3.8%
Cap rate
0.5%
Rent to Value Ratio
Active
$530,000
3
bds
|
3
ba
|
1,875
sqft
|
built
2010
21136 N 36th Pl, Phoenix, AZ 85050
$-1,084
Cash flow
-10.7%
Cash-on-Cash Return
3.2%
Cap rate
0.5%
Rent to Value Ratio
Active
$565,000
3
bds
|
2
ba
|
1,325
sqft
|
built
1990
19651 N 34th St, Phoenix, AZ 85050
$-1,293
Cash flow
-11.9%
Cash-on-Cash Return
2.9%
Cap rate
0.4%
Rent to Value Ratio