85053 Investment Properties for Sale
Browse homes for sale and investment properties in 85053. Refine your search by price, property type, or more.
Best cash flowing properties in 85053
Active
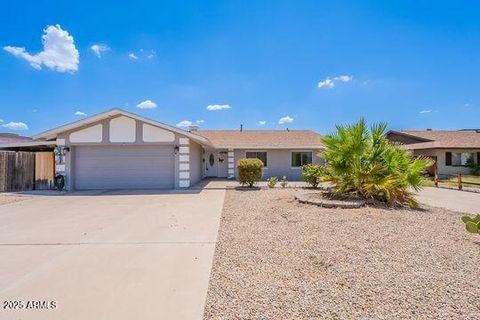
$595,000
4
bds
|
3
ba
|
2,482
sqft
|
built
1997
16050 N 35th Dr, Phoenix, AZ 85053
$-196
Cash flow
-1.7%
Cash-on-Cash Return
5.3%
Cap rate
0.7%
Rent to Value Ratio

Active
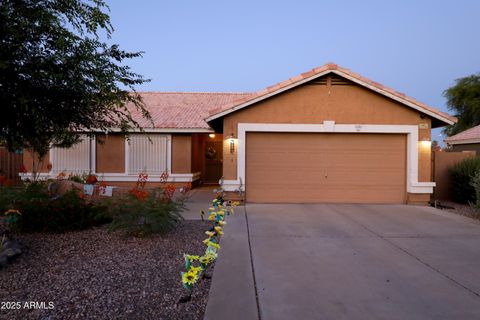
$325,000
4
bds
|
2
ba
|
1,232
sqft
|
built
1972
14620 N 31st Ln, Phoenix, AZ 85053
$-237
Cash flow
-3.8%
Cash-on-Cash Return
4.8%
Cap rate
0.6%
Rent to Value Ratio
60 out of 64 properties for sale in 85053
Limited Results Shown
Create a free account, or log in to reveal all property listings and enjoy the complete experience.
Active
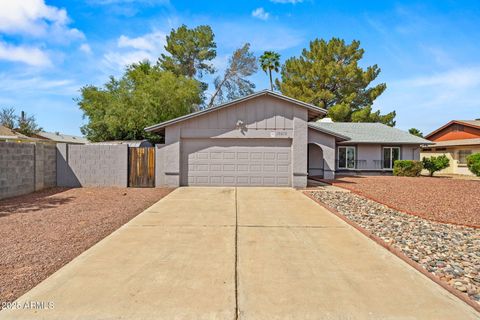
$350,000
2
bds
|
1
ba
|
936
sqft
|
built
1978
3150 W Michelle Dr, Phoenix, AZ 85053
$-466
Cash flow
-6.9%
Cash-on-Cash Return
4.1%
Cap rate
0.5%
Rent to Value Ratio
Active
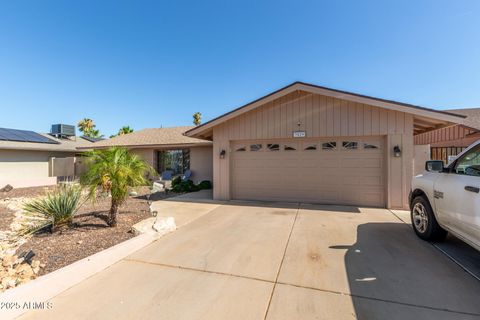
$545,000
4
bds
|
3
ba
|
2,291
sqft
|
built
1979
3525 W Kings Ave, Phoenix, AZ 85053
$-574
Cash flow
-5.5%
Cash-on-Cash Return
4.4%
Cap rate
0.6%
Rent to Value Ratio
Active
$420,000
3
bds
|
2
ba
|
1,510
sqft
|
built
1973
14010 N 42nd Dr, Phoenix, AZ 85053
$-570
Cash flow
-7.1%
Cash-on-Cash Return
4.1%
Cap rate
0.5%
Rent to Value Ratio
Active
$479,000
3
bds
|
2
ba
|
1,708
sqft
|
built
1967
3201 W Acoma Dr, Phoenix, AZ 85053
$-802
Cash flow
-8.7%
Cash-on-Cash Return
3.7%
Cap rate
0.5%
Rent to Value Ratio

Active
$499,900
5
bds
|
4
ba
|
2,360
sqft
|
built
1969
3842 W Mauna Loa Ln, Phoenix, AZ 85053
$-578
Cash flow
-6.0%
Cash-on-Cash Return
4.3%
Cap rate
0.6%
Rent to Value Ratio

Active
$519,000
4
bds
|
3
ba
|
2,083
sqft
|
built
1973
4152 W Crocus Dr, Phoenix, AZ 85053
$-394
Cash flow
-4.0%
Cash-on-Cash Return
4.8%
Cap rate
0.6%
Rent to Value Ratio

Active
$422,500
3
bds
|
2
ba
|
1,430
sqft
|
built
1983
16648 N 30th Ave, Phoenix, AZ 85053
$-1,158
Cash flow
-14.3%
Cash-on-Cash Return
2.4%
Cap rate
0.4%
Rent to Value Ratio

Active
$449,500
3
bds
|
2
ba
|
1,510
sqft
|
built
1974
13842 N 40th Ave, Phoenix, AZ 85053
$-379
Cash flow
-4.4%
Cash-on-Cash Return
4.7%
Cap rate
0.6%
Rent to Value Ratio
Active
$425,000
3
bds
|
2
ba
|
1,691
sqft
|
built
1997
16011 N 35th Dr, Phoenix, AZ 85053
$-742
Cash flow
-9.1%
Cash-on-Cash Return
3.6%
Cap rate
0.5%
Rent to Value Ratio

Active
$334,900
3
bds
|
2
ba
|
1,392
sqft
|
built
1971
2823 W Banff Ln, Phoenix, AZ 85053
$-428
Cash flow
-6.7%
Cash-on-Cash Return
4.1%
Cap rate
0.5%
Rent to Value Ratio
Active
$435,000
3
bds
|
2
ba
|
1,721
sqft
|
built
1978
16412 N 33rd Ave, Phoenix, AZ 85053
$-814
Cash flow
-9.8%
Cash-on-Cash Return
3.4%
Cap rate
0.5%
Rent to Value Ratio

Active
$455,900
4
bds
|
2
ba
|
2,020
sqft
|
built
1968
3447 W Dailey St, Phoenix, AZ 85053
$-254
Cash flow
-2.9%
Cash-on-Cash Return
5.0%
Cap rate
0.6%
Rent to Value Ratio

Active
$400,000
5
bds
|
2
ba
|
2,127
sqft
|
built
1966
3222 W Hearn Rd, Phoenix, AZ 85053
$-445
Cash flow
-5.8%
Cash-on-Cash Return
4.3%
Cap rate
0.6%
Rent to Value Ratio

Active
$364,000
3
bds
|
2
ba
|
1,160
sqft
|
built
1979
3222 W Wagoner Rd, Phoenix, AZ 85053
$-418
Cash flow
-6.0%
Cash-on-Cash Return
4.3%
Cap rate
0.5%
Rent to Value Ratio

Active
$436,000
3
bds
|
2
ba
|
1,806
sqft
|
built
1974
3054 W Redfield Rd, Phoenix, AZ 85053
$-471
Cash flow
-5.6%
Cash-on-Cash Return
4.4%
Cap rate
0.6%
Rent to Value Ratio

Active
$460,000
4
bds
|
3
ba
|
2,228
sqft
|
built
1973
4136 W Hearn Rd, Phoenix, AZ 85053
$-585
Cash flow
-6.6%
Cash-on-Cash Return
4.2%
Cap rate
0.5%
Rent to Value Ratio

Active
$199,000
2
bds
|
1
ba
|
784
sqft
|
built
1985
3601 W Tierra Buena Ln, Phoenix, AZ 85053
$-314
Cash flow
-8.2%
Cash-on-Cash Return
3.8%
Cap rate
0.7%
Rent to Value Ratio

Active
$530,000
3
bds
|
2
ba
|
1,829
sqft
|
built
1979
3833 W Phelps Rd, Phoenix, AZ 85053
$-941
Cash flow
-9.3%
Cash-on-Cash Return
3.5%
Cap rate
0.5%
Rent to Value Ratio

Active
$402,000
3
bds
|
2
ba
|
1,475
sqft
|
built
1973
3708 W Redfield Rd, Phoenix, AZ 85053
$-626
Cash flow
-8.1%
Cash-on-Cash Return
3.8%
Cap rate
0.5%
Rent to Value Ratio

Active
$465,000
4
bds
|
2
ba
|
1,966
sqft
|
built
1977
3917 W Juniper Ave, Phoenix, AZ 85053
$-642
Cash flow
-7.2%
Cash-on-Cash Return
4.0%
Cap rate
0.5%
Rent to Value Ratio

Active
$425,000
3
bds
|
2
ba
|
1,556
sqft
|
built
1978
17820 N 29th Ave, Phoenix, AZ 85053
$-513
Cash flow
-6.3%
Cash-on-Cash Return
4.2%
Cap rate
0.5%
Rent to Value Ratio
Active
$455,900
3
bds
|
2
ba
|
1,852
sqft
|
built
1971
3529 W Saint Moritz Ln, Phoenix, AZ 85053
$-556
Cash flow
-6.4%
Cash-on-Cash Return
4.2%
Cap rate
0.5%
Rent to Value Ratio

Active
$389,999
4
bds
|
2
ba
|
1,640
sqft
|
built
1977
2941 W Michigan Ave, Phoenix, AZ 85053
$-570
Cash flow
-7.6%
Cash-on-Cash Return
3.9%
Cap rate
0.5%
Rent to Value Ratio

Active
$410,900
4
bds
|
2
ba
|
1,799
sqft
|
built
1974
14412 N 39th Ave, Phoenix, AZ 85053
$-552
Cash flow
-7.0%
Cash-on-Cash Return
4.1%
Cap rate
0.5%
Rent to Value Ratio

Active
$415,000
3
bds
|
2
ba
|
1,893
sqft
|
built
1973
14009 N 42nd Ave, Phoenix, AZ 85053
$-500
Cash flow
-6.3%
Cash-on-Cash Return
4.2%
Cap rate
0.6%
Rent to Value Ratio

Active
$495,000
4
bds
|
2
ba
|
1,930
sqft
|
built
1977
14014 N 39th Ave, Phoenix, AZ 85053
$-960
Cash flow
-10.1%
Cash-on-Cash Return
3.4%
Cap rate
0.4%
Rent to Value Ratio

Active
$395,000
3
bds
|
2
ba
|
1,630
sqft
|
built
1982
16629 N 30th Ave, Phoenix, AZ 85053
$-904
Cash flow
-11.9%
Cash-on-Cash Return
2.9%
Cap rate
0.5%
Rent to Value Ratio

Active
$415,000
2
bds
|
2
ba
|
1,190
sqft
|
built
1983
2828 W Wagoner Rd, Phoenix, AZ 85053
$-693
Cash flow
-8.7%
Cash-on-Cash Return
3.7%
Cap rate
0.5%
Rent to Value Ratio
Active
$449,900
3
bds
|
2
ba
|
1,754
sqft
|
built
1974
3021 W Angela Dr, Phoenix, AZ 85053
$-875
Cash flow
-10.1%
Cash-on-Cash Return
3.3%
Cap rate
0.4%
Rent to Value Ratio

Active
$437,000
4
bds
|
2
ba
|
1,632
sqft
|
built
1968
3411 W Redfield Rd, Phoenix, AZ 85053
$-659
Cash flow
-7.9%
Cash-on-Cash Return
3.9%
Cap rate
0.5%
Rent to Value Ratio
Active
$305,000
2
bds
|
1
ba
|
954
sqft
|
built
1975
17841 N 33rd Dr, Phoenix, AZ 85053
$-257
Cash flow
-4.4%
Cash-on-Cash Return
4.7%
Cap rate
0.6%
Rent to Value Ratio
Active
$385,000
4
bds
|
2
ba
|
1,850
sqft
|
built
1974
3953 W Evans Dr, Phoenix, AZ 85053
$-600
Cash flow
-8.1%
Cash-on-Cash Return
3.8%
Cap rate
0.5%
Rent to Value Ratio

Active
$379,000
3
bds
|
2
ba
|
1,540
sqft
|
built
1972
13801 N 37th Dr, Phoenix, AZ 85053
$-668
Cash flow
-9.2%
Cash-on-Cash Return
3.6%
Cap rate
0.5%
Rent to Value Ratio

Active
$445,000
4
bds
|
2
ba
|
1,934
sqft
|
built
1979
3144 W Juniper Ave, Phoenix, AZ 85053
$-715
Cash flow
-8.4%
Cash-on-Cash Return
3.8%
Cap rate
0.5%
Rent to Value Ratio

Active
$484,900
4
bds
|
4
ba
|
2,360
sqft
|
built
1968
13824 N 34th Ave, Phoenix, AZ 85053
$-645
Cash flow
-6.9%
Cash-on-Cash Return
4.1%
Cap rate
0.5%
Rent to Value Ratio

Active
$499,900
3
bds
|
2
ba
|
1,935
sqft
|
built
1976
3401 W Sandra Ter, Phoenix, AZ 85053
$-1,012
Cash flow
-10.6%
Cash-on-Cash Return
3.3%
Cap rate
0.4%
Rent to Value Ratio

Active
$450,000
4
bds
|
3
ba
|
2,503
sqft
|
built
1971
3121 W Greenway Rd, Phoenix, AZ 85053
$-378
Cash flow
-4.4%
Cash-on-Cash Return
4.7%
Cap rate
0.6%
Rent to Value Ratio

Active
$599,000
4
bds
|
3
ba
|
2,450
sqft
|
built
1979
3371 W Grandview Rd, Phoenix, AZ 85053
$-1,495
Cash flow
-13.0%
Cash-on-Cash Return
2.7%
Cap rate
0.4%
Rent to Value Ratio