85085 Investment Properties for Sale
Browse homes for sale and investment properties in 85085. Refine your search by price, property type, or more.
Best cash flowing properties in 85085
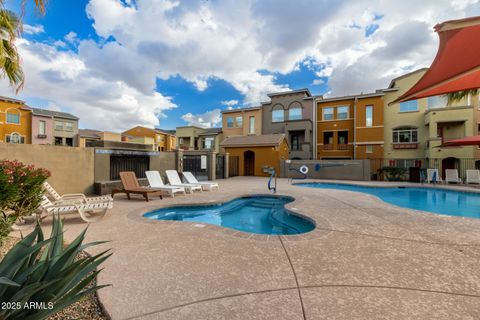
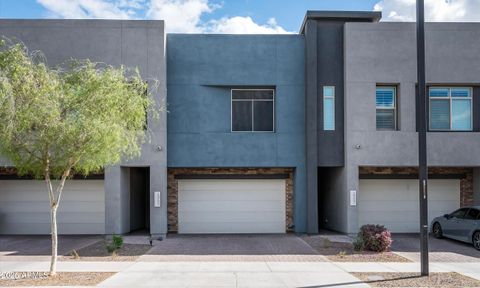
Active
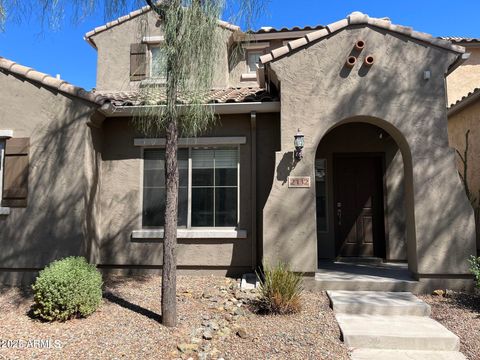
$345,000
3
bds
|
3
ba
|
1,394
sqft
|
built
2007
2150 W Alameda Rd, Phoenix, AZ 85085
$-456
Cash flow
-6.9%
Cash-on-Cash Return
4.1%
Cap rate
0.6%
Rent to Value Ratio
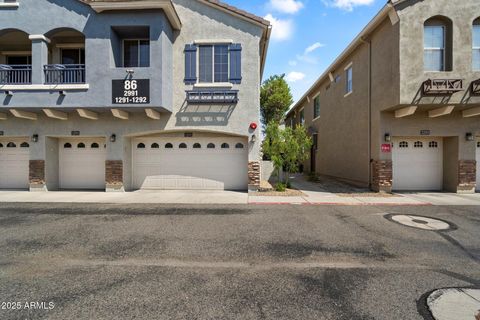
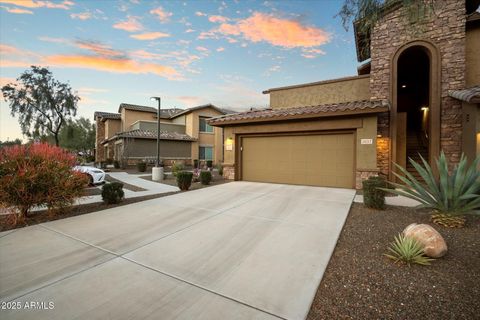
Active
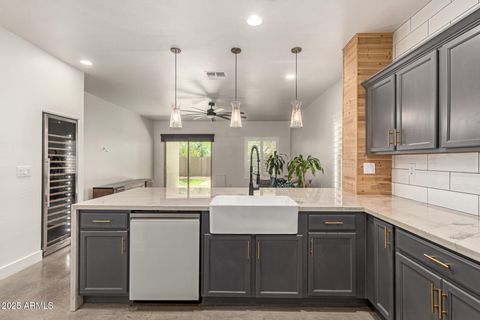
$365,000
3
bds
|
3
ba
|
1,478
sqft
|
built
2016
2150 W Alameda Rd, Phoenix, AZ 85085
$-546
Cash flow
-7.8%
Cash-on-Cash Return
3.9%
Cap rate
0.6%
Rent to Value Ratio
80 out of 92 properties for sale in 85085
Limited Results Shown
Create a free account, or log in to reveal all property listings and enjoy the complete experience.
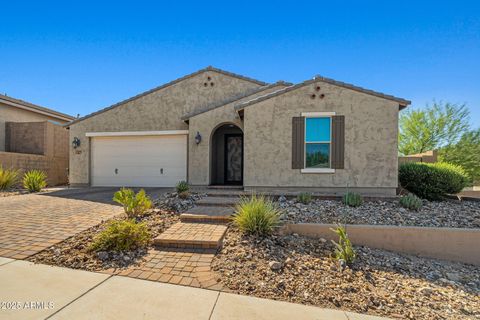
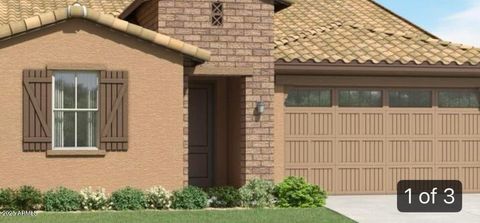
Active
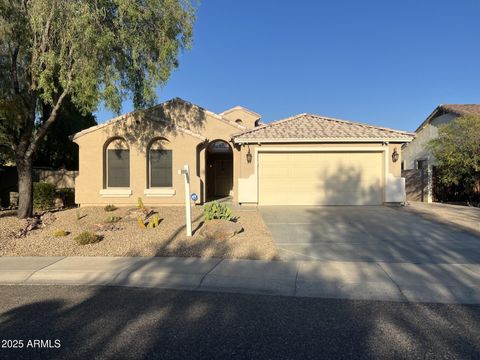
$778,900
4
bds
|
3
ba
|
2,532
sqft
|
built
2017
2929 W Amber Sun Dr, Phoenix, AZ 85085
$-1,627
Cash flow
-10.9%
Cash-on-Cash Return
3.2%
Cap rate
0.4%
Rent to Value Ratio
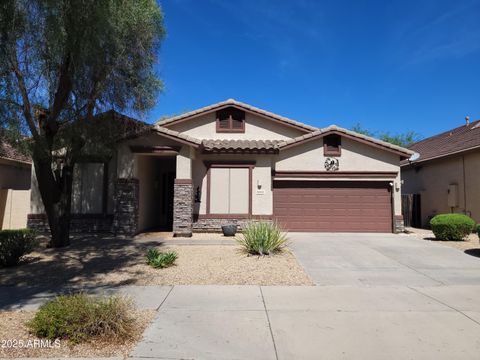
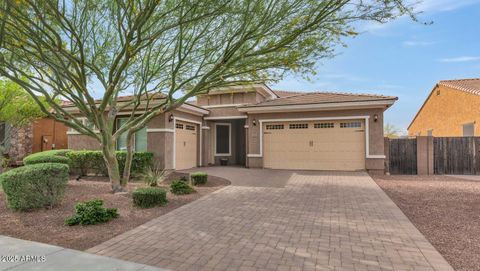
Active
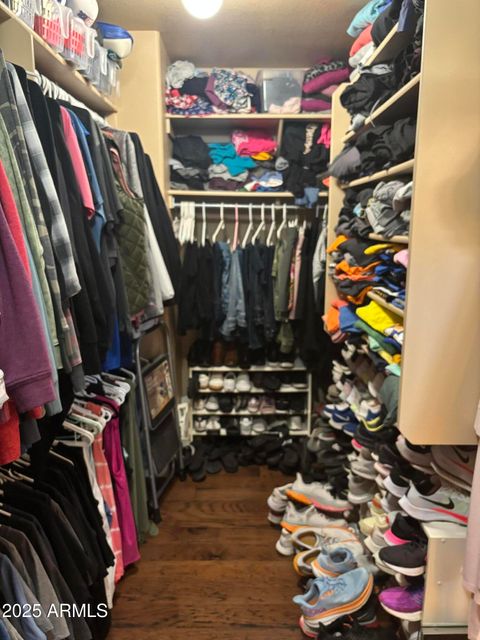
$575,000
3
bds
|
2
ba
|
1,922
sqft
|
built
2004
31912 N 23rd Ave, Phoenix, AZ 85085
$-1,334
Cash flow
-12.1%
Cash-on-Cash Return
2.9%
Cap rate
0.4%
Rent to Value Ratio
Active
$460,000
3
bds
|
3
ba
|
1,882
sqft
|
built
2005
2366 W Sleepy Ranch Rd, Phoenix, AZ 85085
$-1,031
Cash flow
-11.7%
Cash-on-Cash Return
3.0%
Cap rate
0.5%
Rent to Value Ratio

Active
$460,000
2
bds
|
2
ba
|
1,662
sqft
|
built
2019
2425 W Bronco Butte Trl, Phoenix, AZ 85085
$-1,248
Cash flow
-14.2%
Cash-on-Cash Return
2.4%
Cap rate
0.5%
Rent to Value Ratio
Active
$565,000
3
bds
|
2
ba
|
1,619
sqft
|
built
2016
1846 W Bonanza Dr, Phoenix, AZ 85085
$-1,173
Cash flow
-10.8%
Cash-on-Cash Return
3.2%
Cap rate
0.5%
Rent to Value Ratio

Active
$799,900
3
bds
|
2
ba
|
2,366
sqft
|
built
2013
1526 W Molly Ln, Phoenix, AZ 85085
$-2,153
Cash flow
-14.0%
Cash-on-Cash Return
2.4%
Cap rate
0.4%
Rent to Value Ratio

Active
$853,393
4
bds
|
4
ba
|
3,171
sqft
|
built
2019
531 E Pasaro Dr, Phoenix, AZ 85085
$-2,270
Cash flow
-13.9%
Cash-on-Cash Return
2.5%
Cap rate
0.4%
Rent to Value Ratio
Active
$595,000
3
bds
|
2
ba
|
1,754
sqft
|
built
2016
1850 W Bonanza Dr, Phoenix, AZ 85085
$-1,043
Cash flow
-9.1%
Cash-on-Cash Return
3.6%
Cap rate
0.5%
Rent to Value Ratio
Active
$677,888
4
bds
|
2
ba
|
2,339
sqft
|
built
2005
26815 N 21st Dr, Phoenix, AZ 85085
$-1,579
Cash flow
-12.2%
Cash-on-Cash Return
2.9%
Cap rate
0.4%
Rent to Value Ratio
Active
$599,000
4
bds
|
3
ba
|
2,155
sqft
|
built
2017
2350 W Gloria Ln, Phoenix, AZ 85085
$-1,280
Cash flow
-11.1%
Cash-on-Cash Return
3.1%
Cap rate
0.5%
Rent to Value Ratio
Active
$795,000
4
bds
|
4
ba
|
3,321
sqft
|
built
2018
31314 N 1st Pl, Phoenix, AZ 85085
$-1,762
Cash flow
-11.6%
Cash-on-Cash Return
3.0%
Cap rate
0.4%
Rent to Value Ratio
Active
$985,000
4
bds
|
4
ba
|
3,593
sqft
|
built
2020
25909 N 19th Ln, Phoenix, AZ 85085
$-2,048
Cash flow
-10.8%
Cash-on-Cash Return
3.2%
Cap rate
0.4%
Rent to Value Ratio
Active
$879,500
5
bds
|
3
ba
|
3,296
sqft
|
built
2005
2332 W Andrea Dr, Phoenix, AZ 85085
$-2,371
Cash flow
-14.1%
Cash-on-Cash Return
2.4%
Cap rate
0.4%
Rent to Value Ratio
Active
$697,000
4
bds
|
3
ba
|
2,022
sqft
|
built
2021
2013 W Plum Rd, Phoenix, AZ 85085
$-1,745
Cash flow
-13.1%
Cash-on-Cash Return
2.7%
Cap rate
0.4%
Rent to Value Ratio
Active
$739,900
3
bds
|
3
ba
|
2,691
sqft
|
built
2004
2341 W Bramble Berry Ln, Phoenix, AZ 85085
$-1,739
Cash flow
-12.3%
Cash-on-Cash Return
2.9%
Cap rate
0.4%
Rent to Value Ratio
Active
$989,999
5
bds
|
4
ba
|
4,623
sqft
|
built
2007
2409 W Quail Track Dr, Phoenix, AZ 85085
$-2,062
Cash flow
-10.9%
Cash-on-Cash Return
3.2%
Cap rate
0.4%
Rent to Value Ratio
Active
$999,900
3
bds
|
4
ba
|
2,845
sqft
|
built
2021
1948 W Paso Trl, Phoenix, AZ 85085
$-2,677
Cash flow
-14.0%
Cash-on-Cash Return
2.5%
Cap rate
0.4%
Rent to Value Ratio
Active
$670,000
4
bds
|
3
ba
|
2,118
sqft
|
built
2016
31324 N 26th Gln, Phoenix, AZ 85085
$-1,251
Cash flow
-9.7%
Cash-on-Cash Return
3.4%
Cap rate
0.5%
Rent to Value Ratio
Active
$674,900
4
bds
|
3
ba
|
1,914
sqft
|
built
2020
2023 W Yellowbird Ln, Phoenix, AZ 85085
$-1,457
Cash flow
-11.3%
Cash-on-Cash Return
3.1%
Cap rate
0.5%
Rent to Value Ratio
Active
$829,000
3
bds
|
2
ba
|
2,014
sqft
|
built
2019
549 E Balao Dr, Phoenix, AZ 85085
$-1,642
Cash flow
-10.3%
Cash-on-Cash Return
3.3%
Cap rate
0.5%
Rent to Value Ratio
Active
$609,650
3
bds
|
3
ba
|
1,955
sqft
|
built
2021
1910 W Desert Hollow Dr, Phoenix, AZ 85085
$-1,352
Cash flow
-11.6%
Cash-on-Cash Return
3.0%
Cap rate
0.5%
Rent to Value Ratio
Active
$745,000
4
bds
|
2
ba
|
2,550
sqft
|
built
1997
18 E Paint Your Wagon Trl, Phoenix, AZ 85085
$-1,443
Cash flow
-10.1%
Cash-on-Cash Return
3.4%
Cap rate
0.5%
Rent to Value Ratio

Active
$779,500
5
bds
|
3
ba
|
4,091
sqft
|
built
2005
2307 W Sienna Bouquet Pl, Phoenix, AZ 85085
$-2,027
Cash flow
-13.6%
Cash-on-Cash Return
2.6%
Cap rate
0.4%
Rent to Value Ratio

Active
$840,000
4
bds
|
3
ba
|
3,028
sqft
|
built
2020
31020 N 5th St, Phoenix, AZ 85085
$-1,259
Cash flow
-7.8%
Cash-on-Cash Return
3.9%
Cap rate
0.5%
Rent to Value Ratio
Active
$1,300,000
6
bds
|
5
ba
|
4,305
sqft
|
built
2021
26112 N 7th Ave, Phoenix, AZ 85085
$-4,022
Cash flow
-16.1%
Cash-on-Cash Return
2.0%
Cap rate
0.3%
Rent to Value Ratio

Active
$675,000
4
bds
|
3
ba
|
2,430
sqft
|
built
2019
608 E Pasaro Dr, Phoenix, AZ 85085
$-1,524
Cash flow
-11.8%
Cash-on-Cash Return
3.0%
Cap rate
0.4%
Rent to Value Ratio
Active
$1,022,900
4
bds
|
4
ba
|
2,983
sqft
|
built
2022
2013 W El Cortez Trl, Phoenix, AZ 85085
$-3,002
Cash flow
-15.3%
Cash-on-Cash Return
2.2%
Cap rate
0.3%
Rent to Value Ratio
Active
$750,000
4
bds
|
4
ba
|
4,242
sqft
|
built
2004
2423 W Bramble Berry Ln, Phoenix, AZ 85085
$-1,950
Cash flow
-13.6%
Cash-on-Cash Return
2.6%
Cap rate
0.4%
Rent to Value Ratio
Active
$594,000
3
bds
|
3
ba
|
2,354
sqft
|
built
2021
1953 W Kinfield Trl, Phoenix, AZ 85085
$-1,321
Cash flow
-11.6%
Cash-on-Cash Return
3.0%
Cap rate
0.5%
Rent to Value Ratio

Active
$785,000
4
bds
|
4
ba
|
2,928
sqft
|
built
2006
1807 W Sierra Sunset Trl, Phoenix, AZ 85085
$-1,541
Cash flow
-10.2%
Cash-on-Cash Return
3.3%
Cap rate
0.5%
Rent to Value Ratio
Active
$445,000
2
bds
|
2
ba
|
1,817
sqft
|
built
2014
2425 W Bronco Butte Trl, Phoenix, AZ 85085
$-939
Cash flow
-11.0%
Cash-on-Cash Return
3.1%
Cap rate
0.6%
Rent to Value Ratio

Active
$429,999
2
bds
|
2
ba
|
1,662
sqft
|
built
2014
2425 W Bronco Butte Trl, Phoenix, AZ 85085
$-897
Cash flow
-10.9%
Cash-on-Cash Return
3.2%
Cap rate
0.6%
Rent to Value Ratio
Active
$750,000
4
bds
|
3
ba
|
2,524
sqft
|
built
2023
2033 W Burnside Trl, Phoenix, AZ 85085
$-1,475
Cash flow
-10.3%
Cash-on-Cash Return
3.3%
Cap rate
0.5%
Rent to Value Ratio
Active
$739,900
4
bds
|
3
ba
|
2,469
sqft
|
built
2016
2605 W Desert Marigold Dr, Phoenix, AZ 85085
$-1,428
Cash flow
-10.1%
Cash-on-Cash Return
3.4%
Cap rate
0.5%
Rent to Value Ratio
Active
$515,000
4
bds
|
3
ba
|
1,772
sqft
|
built
2007
2132 W Barwick Dr, Phoenix, AZ 85085
$-1,021
Cash flow
-10.3%
Cash-on-Cash Return
3.3%
Cap rate
0.4%
Rent to Value Ratio
Active
$589,000
3
bds
|
2
ba
|
1,501
sqft
|
built
2012
1653 W Straight Arrow Ln, Phoenix, AZ 85085
$-1,447
Cash flow
-12.8%
Cash-on-Cash Return
2.7%
Cap rate
0.4%
Rent to Value Ratio
Active
$575,000
3
bds
|
2
ba
|
1,844
sqft
|
built
2005
29011 N 23rd Dr, Phoenix, AZ 85085
$-1,021
Cash flow
-9.3%
Cash-on-Cash Return
3.5%
Cap rate
0.5%
Rent to Value Ratio
Active
$554,000
4
bds
|
3
ba
|
2,294
sqft
|
built
2005
2411 W Lucia Dr, Phoenix, AZ 85085
$-1,123
Cash flow
-10.6%
Cash-on-Cash Return
3.2%
Cap rate
0.5%
Rent to Value Ratio