85615 Investment Properties for Sale
Browse homes for sale and investment properties in 85615. Refine your search by price, property type, or more.
Best cash flowing properties in 85615

Active
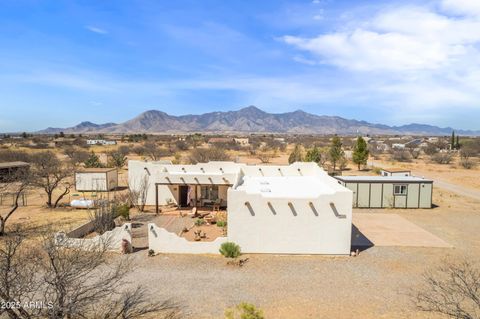
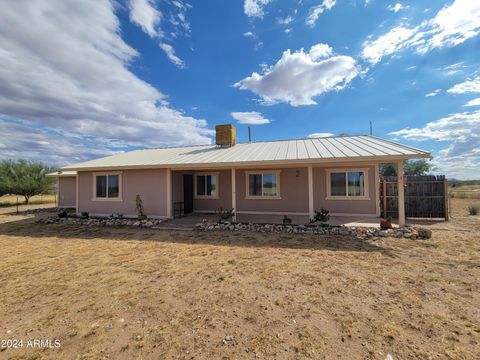
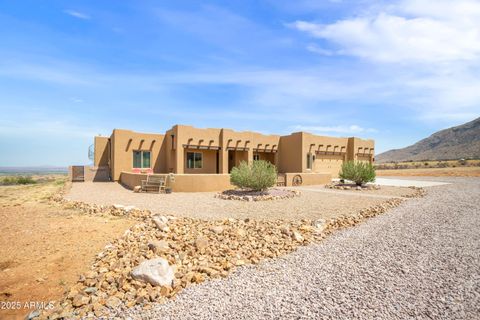
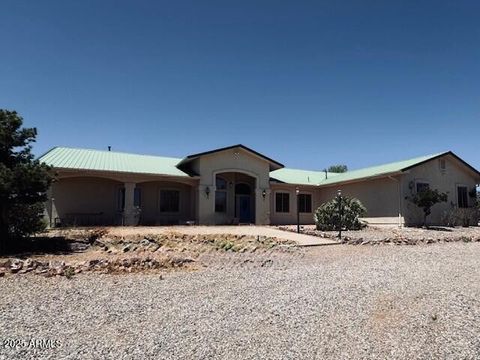
$372,000
3
bds
|
2
ba
|
1,843
sqft
|
built
2002
8484 S Coyote Song Ln, Hereford, AZ 85615
$-442
Cash flow
-6.2%
Cash-on-Cash Return
4.3%
Cap rate
0.6%
Rent to Value Ratio
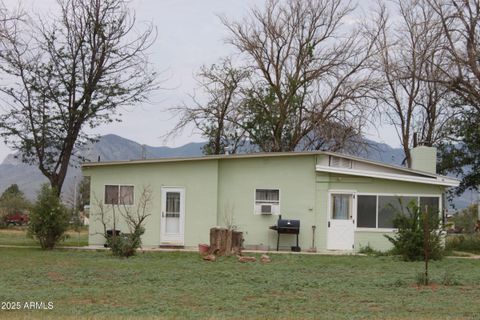
Active
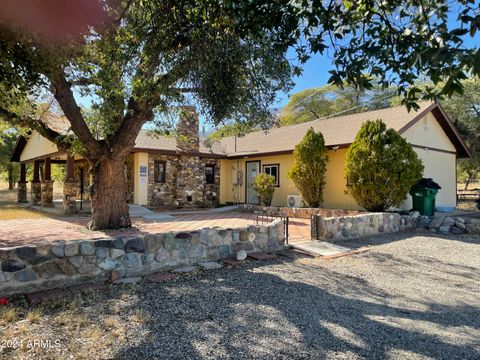
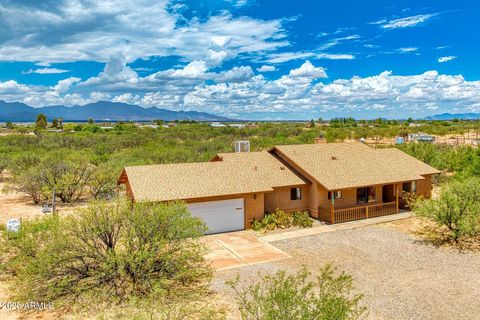
$349,000
3
bds
|
2
ba
|
2,462
sqft
|
built
1951
8360 S Highway 92, Hereford, AZ 85615
$-481
Cash flow
-7.2%
Cash-on-Cash Return
4.0%
Cap rate
0.7%
Rent to Value Ratio
32 out of 43 properties for sale in 85615
Limited Results Shown
Create a free account, or log in to reveal all property listings and enjoy the complete experience.
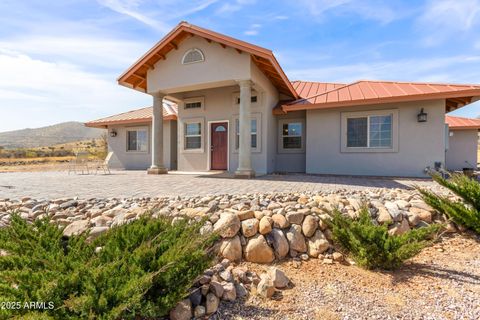
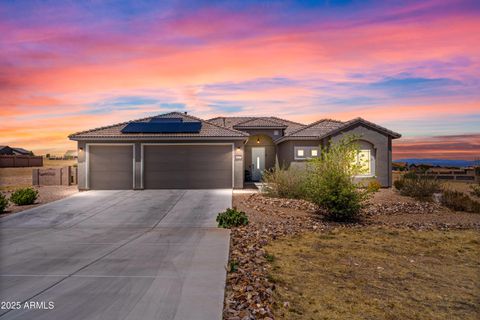
Active
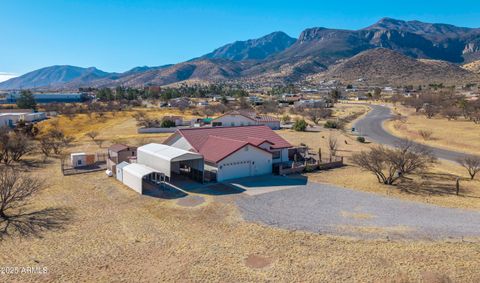
$625,000
4
bds
|
3
ba
|
2,732
sqft
|
built
2006
10379 E Blue Sky Vis, Hereford, AZ 85615
$-1,462
Cash flow
-12.2%
Cash-on-Cash Return
2.9%
Cap rate
0.4%
Rent to Value Ratio
Active
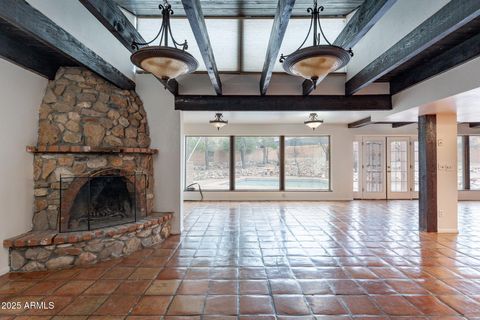
$370,000
4
bds
|
2
ba
|
2,216
sqft
|
built
1972
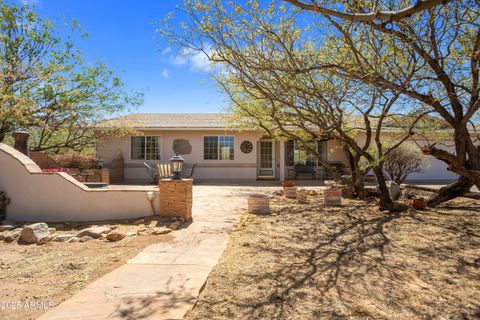
6720 S Calle De La Naranja, Hereford, AZ 85615
$-977
Cash flow
-13.8%
Cash-on-Cash Return
2.5%
Cap rate
0.4%
Rent to Value Ratio

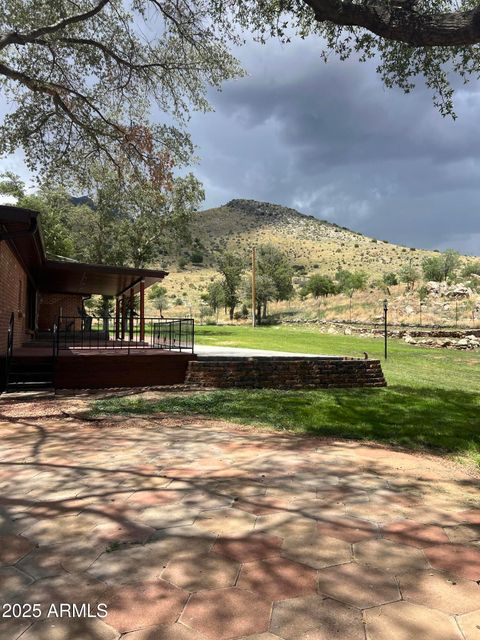
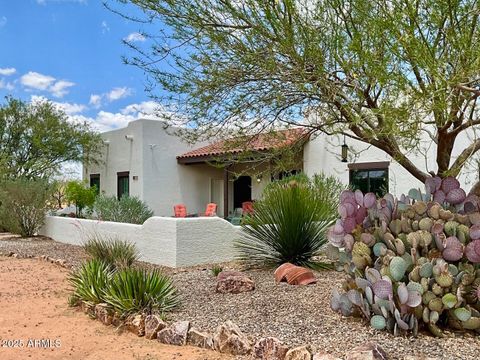
Active
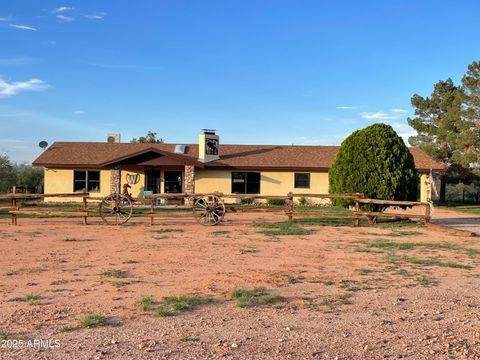
$945,000
3
bds
|
2
ba
|
2,400
sqft
|
built
1934
44 E Ramsey Canyon Rd, Hereford, AZ 85615
$-3,322
Cash flow
-18.3%
Cash-on-Cash Return
1.5%
Cap rate
0.2%
Rent to Value Ratio
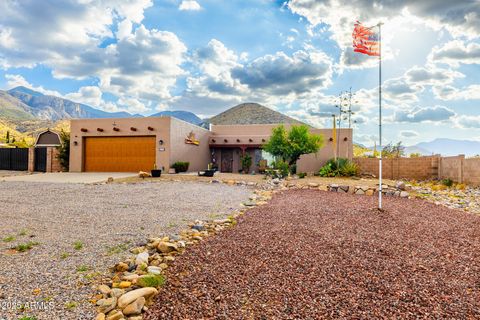
Active
$670,000
3
bds
|
3
ba
|
3,818
sqft
|
built
2007
10159 E Rocking W Ranch Rd, Hereford, AZ 85615
$-2,123
Cash flow
-16.5%
Cash-on-Cash Return
1.9%
Cap rate
0.3%
Rent to Value Ratio
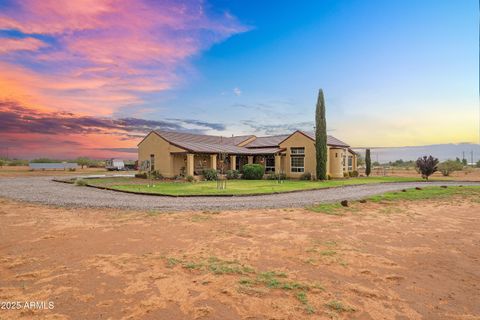
Active
$549,000
3
bds
|
2
ba
|
2,450
sqft
|
built
2002
9206 S Rio Santiago, Hereford, AZ 85615
$-1,250
Cash flow
-11.9%
Cash-on-Cash Return
2.9%
Cap rate
0.4%
Rent to Value Ratio
Active
$529,900
5
bds
|
2
ba
|
2,710
sqft
|
built
2004
5689 S Mir Way, Hereford, AZ 85615
$-1,111
Cash flow
-10.9%
Cash-on-Cash Return
3.2%
Cap rate
0.5%
Rent to Value Ratio
Active
$547,000
4
bds
|
3
ba
|
3,262
sqft
|
built
1981
5374 E Spring Rd, Hereford, AZ 85615
$-722
Cash flow
-6.9%
Cash-on-Cash Return
4.1%
Cap rate
0.6%
Rent to Value Ratio
Active
$549,000
3
bds
|
2
ba
|
1,695
sqft
|
built
1985
6292 S Kino Rd, Hereford, AZ 85615
$-1,139
Cash flow
-10.8%
Cash-on-Cash Return
3.2%
Cap rate
0.4%
Rent to Value Ratio
Active
$304,000
2
bds
|
1
ba
|
1,358
sqft
|
built
1934
10550 E Highway 92, Hereford, AZ 85615
$-536
Cash flow
-9.2%
Cash-on-Cash Return
3.6%
Cap rate
0.5%
Rent to Value Ratio
Active
$662,000
3
bds
|
2
ba
|
2,407
sqft
|
built
2004
5465 E Pioneer Ln, Hereford, AZ 85615
$-1,940
Cash flow
-15.3%
Cash-on-Cash Return
2.2%
Cap rate
0.3%
Rent to Value Ratio
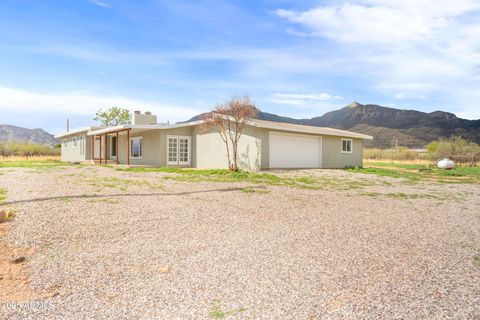
Active
$320,000
4
bds
|
2
ba
|
1,690
sqft
|
built
2004
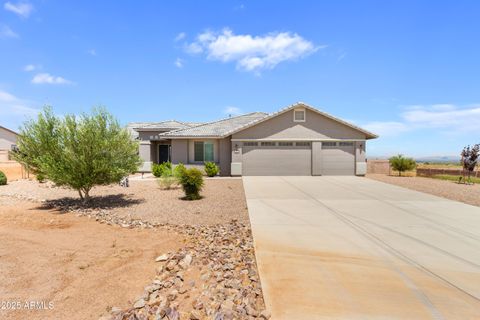
10193 E Windtalker Rd, Hereford, AZ 85615
$-489
Cash flow
-8.0%
Cash-on-Cash Return
3.8%
Cap rate
0.6%
Rent to Value Ratio
Active
$765,900
3
bds
|
2
ba
|
2,806
sqft
|
built
1993
5664 S Equestrian Pl, Hereford, AZ 85615
$-2,533
Cash flow
-17.3%
Cash-on-Cash Return
1.7%
Cap rate
0.3%
Rent to Value Ratio
Active
$359,000
3
bds
|
2
ba
|
1,886
sqft
|
built
1996
8075 E Bloomfield Rd, Hereford, AZ 85615
$-499
Cash flow
-7.3%
Cash-on-Cash Return
4.0%
Cap rate
0.6%
Rent to Value Ratio
Active
$770,000
4
bds
|
3
ba
|
2,989
sqft
|
built
2019
8867 S Welsh Pl, Hereford, AZ 85615
$-2,044
Cash flow
-13.8%
Cash-on-Cash Return
2.5%
Cap rate
0.4%
Rent to Value Ratio
Active
$925,000
5
bds
|
4
ba
|
3,298
sqft
|
built
2007
6754 E Roberto Loop, Hereford, AZ 85615
$-3,015
Cash flow
-17.0%
Cash-on-Cash Return
1.8%
Cap rate
0.3%
Rent to Value Ratio
Active
$2,600,000
3
bds
|
4
ba
|
6,800
sqft
|
built
2008
6270 E Bryerly Dr, Hereford, AZ 85615
$-10,163
Cash flow
-20.4%
Cash-on-Cash Return
1.0%
Cap rate
0.2%
Rent to Value Ratio
Active
$713,000
4
bds
|
2
ba
|
2,846
sqft
|
built
2019
6100 E Darley Dr, Hereford, AZ 85615
$-2,135
Cash flow
-15.6%
Cash-on-Cash Return
2.1%
Cap rate
0.4%
Rent to Value Ratio
Active
$334,900
3
bds
|
2
ba
|
1,566
sqft
|
built
1993
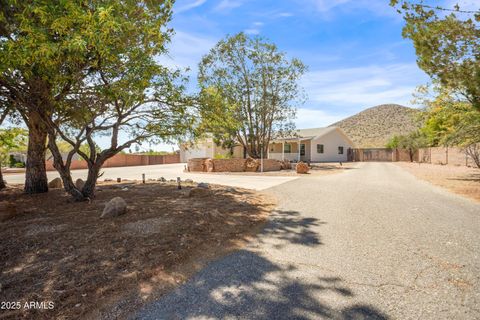
5788 S Ranch Rd, Hereford, AZ 85615
$-501
Cash flow
-7.8%
Cash-on-Cash Return
3.9%
Cap rate
0.5%
Rent to Value Ratio
Active
$590,000
3
bds
|
3
ba
|
3,637
sqft
|
built
1966
9990 E Muffin Ln, Hereford, AZ 85615
$-1,156
Cash flow
-10.2%
Cash-on-Cash Return
3.3%
Cap rate
0.5%
Rent to Value Ratio
Active
$690,000
3
bds
|
2
ba
|
2,176
sqft
|
built
2008
6372 S Sonni An Ln, Hereford, AZ 85615
$-1,782
Cash flow
-13.5%
Cash-on-Cash Return
2.6%
Cap rate
0.4%
Rent to Value Ratio
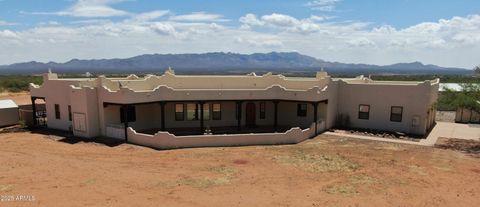
Active
$735,000
5
bds
|
5
ba
|
3,964
sqft
|
built
2004
5766 E Calle Coyote, Hereford, AZ 85615
$-2,329
Cash flow
-16.5%
Cash-on-Cash Return
1.9%
Cap rate
0.3%
Rent to Value Ratio
Active
$450,000
3
bds
|
2
ba
|
1,835
sqft
|
built
2021
6647 E Big Spur Cir, Hereford, AZ 85615
$-969
Cash flow
-11.2%
Cash-on-Cash Return
3.1%
Cap rate
0.5%
Rent to Value Ratio
Active
$498,480
4
bds
|
2
ba
|
2,233
sqft
|
built
2004
7117 S Oleander Ln, Hereford, AZ 85615
$-851
Cash flow
-8.9%
Cash-on-Cash Return
3.6%
Cap rate
0.5%
Rent to Value Ratio
Active
$465,000
4
bds
|
2
ba
|
1,997
sqft
|
built
2005
6248 S De Mello St, Hereford, AZ 85615
$-877
Cash flow
-9.8%
Cash-on-Cash Return
3.4%
Cap rate
0.5%
Rent to Value Ratio
Active
$369,900
3
bds
|
2
ba
|
1,818
sqft
|
built
1998
6760 S Y Lightning Ranch Rd, Hereford, AZ 85615
$-682
Cash flow
-9.6%
Cash-on-Cash Return
3.5%
Cap rate
0.5%
Rent to Value Ratio
Active
$482,500
4
bds
|
2
ba
|
2,086
sqft
|
built
2022
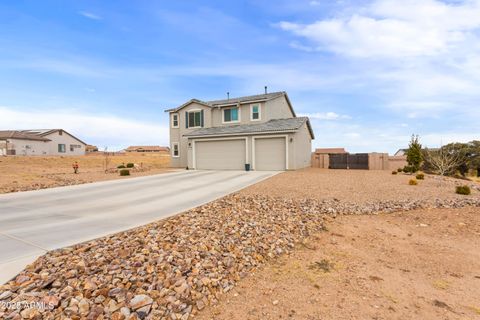
6757 E Vaquero Cir, Hereford, AZ 85615
$-855
Cash flow
-9.2%
Cash-on-Cash Return
3.6%
Cap rate
0.5%
Rent to Value Ratio

Active
$455,000
3
bds
|
2
ba
|
1,834
sqft
|
built
2019
6209 E Saddlehorn Cir, Hereford, AZ 85615
$-829
Cash flow
-9.5%
Cash-on-Cash Return
3.5%
Cap rate
0.5%
Rent to Value Ratio
Active
$575,000
5
bds
|
3
ba
|
3,549
sqft
|
built
2003
3148 E Keeling Rd, Hereford, AZ 85615
$-1,336
Cash flow
-12.1%
Cash-on-Cash Return
2.9%
Cap rate
0.4%
Rent to Value Ratio
Active
$509,000
4
bds
|
3
ba
|
2,317
sqft
|
built
2022
6758 E Big Spur Cir, Hereford, AZ 85615
$-1,137
Cash flow
-11.7%
Cash-on-Cash Return
3.0%
Cap rate
0.5%
Rent to Value Ratio
Active
$469,000
3
bds
|
2
ba
|
2,181
sqft
|
built
2002
5137 E Maranatha Ln, Hereford, AZ 85615
$-936
Cash flow
-10.4%
Cash-on-Cash Return
3.3%
Cap rate
0.5%
Rent to Value Ratio