89002 Investment Properties for Sale
Browse homes for sale and investment properties in 89002. Refine your search by price, property type, or more.
Best cash flowing properties in 89002
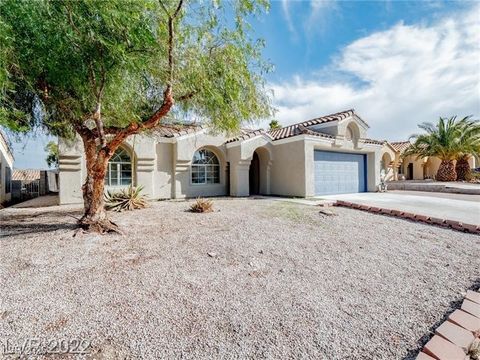
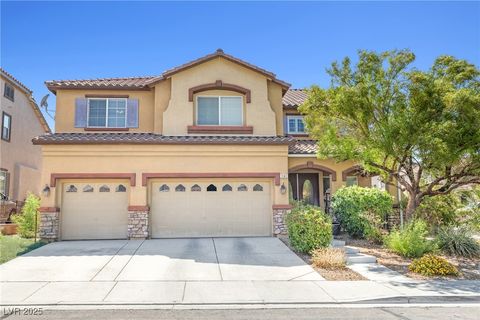
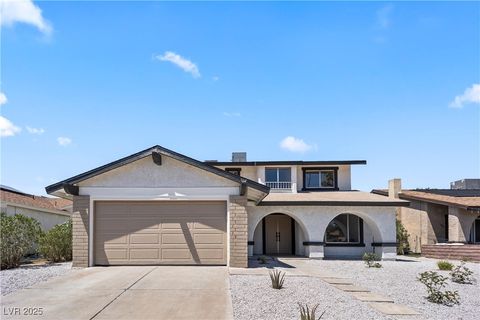
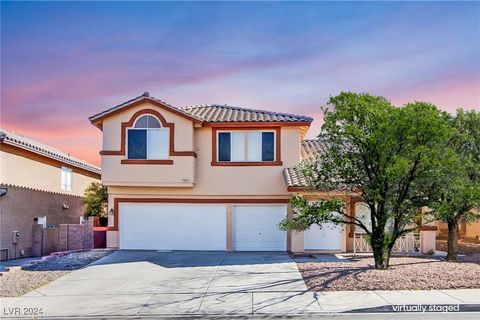
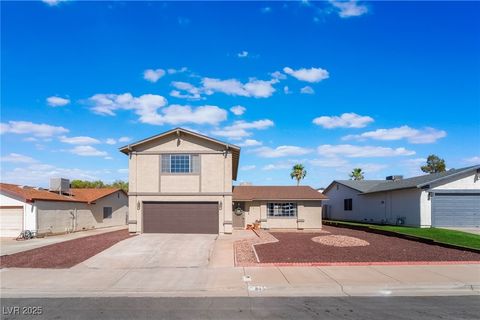
Active
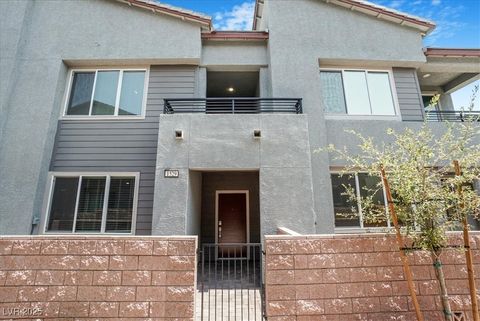
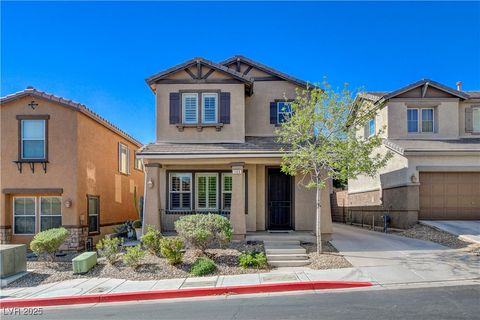
$399,999
3
bds
|
2
ba
|
1,243
sqft
|
built
1990
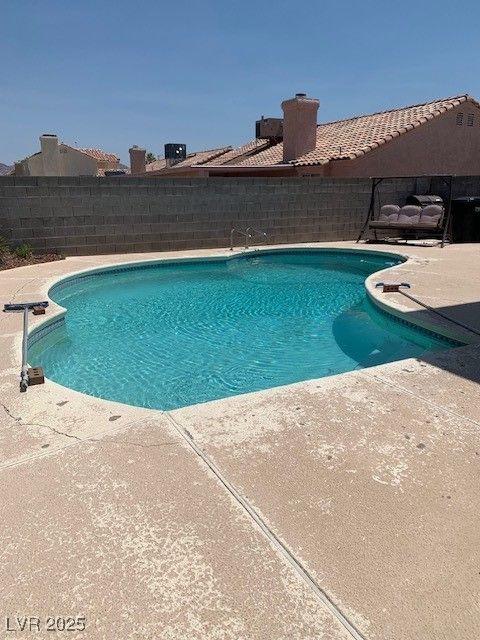
849 Brahma Ln, Henderson, NV 89002
$-425
Cash flow
-5.5%
Cash-on-Cash Return
4.4%
Cap rate
0.6%
Rent to Value Ratio

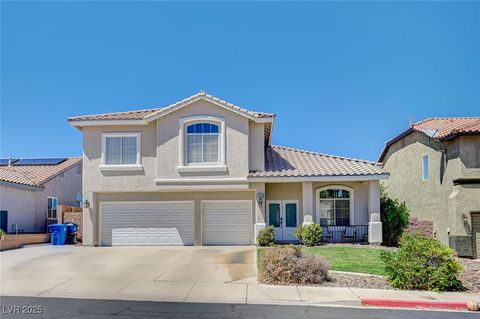
Active
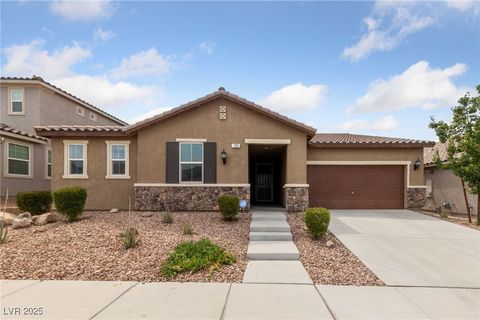
$500,000
4
bds
|
4
ba
|
2,924
sqft
|
built
1996
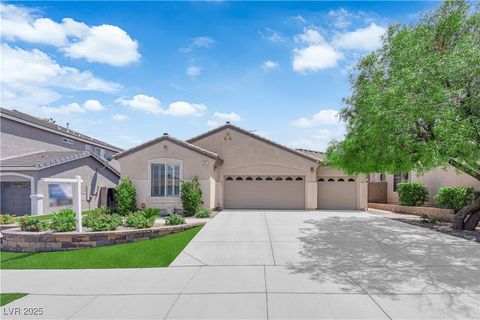
1026 Yellow Marigold Ct, Henderson, NV 89002
$-519
Cash flow
-5.4%
Cash-on-Cash Return
4.4%
Cap rate
0.6%
Rent to Value Ratio
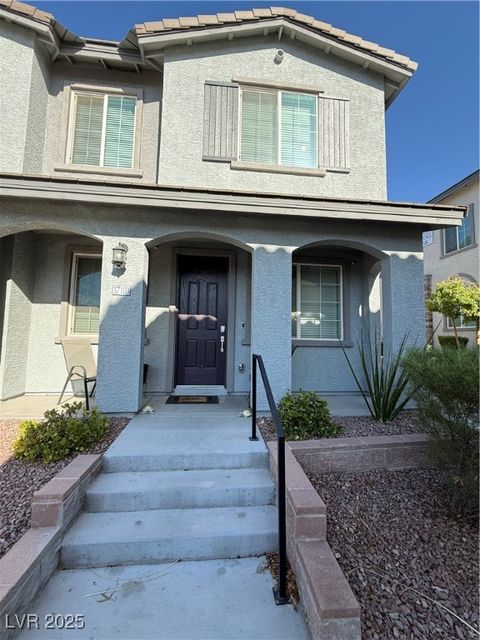
70 out of 74 properties for sale in 89002
Limited Results Shown
Create a free account, or log in to reveal all property listings and enjoy the complete experience.
Active
$345,000
3
bds
|
3
ba
|
1,541
sqft
|
built
2021
965 Nevada State Dr, Henderson, NV 89002
$-860
Cash flow
-13.0%
Cash-on-Cash Return
2.7%
Cap rate
0.5%
Rent to Value Ratio
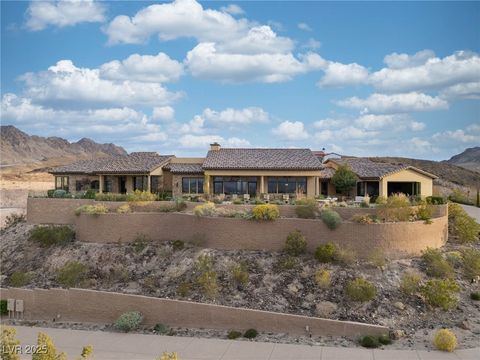
Active
$1,200,000
5
bds
|
4
ba
|
4,685
sqft
|
built
1993
1225 Kover Ct, Henderson, NV 89002
$-3,294
Cash flow
-14.3%
Cash-on-Cash Return
2.4%
Cap rate
0.3%
Rent to Value Ratio

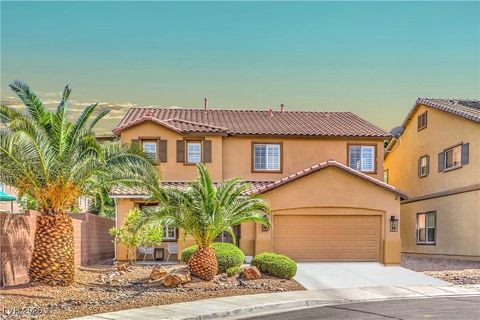
Active
$525,000
4
bds
|
3
ba
|
2,018
sqft
|
built
1994
805 Blue Springs Dr, Henderson, NV 89002
$-1,115
Cash flow
-11.1%
Cash-on-Cash Return
3.1%
Cap rate
0.4%
Rent to Value Ratio
Active
$1,100,000
5
bds
|
5
ba
|
5,498
sqft
|
built
1981
912 Santa Ynez Ave, Henderson, NV 89002
$-2,248
Cash flow
-10.7%
Cash-on-Cash Return
3.2%
Cap rate
0.5%
Rent to Value Ratio
Active
$724,999
5
bds
|
4
ba
|
3,747
sqft
|
built
2006
1141 Brent Park Ct, Henderson, NV 89002
$-1,644
Cash flow
-11.8%
Cash-on-Cash Return
3.0%
Cap rate
0.4%
Rent to Value Ratio
Active
$354,000
3
bds
|
3
ba
|
1,423
sqft
|
built
2004
1554 Ward Frontier Ln, Henderson, NV 89002
$-675
Cash flow
-9.9%
Cash-on-Cash Return
3.4%
Cap rate
0.5%
Rent to Value Ratio
Active
$555,000
4
bds
|
3
ba
|
2,605
sqft
|
built
2003
774 Wigan Pier Dr, Henderson, NV 89002
$-1,264
Cash flow
-11.9%
Cash-on-Cash Return
2.9%
Cap rate
0.5%
Rent to Value Ratio
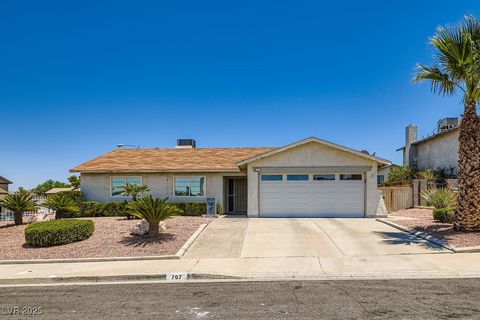
Active
$489,000
3
bds
|
2
ba
|
1,807
sqft
|
built
1981
707 Sugarcane Ct, Henderson, NV 89002
$-1,030
Cash flow
-11.0%
Cash-on-Cash Return
3.2%
Cap rate
0.4%
Rent to Value Ratio
Active
$420,000
3
bds
|
3
ba
|
1,784
sqft
|
built
2024
1529 Eva Crossing Pl, Henderson, NV 89002
$-1,317
Cash flow
-16.4%
Cash-on-Cash Return
1.9%
Cap rate
0.4%
Rent to Value Ratio
Active
$404,900
3
bds
|
2
ba
|
1,292
sqft
|
built
1991
812 Bitterroot St, Henderson, NV 89002
$-718
Cash flow
-9.3%
Cash-on-Cash Return
3.6%
Cap rate
0.5%
Rent to Value Ratio
Active
$498,000
4
bds
|
3
ba
|
2,044
sqft
|
built
2005
1011 Pecos River Ave, Henderson, NV 89002
$-764
Cash flow
-8.0%
Cash-on-Cash Return
3.8%
Cap rate
0.5%
Rent to Value Ratio
Active
$845,000
5
bds
|
4
ba
|
3,761
sqft
|
built
2006
29 Blue Valley Dr, Henderson, NV 89002
$-1,949
Cash flow
-12.0%
Cash-on-Cash Return
2.9%
Cap rate
0.4%
Rent to Value Ratio

Active
$545,000
3
bds
|
2
ba
|
1,863
sqft
|
built
1994
114 Tamarack Dr, Henderson, NV 89002
$-1,059
Cash flow
-10.1%
Cash-on-Cash Return
3.3%
Cap rate
0.5%
Rent to Value Ratio
Active
$429,000
3
bds
|
3
ba
|
2,052
sqft
|
built
2005
165 Calm Morning Ave, Henderson, NV 89002
$-713
Cash flow
-8.7%
Cash-on-Cash Return
3.7%
Cap rate
0.5%
Rent to Value Ratio
Active
$1,190,900
4
bds
|
3
ba
|
3,613
sqft
|
built
1997
1590 Mustang Dr, Henderson, NV 89002
$-4,369
Cash flow
-19.1%
Cash-on-Cash Return
1.3%
Cap rate
0.2%
Rent to Value Ratio
Active
$4,365,000
5
bds
|
8
ba
|
8,115
sqft
|
built
2000
640 Quail Covey Rd, Henderson, NV 89002
$-18,988
Cash flow
-22.7%
Cash-on-Cash Return
0.5%
Cap rate
0.1%
Rent to Value Ratio
Active
$534,900
3
bds
|
2
ba
|
2,466
sqft
|
built
2017
705 Coastal Lagoon St, Henderson, NV 89002
$-1,323
Cash flow
-12.9%
Cash-on-Cash Return
2.7%
Cap rate
0.4%
Rent to Value Ratio
Active
$552,000
4
bds
|
3
ba
|
2,194
sqft
|
built
1979
307 Balsa St, Henderson, NV 89002
$-1,048
Cash flow
-9.9%
Cash-on-Cash Return
3.4%
Cap rate
0.5%
Rent to Value Ratio
Active
$400,000
4
bds
|
2
ba
|
1,554
sqft
|
built
1981
791 Fountain Hills Ave, Henderson, NV 89002
$-622
Cash flow
-8.1%
Cash-on-Cash Return
3.8%
Cap rate
0.5%
Rent to Value Ratio
Active
$525,000
4
bds
|
3
ba
|
2,191
sqft
|
built
2023
617 Sylvan St, Henderson, NV 89002
$-1,193
Cash flow
-11.9%
Cash-on-Cash Return
3.0%
Cap rate
0.5%
Rent to Value Ratio
Active
$699,900
6
bds
|
3
ba
|
2,605
sqft
|
built
2001
780 Vortex Ave, Henderson, NV 89002
$-1,890
Cash flow
-14.1%
Cash-on-Cash Return
2.4%
Cap rate
0.4%
Rent to Value Ratio

Active
$411,400
3
bds
|
3
ba
|
1,798
sqft
|
built
2023
1501 Eliana Crossing Pl, Henderson, NV 89002
$-1,003
Cash flow
-12.7%
Cash-on-Cash Return
2.8%
Cap rate
0.5%
Rent to Value Ratio
Active
$470,000
4
bds
|
3
ba
|
1,962
sqft
|
built
1992
923 Saddle Horn Dr, Henderson, NV 89002
$-722
Cash flow
-8.0%
Cash-on-Cash Return
3.8%
Cap rate
0.5%
Rent to Value Ratio

Active
$525,000
4
bds
|
3
ba
|
2,943
sqft
|
built
2018
2357 Mundare Dr, Henderson, NV 89002
$-1,027
Cash flow
-10.2%
Cash-on-Cash Return
3.3%
Cap rate
0.5%
Rent to Value Ratio
Active
$545,000
4
bds
|
2
ba
|
1,884
sqft
|
built
2005
971 Mill Run Creek Ave, Henderson, NV 89002
$-1,206
Cash flow
-11.5%
Cash-on-Cash Return
3.0%
Cap rate
0.4%
Rent to Value Ratio

Active
$575,000
4
bds
|
2
ba
|
2,426
sqft
|
built
2005
981 Buffalo River Ave, Henderson, NV 89002
$-1,250
Cash flow
-11.3%
Cash-on-Cash Return
3.1%
Cap rate
0.4%
Rent to Value Ratio
Active
$4,999,999
4
bds
|
7
ba
|
6,890
sqft
|
built
2019
1123 Christian Rd, Henderson, NV 89002
$-22,161
Cash flow
-23.1%
Cash-on-Cash Return
0.4%
Cap rate
0.1%
Rent to Value Ratio
Active
$525,000
4
bds
|
3
ba
|
2,805
sqft
|
built
2005
75 Archer Glen Ave, Henderson, NV 89002
$-806
Cash flow
-8.0%
Cash-on-Cash Return
3.8%
Cap rate
0.5%
Rent to Value Ratio
Active
$519,999
3
bds
|
3
ba
|
2,463
sqft
|
built
1996
1028 Twin Berry Ct, Henderson, NV 89002
$-1,120
Cash flow
-11.2%
Cash-on-Cash Return
3.1%
Cap rate
0.4%
Rent to Value Ratio
Active
$500,000
4
bds
|
3
ba
|
1,995
sqft
|
built
1995
2019 Fallsburg Way, Henderson, NV 89002
$-809
Cash flow
-8.4%
Cash-on-Cash Return
3.7%
Cap rate
0.5%
Rent to Value Ratio
Active
$575,000
4
bds
|
2
ba
|
2,119
sqft
|
built
2005
87 Rattlesnake Grass Ct, Henderson, NV 89002
$-1,292
Cash flow
-11.7%
Cash-on-Cash Return
3.0%
Cap rate
0.4%
Rent to Value Ratio
Active
$635,000
5
bds
|
3
ba
|
2,346
sqft
|
built
2003
1629 Lone Palm Ct, Henderson, NV 89002
$-1,550
Cash flow
-12.7%
Cash-on-Cash Return
2.7%
Cap rate
0.4%
Rent to Value Ratio
Active
$469,000
4
bds
|
3
ba
|
1,855
sqft
|
built
1988
845 Mainsail Ct, Henderson, NV 89002
$-719
Cash flow
-8.0%
Cash-on-Cash Return
3.8%
Cap rate
0.5%
Rent to Value Ratio
Active
$599,999
5
bds
|
3
ba
|
2,758
sqft
|
built
1998
1006 Kings View Ct, Henderson, NV 89002
$-1,259
Cash flow
-10.9%
Cash-on-Cash Return
3.2%
Cap rate
0.4%
Rent to Value Ratio
Active
$599,900
4
bds
|
3
ba
|
2,445
sqft
|
built
1995
810 Singing Drum Dr, Henderson, NV 89002
$-1,100
Cash flow
-9.6%
Cash-on-Cash Return
3.5%
Cap rate
0.5%
Rent to Value Ratio

Active
$600,000
4
bds
|
3
ba
|
2,320
sqft
|
built
1996
1325 Baychester Dr, Henderson, NV 89002
$-1,093
Cash flow
-9.5%
Cash-on-Cash Return
3.5%
Cap rate
0.5%
Rent to Value Ratio
Active
$355,000
3
bds
|
3
ba
|
1,624
sqft
|
built
2006
1155 Heavenly Harvest Pl, Henderson, NV 89002
$-764
Cash flow
-11.2%
Cash-on-Cash Return
3.1%
Cap rate
0.5%
Rent to Value Ratio
Active
$335,000
3
bds
|
3
ba
|
1,542
sqft
|
built
2021
965 Nevada State Dr, Henderson, NV 89002
$-802
Cash flow
-12.5%
Cash-on-Cash Return
2.8%
Cap rate
0.5%
Rent to Value Ratio