89002 Investment Properties for Sale
Browse homes for sale and investment properties in 89002. Refine your search by price, property type, or more.
Best cash flowing properties in 89002

Active
$500,000
4
bds
|
4
ba
|
2,924
sqft
|
built
1996
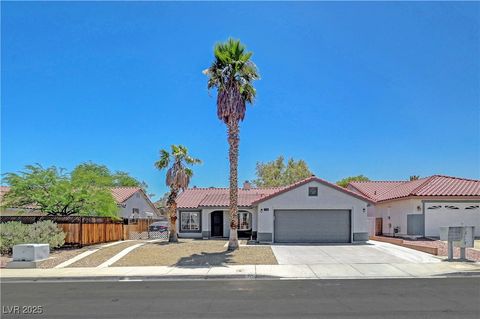
1026 Yellow Marigold Ct, Henderson, NV 89002
$-519
Cash flow
-5.4%
Cash-on-Cash Return
4.4%
Cap rate
0.6%
Rent to Value Ratio

Active
$399,000
3
bds
|
2
ba
|
1,416
sqft
|
built
1983
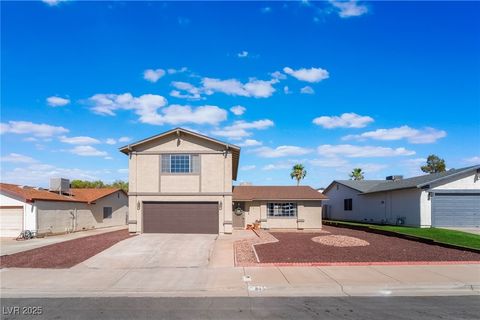
736 Scottsdale St, Henderson, NV 89002
$-610
Cash flow
-8.0%
Cash-on-Cash Return
3.8%
Cap rate
0.5%
Rent to Value Ratio
70 out of 74 properties for sale in 89002
Limited Results Shown
Create a free account, or log in to reveal all property listings and enjoy the complete experience.

Active
$395,000
3
bds
|
2
ba
|
1,280
sqft
|
built
1990
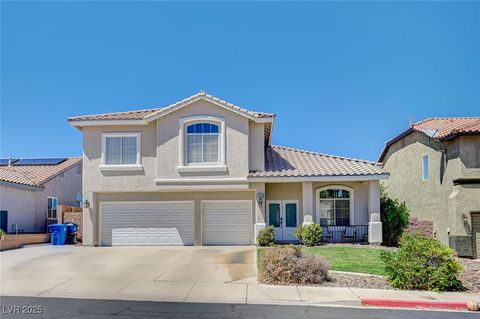
322 Wintercress Dr, Henderson, NV 89002
$-663
Cash flow
-8.8%
Cash-on-Cash Return
3.7%
Cap rate
0.5%
Rent to Value Ratio

Active
$420,000
3
bds
|
3
ba
|
1,483
sqft
|
built
2006
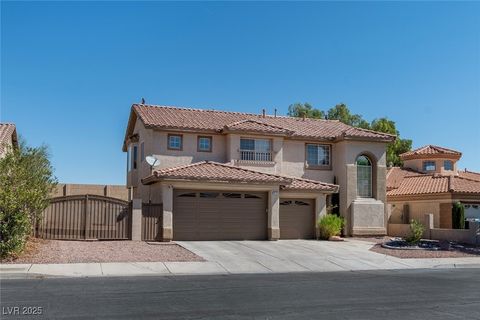
688 Monument Point St, Henderson, NV 89002
$-867
Cash flow
-10.8%
Cash-on-Cash Return
3.2%
Cap rate
0.5%
Rent to Value Ratio

Active
$385,000
3
bds
|
2
ba
|
1,439
sqft
|
built
1971
408 Scenic Dr, Henderson, NV 89002
$-656
Cash flow
-8.9%
Cash-on-Cash Return
3.6%
Cap rate
0.5%
Rent to Value Ratio

Active
$409,950
3
bds
|
3
ba
|
1,577
sqft
|
built
2006
151 Afternoon Rain Ave, Henderson, NV 89002
$-822
Cash flow
-10.5%
Cash-on-Cash Return
3.3%
Cap rate
0.5%
Rent to Value Ratio
Active
$415,000
3
bds
|
2
ba
|
1,340
sqft
|
built
1996
715 Heritage Point Dr, Henderson, NV 89002
$-730
Cash flow
-9.2%
Cash-on-Cash Return
3.6%
Cap rate
0.5%
Rent to Value Ratio

Active
$430,000
3
bds
|
2
ba
|
2,052
sqft
|
built
2005
680 Moonlight Stroll St, Henderson, NV 89002
$-933
Cash flow
-11.3%
Cash-on-Cash Return
3.1%
Cap rate
0.5%
Rent to Value Ratio

Active
$359,987
3
bds
|
3
ba
|
1,337
sqft
|
built
2004
1088 Paradise Coach Dr, Henderson, NV 89002
$-744
Cash flow
-10.8%
Cash-on-Cash Return
3.2%
Cap rate
0.5%
Rent to Value Ratio

Active
$349,995
3
bds
|
3
ba
|
1,577
sqft
|
built
2006
1092 Tuscan Sky Ln, Henderson, NV 89002
$-671
Cash flow
-10.0%
Cash-on-Cash Return
3.4%
Cap rate
0.6%
Rent to Value Ratio

Active
$388,100
2
bds
|
3
ba
|
1,657
sqft
|
built
2023
1503 Eliana Crossing Pl, Henderson, NV 89002
$-1,031
Cash flow
-13.9%
Cash-on-Cash Return
2.5%
Cap rate
0.5%
Rent to Value Ratio

Active
$350,000
2
bds
|
3
ba
|
1,296
sqft
|
built
2005
1091 Paradise Resort Dr, Henderson, NV 89002
$-721
Cash flow
-10.7%
Cash-on-Cash Return
3.2%
Cap rate
0.5%
Rent to Value Ratio

Active
$430,000
3
bds
|
3
ba
|
1,857
sqft
|
built
2023
1505 Eliana Crossing Pl, Henderson, NV 89002
$-1,090
Cash flow
-13.2%
Cash-on-Cash Return
2.6%
Cap rate
0.5%
Rent to Value Ratio

Active
$515,000
4
bds
|
2
ba
|
2,276
sqft
|
built
2007
121 Staplehurst Ave, Henderson, NV 89002
$-928
Cash flow
-9.4%
Cash-on-Cash Return
3.5%
Cap rate
0.5%
Rent to Value Ratio

Active
$350,000
2
bds
|
3
ba
|
1,433
sqft
|
built
2007
1106 Luna Eclipse Ln, Henderson, NV 89002
$-734
Cash flow
-10.9%
Cash-on-Cash Return
3.2%
Cap rate
0.5%
Rent to Value Ratio

Active
$585,000
3
bds
|
3
ba
|
2,381
sqft
|
built
1995
904 Swift Bear St, Henderson, NV 89002
$-1,244
Cash flow
-11.1%
Cash-on-Cash Return
3.1%
Cap rate
0.4%
Rent to Value Ratio

Active
$575,000
4
bds
|
2
ba
|
2,426
sqft
|
built
2008
967 Mill Run Creek Ave, Henderson, NV 89002
$-1,219
Cash flow
-11.1%
Cash-on-Cash Return
3.1%
Cap rate
0.5%
Rent to Value Ratio

Active
$340,000
3
bds
|
4
ba
|
1,288
sqft
|
built
2005
1076 Country Coach Dr, Henderson, NV 89002
$-647
Cash flow
-9.9%
Cash-on-Cash Return
3.4%
Cap rate
0.5%
Rent to Value Ratio
Active
$469,000
4
bds
|
3
ba
|
1,855
sqft
|
built
1988
845 Mainsail Ct, Henderson, NV 89002
$-719
Cash flow
-8.0%
Cash-on-Cash Return
3.8%
Cap rate
0.5%
Rent to Value Ratio
Active
$599,999
5
bds
|
3
ba
|
2,758
sqft
|
built
1998
1006 Kings View Ct, Henderson, NV 89002
$-1,259
Cash flow
-10.9%
Cash-on-Cash Return
3.2%
Cap rate
0.4%
Rent to Value Ratio
Active
$599,900
4
bds
|
3
ba
|
2,445
sqft
|
built
1995
810 Singing Drum Dr, Henderson, NV 89002
$-1,100
Cash flow
-9.6%
Cash-on-Cash Return
3.5%
Cap rate
0.5%
Rent to Value Ratio

Active
$600,000
4
bds
|
3
ba
|
2,320
sqft
|
built
1996
1325 Baychester Dr, Henderson, NV 89002
$-1,093
Cash flow
-9.5%
Cash-on-Cash Return
3.5%
Cap rate
0.5%
Rent to Value Ratio
Active
$355,000
3
bds
|
3
ba
|
1,624
sqft
|
built
2006
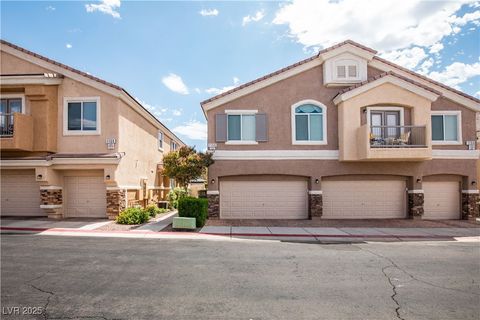
1155 Heavenly Harvest Pl, Henderson, NV 89002
$-764
Cash flow
-11.2%
Cash-on-Cash Return
3.1%
Cap rate
0.5%
Rent to Value Ratio
Active
$335,000
3
bds
|
3
ba
|
1,542
sqft
|
built
2021
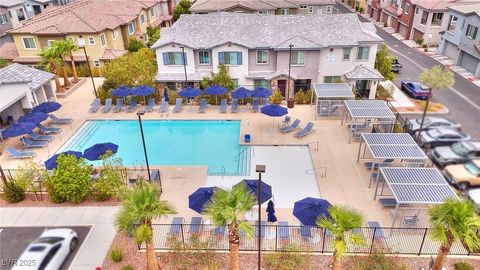
965 Nevada State Dr, Henderson, NV 89002
$-802
Cash flow
-12.5%
Cash-on-Cash Return
2.8%
Cap rate
0.5%
Rent to Value Ratio

Active
$699,900
3
bds
|
3
ba
|
2,076
sqft
|
built
1992
1581 Latigo Dr, Henderson, NV 89002
$-2,007
Cash flow
-15.0%
Cash-on-Cash Return
2.2%
Cap rate
0.3%
Rent to Value Ratio

Active
$579,000
4
bds
|
3
ba
|
2,550
sqft
|
built
2003
1598 Cowboy Chaps Pl, Henderson, NV 89002
$-1,272
Cash flow
-11.5%
Cash-on-Cash Return
3.0%
Cap rate
0.4%
Rent to Value Ratio

Active
$337,000
3
bds
|
3
ba
|
1,412
sqft
|
built
2005
1069 Thrill Ct, Henderson, NV 89002
$-653
Cash flow
-10.1%
Cash-on-Cash Return
3.4%
Cap rate
0.5%
Rent to Value Ratio
Active
$529,900
3
bds
|
2
ba
|
1,544
sqft
|
built
2001
43 Pangloss St, Henderson, NV 89002
$-1,523
Cash flow
-15.0%
Cash-on-Cash Return
2.2%
Cap rate
0.3%
Rent to Value Ratio
Active
$365,000
3
bds
|
3
ba
|
1,541
sqft
|
built
2023
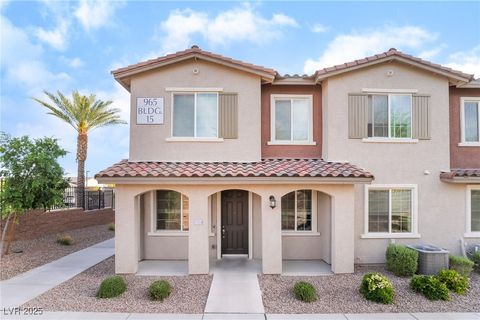
965 Nevada State Dr, Henderson, NV 89002
$-924
Cash flow
-13.2%
Cash-on-Cash Return
2.6%
Cap rate
0.5%
Rent to Value Ratio

Active
$444,000
3
bds
|
2
ba
|
1,796
sqft
|
built
1980
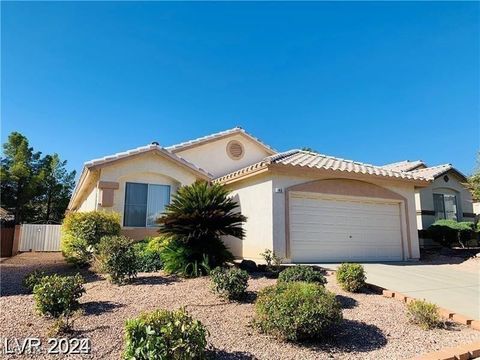
1960 Arabian Ct, Henderson, NV 89002
$-701
Cash flow
-8.2%
Cash-on-Cash Return
3.8%
Cap rate
0.5%
Rent to Value Ratio