89012 Investment Properties for Sale
Browse homes for sale and investment properties in 89012. Refine your search by price, property type, or more.
Best cash flowing properties in 89012
Active
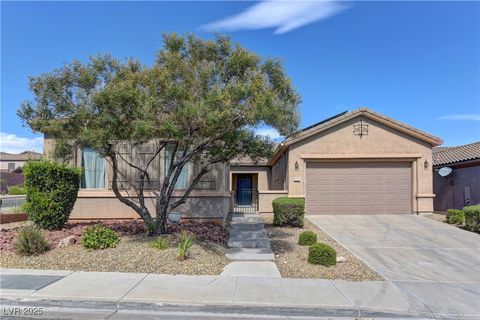
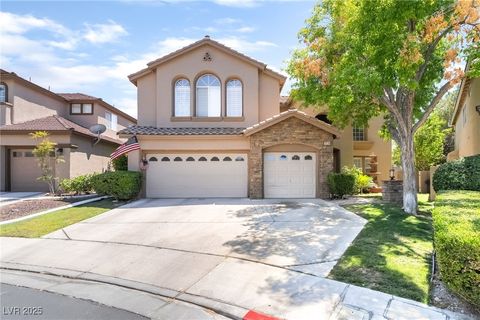
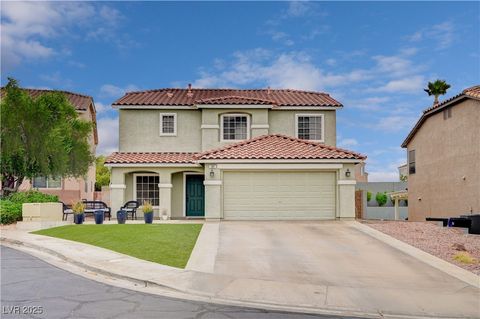
$1,000,000
3
bds
|
5
ba
|
2,768
sqft
|
built
2014
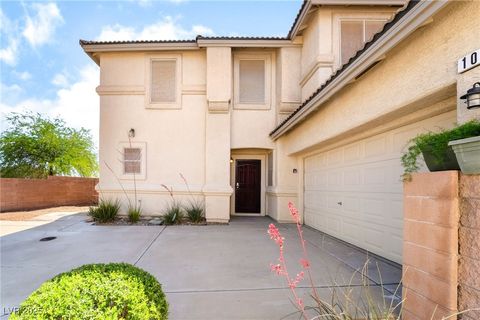
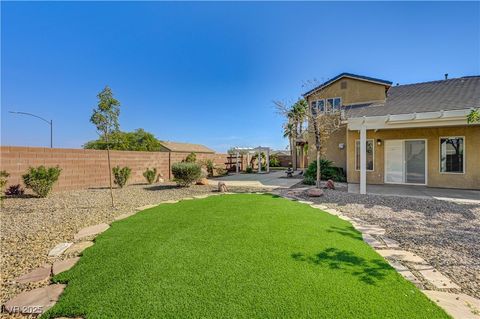
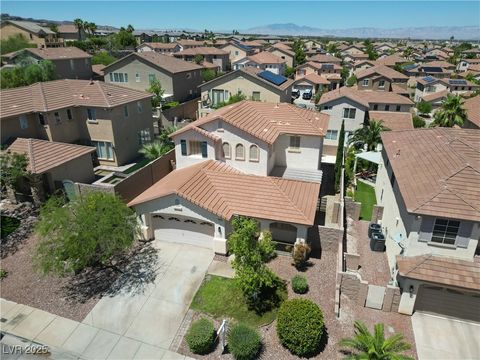
221 Errogie St, Henderson, NV 89012
$-634
Cash flow
-3.3%
Cash-on-Cash Return
4.9%
Cap rate
0.7%
Rent to Value Ratio
Active
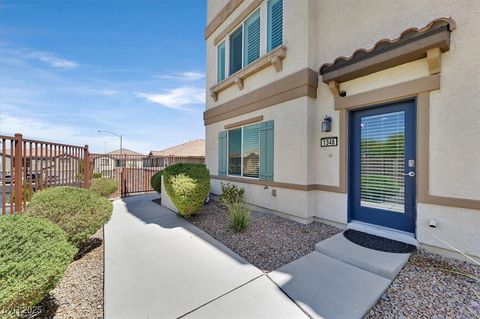
$305,000
1
bds
|
1
ba
|
824
sqft
|
built
1997
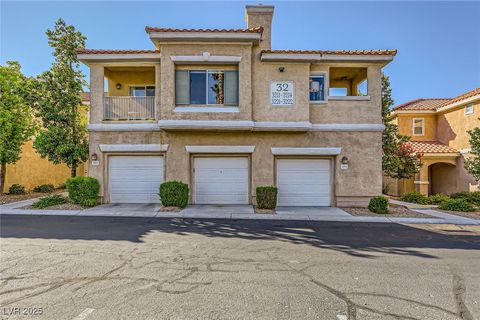
251 S Green Valley Pkwy, Henderson, NV 89012
$-656
Cash flow
-11.2%
Cash-on-Cash Return
3.1%
Cap rate
0.6%
Rent to Value Ratio
82 out of 98 properties for sale in 89012
Limited Results Shown
Create a free account, or log in to reveal all property listings and enjoy the complete experience.
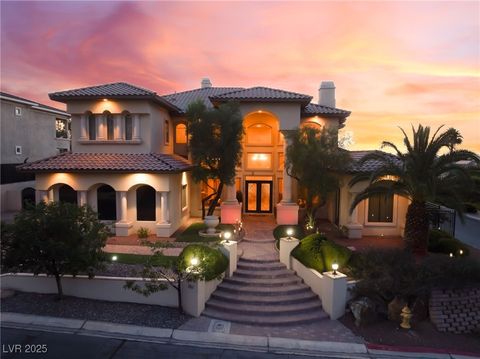
Active
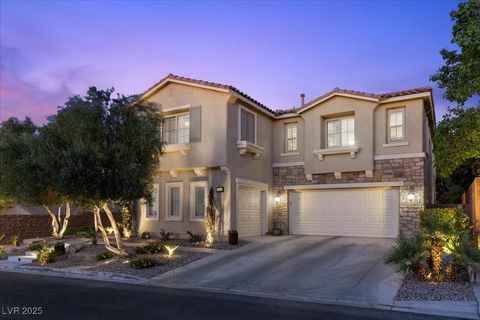
$1,695,500
4
bds
|
6
ba
|
5,357
sqft
|
built
2007
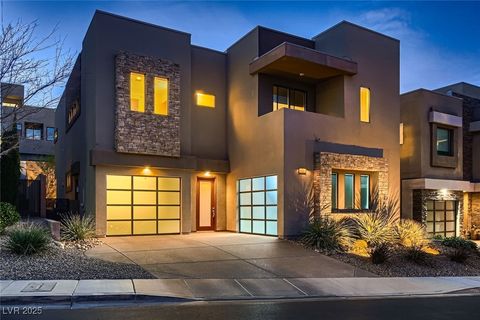
1169 Calle De Luz, Henderson, NV 89012
$-1,781
Cash flow
-5.5%
Cash-on-Cash Return
4.4%
Cap rate
0.6%
Rent to Value Ratio
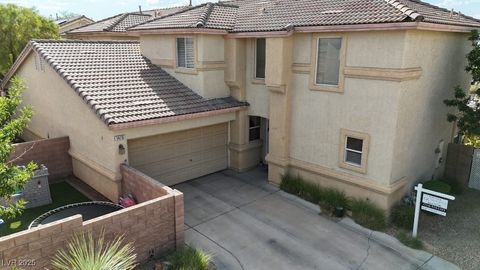
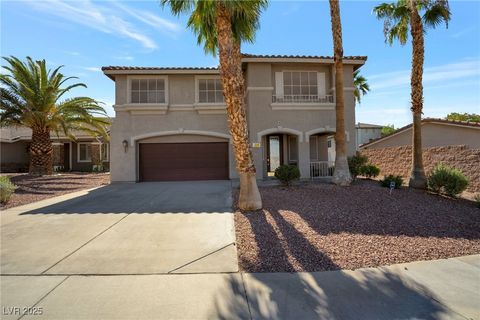
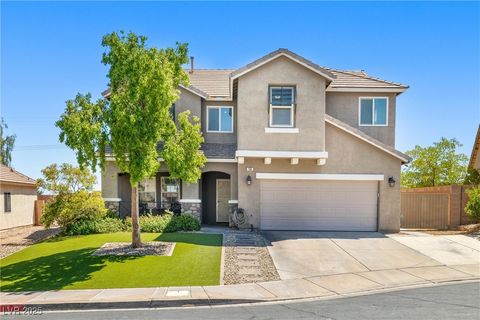
Active
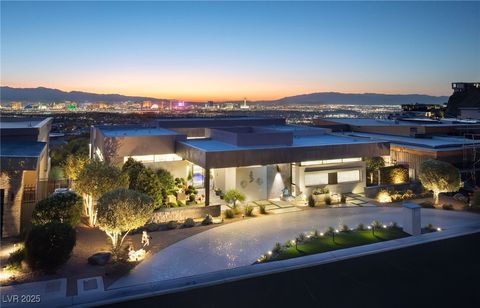
$979,000
5
bds
|
4
ba
|
3,381
sqft
|
built
2022
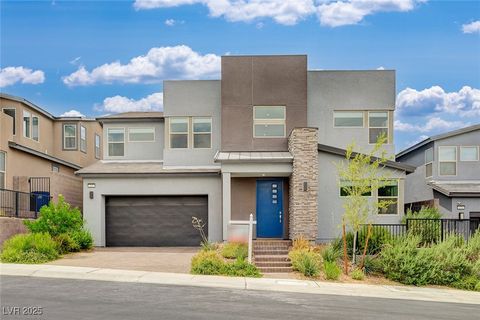
225 Abbey Hill St, Henderson, NV 89012
$-2,683
Cash flow
-14.3%
Cash-on-Cash Return
2.4%
Cap rate
0.4%
Rent to Value Ratio
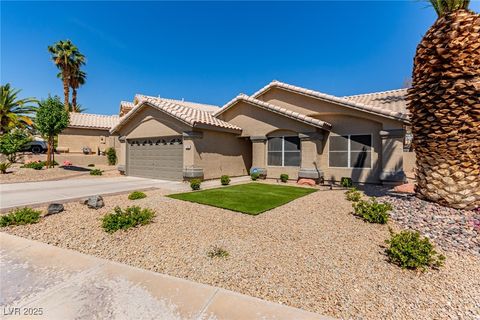
Active
$599,000
3
bds
|
3
ba
|
2,361
sqft
|
built
2006
225 Palmetto Pointe Dr, Henderson, NV 89012
$-1,211
Cash flow
-10.5%
Cash-on-Cash Return
3.3%
Cap rate
0.5%
Rent to Value Ratio
Active
$402,000
3
bds
|
3
ba
|
1,621
sqft
|
built
2000
1476 Evening Song Ave, Henderson, NV 89012
$-777
Cash flow
-10.1%
Cash-on-Cash Return
3.4%
Cap rate
0.5%
Rent to Value Ratio
Active
$7,950,000
4
bds
|
6
ba
|
6,917
sqft
|
built
2017
1491 Reims Dr, Henderson, NV 89012
$-32,724
Cash flow
-21.5%
Cash-on-Cash Return
0.7%
Cap rate
0.1%
Rent to Value Ratio
Active
$3,400,000
5
bds
|
7
ba
|
10,824
sqft
|
built
2009
1800 Melfi Ct, Henderson, NV 89012
$-15,590
Cash flow
-23.9%
Cash-on-Cash Return
0.2%
Cap rate
0.1%
Rent to Value Ratio
Active
$410,000
4
bds
|
3
ba
|
1,621
sqft
|
built
2000
100 Samantha Rose St, Henderson, NV 89012
$-869
Cash flow
-11.1%
Cash-on-Cash Return
3.1%
Cap rate
0.5%
Rent to Value Ratio
Active
$665,000
4
bds
|
3
ba
|
2,661
sqft
|
built
2006
1740 Flores Ln, Henderson, NV 89012
$-1,390
Cash flow
-10.9%
Cash-on-Cash Return
3.2%
Cap rate
0.5%
Rent to Value Ratio
Active
$588,888
4
bds
|
3
ba
|
2,405
sqft
|
built
2004
177 Rocky Star St, Henderson, NV 89012
$-1,506
Cash flow
-13.3%
Cash-on-Cash Return
2.6%
Cap rate
0.4%
Rent to Value Ratio
Active
$2,190,000
4
bds
|
4
ba
|
3,547
sqft
|
built
2019
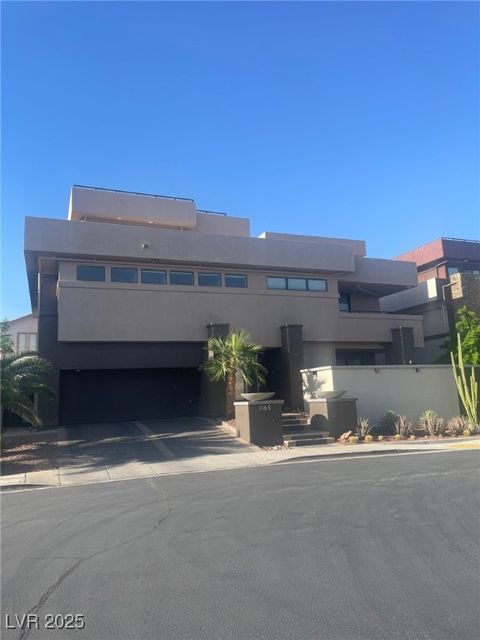
1181 Calle De Luz, Henderson, NV 89012
$-8,291
Cash flow
-19.8%
Cash-on-Cash Return
1.1%
Cap rate
0.2%
Rent to Value Ratio
Active
$4,950,000
6
bds
|
8
ba
|
8,844
sqft
|
built
2006
584 Saint Croix St, Henderson, NV 89012
$-18,220
Cash flow
-19.2%
Cash-on-Cash Return
1.3%
Cap rate
0.2%
Rent to Value Ratio
Active
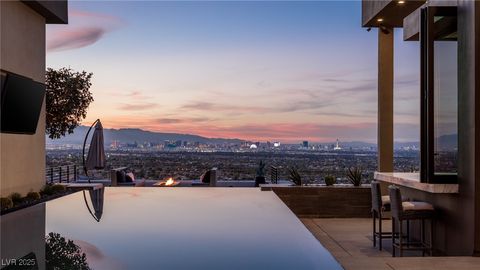
$9,995,000
5
bds
|
7
ba
|
8,288
sqft
|
built
2021
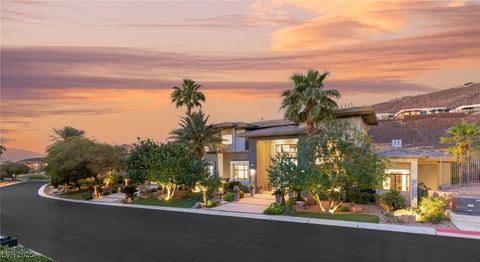
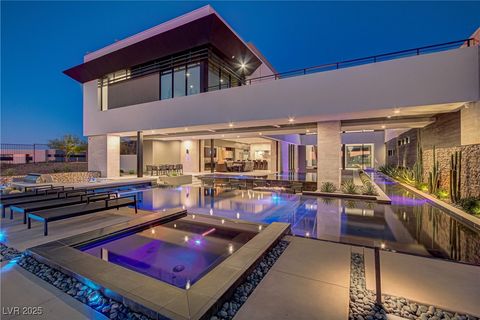
665 Overlook Rim Dr, Henderson, NV 89012
$-46,413
Cash flow
-24.2%
Cash-on-Cash Return
0.1%
Cap rate
0.1%
Rent to Value Ratio
Active
$1,075,000
4
bds
|
4
ba
|
4,049
sqft
|
built
2003
373 Via Sonador, Henderson, NV 89012
$-1,639
Cash flow
-8.0%
Cash-on-Cash Return
3.8%
Cap rate
0.5%
Rent to Value Ratio
Active
$3,200,000
5
bds
|
6
ba
|
6,649
sqft
|
built
2007
1800 Amarone Way, Henderson, NV 89012
$-8,351
Cash flow
-13.6%
Cash-on-Cash Return
2.5%
Cap rate
0.4%
Rent to Value Ratio
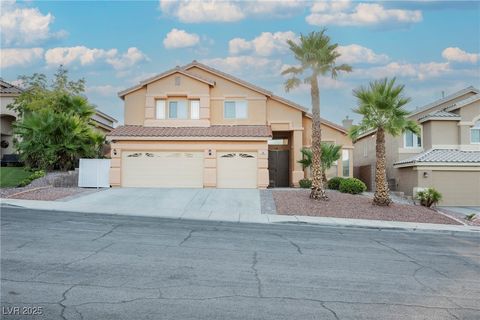
Active
$990,000
5
bds
|
5
ba
|
3,503
sqft
|
built
1997
259 Rockwell Springs Ct, Henderson, NV 89012
$-2,818
Cash flow
-14.9%
Cash-on-Cash Return
2.3%
Cap rate
0.4%
Rent to Value Ratio
Active
$750,000
4
bds
|
3
ba
|
2,909
sqft
|
built
2001
225 Ashville Ct, Henderson, NV 89012
$-1,638
Cash flow
-11.4%
Cash-on-Cash Return
3.1%
Cap rate
0.4%
Rent to Value Ratio
Active
$2,270,000
4
bds
|
5
ba
|
5,321
sqft
|
built
2005
761 Romano Ln, Henderson, NV 89012
$-4,624
Cash flow
-10.6%
Cash-on-Cash Return
3.2%
Cap rate
0.5%
Rent to Value Ratio
Active
$575,000
3
bds
|
2
ba
|
1,976
sqft
|
built
1996
1761 Summerwood Cir, Henderson, NV 89012
$-1,217
Cash flow
-11.0%
Cash-on-Cash Return
3.1%
Cap rate
0.5%
Rent to Value Ratio
Active
$17,000,000
5
bds
|
8
ba
|
8,555
sqft
|
built
2021
1550 Dragon Crest Ave, Henderson, NV 89012
$-80,692
Cash flow
-24.8%
Cash-on-Cash Return
0.0%
Cap rate
0.0%
Rent to Value Ratio
Active
$599,999
4
bds
|
3
ba
|
2,206
sqft
|
built
2002
196 Mount Earl Ave, Henderson, NV 89012
$-1,474
Cash flow
-12.8%
Cash-on-Cash Return
2.7%
Cap rate
0.4%
Rent to Value Ratio
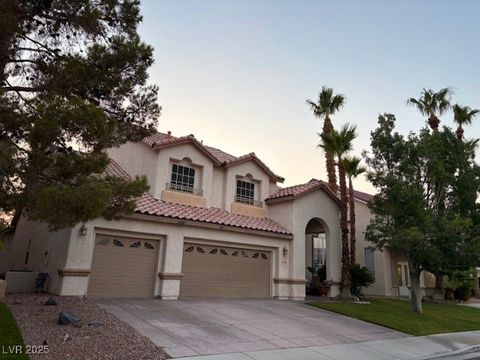
Active
$949,000
5
bds
|
4
ba
|
3,741
sqft
|
built
1997
302 Doe Run Cir, Henderson, NV 89012
$-1,971
Cash flow
-10.8%
Cash-on-Cash Return
3.2%
Cap rate
0.5%
Rent to Value Ratio
Active
$670,000
4
bds
|
4
ba
|
2,813
sqft
|
built
1999
273 Pointe Ranier Ave, Henderson, NV 89012
$-1,653
Cash flow
-12.9%
Cash-on-Cash Return
2.7%
Cap rate
0.4%
Rent to Value Ratio
Active
$524,900
3
bds
|
3
ba
|
1,704
sqft
|
built
1997
261 Horizon Pointe Cir, Henderson, NV 89012
$-1,204
Cash flow
-12.0%
Cash-on-Cash Return
2.9%
Cap rate
0.4%
Rent to Value Ratio
Active
$679,900
5
bds
|
3
ba
|
3,178
sqft
|
built
2000
53 Hidden Mesa Ct, Henderson, NV 89012
$-1,297
Cash flow
-10.0%
Cash-on-Cash Return
3.4%
Cap rate
0.5%
Rent to Value Ratio
Active
$519,900
3
bds
|
3
ba
|
1,969
sqft
|
built
1997
254 Horizon Pointe Cir, Henderson, NV 89012
$-1,247
Cash flow
-12.5%
Cash-on-Cash Return
2.8%
Cap rate
0.4%
Rent to Value Ratio
Active
$329,990
2
bds
|
2
ba
|
1,229
sqft
|
built
2005
1362 Grass Creek Ave, Henderson, NV 89012
$-668
Cash flow
-10.6%
Cash-on-Cash Return
3.3%
Cap rate
0.5%
Rent to Value Ratio
Active
$699,900
4
bds
|
3
ba
|
2,813
sqft
|
built
1997
1598 Signal Butte Way, Henderson, NV 89012
$-1,526
Cash flow
-11.4%
Cash-on-Cash Return
3.1%
Cap rate
0.4%
Rent to Value Ratio
Active
$375,000
3
bds
|
3
ba
|
1,408
sqft
|
built
2000
1453 Evening Song Ave, Henderson, NV 89012
$-683
Cash flow
-9.5%
Cash-on-Cash Return
3.5%
Cap rate
0.5%
Rent to Value Ratio
Active
$412,000
3
bds
|
3
ba
|
1,632
sqft
|
built
2004
707 Value Ridge Ave, Henderson, NV 89012
$-676
Cash flow
-8.6%
Cash-on-Cash Return
3.7%
Cap rate
0.5%
Rent to Value Ratio
Active
$460,000
3
bds
|
2
ba
|
1,329
sqft
|
built
1996
1966 Windfall Ave, Henderson, NV 89012
$-1,058
Cash flow
-12.0%
Cash-on-Cash Return
2.9%
Cap rate
0.4%
Rent to Value Ratio
Active
$515,000
3
bds
|
3
ba
|
2,021
sqft
|
built
2002
197 Kings Canyon Ct, Henderson, NV 89012
$-1,064
Cash flow
-10.8%
Cash-on-Cash Return
3.2%
Cap rate
0.4%
Rent to Value Ratio
Active
$449,000
3
bds
|
4
ba
|
2,120
sqft
|
built
2016
1348 Jewelstone Cir, Henderson, NV 89012
$-1,101
Cash flow
-12.8%
Cash-on-Cash Return
2.7%
Cap rate
0.5%
Rent to Value Ratio
Active
$1,129,990
4
bds
|
5
ba
|
3,975
sqft
|
built
2006
364 Trentino Alto St, Henderson, NV 89012
$-3,238
Cash flow
-15.0%
Cash-on-Cash Return
2.2%
Cap rate
0.4%
Rent to Value Ratio
Active
$5,995,000
4
bds
|
5
ba
|
5,320
sqft
|
built
2018
671 Scenic Rim Dr, Henderson, NV 89012
$-23,370
Cash flow
-20.3%
Cash-on-Cash Return
1.0%
Cap rate
0.2%
Rent to Value Ratio
Active
$7,995,000
5
bds
|
7
ba
|
7,690
sqft
|
built
2020
811 Magnum Cliff Ct, Henderson, NV 89012
$-36,784
Cash flow
-24.0%
Cash-on-Cash Return
0.2%
Cap rate
0.1%
Rent to Value Ratio
Active
$4,450,000
3
bds
|
5
ba
|
4,327
sqft
|
built
2020
507 Serenity Point Dr, Henderson, NV 89012
$-16,865
Cash flow
-19.8%
Cash-on-Cash Return
1.1%
Cap rate
0.2%
Rent to Value Ratio
Active
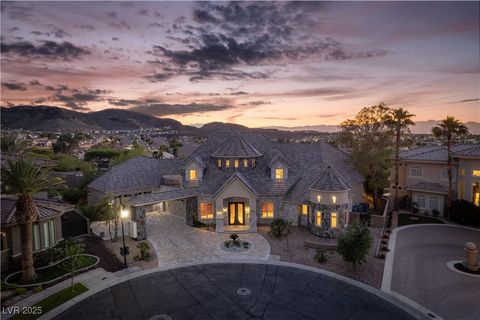
$11,650,000
5
bds
|
6
ba
|
8,438
sqft
|
built
2021
6 Vista Crescent Ct, Henderson, NV 89012
$-59,079
Cash flow
-26.5%
Cash-on-Cash Return
-0.4%
Cap rate
0.0%
Rent to Value Ratio
Active
$9,250,000
5
bds
|
8
ba
|
6,670
sqft
|
built
2020
13 Rockstream Dr, Henderson, NV 89012
$-39,955
Cash flow
-22.5%
Cash-on-Cash Return
0.5%
Cap rate
0.1%
Rent to Value Ratio