89015 Investment Properties for Sale
Browse homes for sale and investment properties in 89015. Refine your search by price, property type, or more.
Best cash flowing properties in 89015
Active
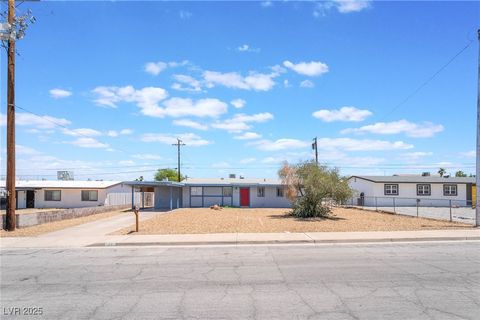
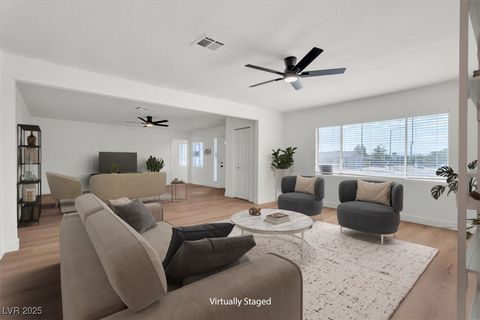
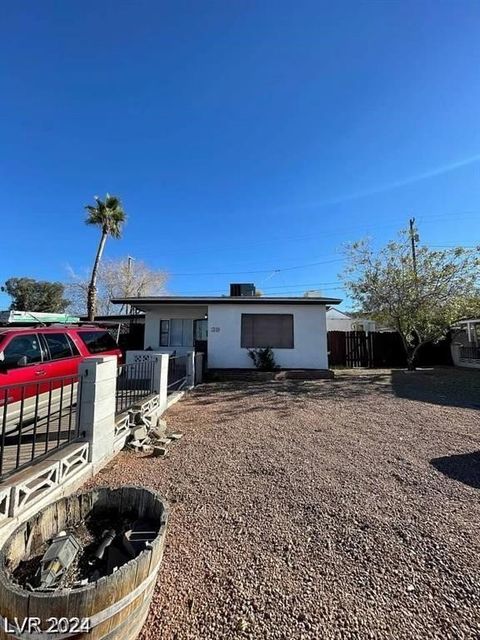
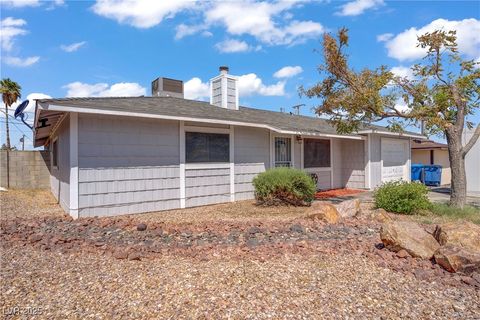
$319,000
3
bds
|
2
ba
|
1,104
sqft
|
built
1963
77 Constitution Ave, Henderson, NV 89015
$-315
Cash flow
-5.2%
Cash-on-Cash Return
4.5%
Cap rate
0.6%
Rent to Value Ratio
Active
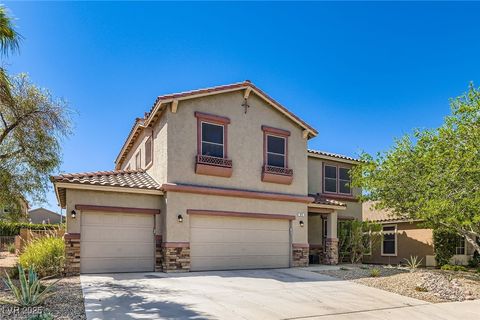
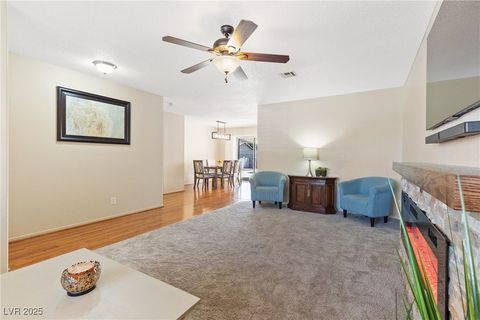
$350,000
3
bds
|
2
ba
|
1,680
sqft
|
built
1953
266 S Major Ave, Henderson, NV 89015
$-327
Cash flow
-4.9%
Cash-on-Cash Return
4.6%
Cap rate
0.6%
Rent to Value Ratio
97 out of 105 properties for sale in 89015
Limited Results Shown
Create a free account, or log in to reveal all property listings and enjoy the complete experience.
Active
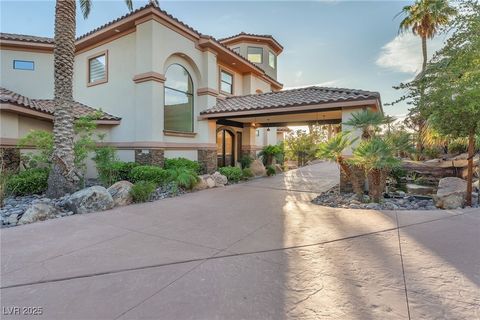
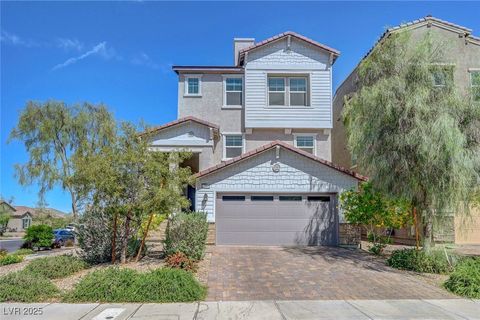
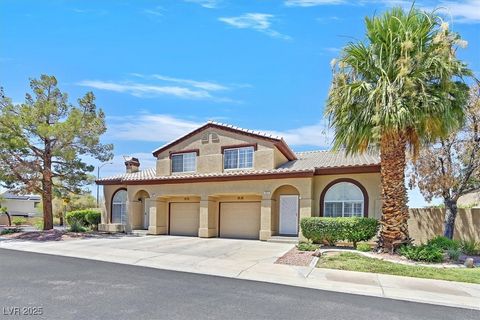
$525,000
4
bds
|
3
ba
|
2,469
sqft
|
built
2004
815 Cardamom Ct, Henderson, NV 89015
$-948
Cash flow
-9.4%
Cash-on-Cash Return
3.5%
Cap rate
0.5%
Rent to Value Ratio
Active
$2,699,999
5
bds
|
5
ba
|
6,724
sqft
|
built
2010
743 N Orleans St, Henderson, NV 89015
$-7,392
Cash flow
-14.3%
Cash-on-Cash Return
2.4%
Cap rate
0.3%
Rent to Value Ratio
Active
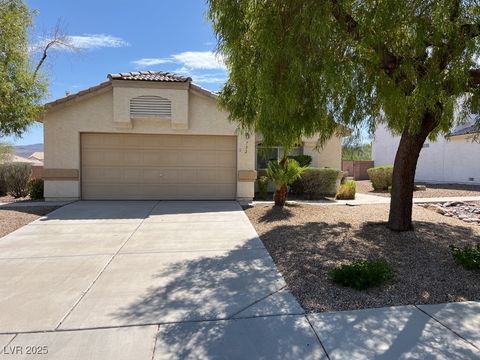
$473,930
3
bds
|
2
ba
|
1,629
sqft
|
built
1998
1038 Beaver Crest Ter, Henderson, NV 89015
$-808
Cash flow
-8.9%
Cash-on-Cash Return
3.6%
Cap rate
0.5%
Rent to Value Ratio
Active
$485,888
4
bds
|
2
ba
|
2,110
sqft
|
built
1999
840 Candido Garcia Ave, Henderson, NV 89015
$-1,069
Cash flow
-11.5%
Cash-on-Cash Return
3.0%
Cap rate
0.4%
Rent to Value Ratio
Active
$410,000
3
bds
|
2
ba
|
1,303
sqft
|
built
1998
887 Cozy Valley St, Henderson, NV 89015
$-590
Cash flow
-7.5%
Cash-on-Cash Return
4.0%
Cap rate
0.5%
Rent to Value Ratio
Active
$430,000
3
bds
|
2
ba
|
1,514
sqft
|
built
2021
76 Summer Rhapsody Ave, Henderson, NV 89015
$-748
Cash flow
-9.1%
Cash-on-Cash Return
3.6%
Cap rate
0.6%
Rent to Value Ratio
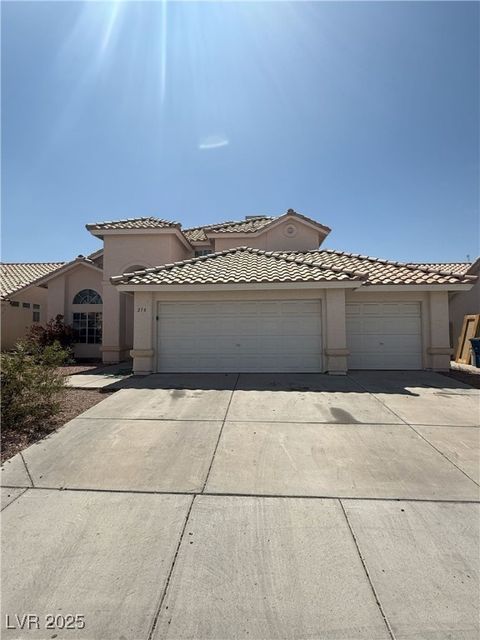
Active
$505,000
3
bds
|
3
ba
|
2,199
sqft
|
built
1996
216 Night Fall Ter, Henderson, NV 89015
$-852
Cash flow
-8.8%
Cash-on-Cash Return
3.7%
Cap rate
0.5%
Rent to Value Ratio
Active
$367,333
3
bds
|
3
ba
|
1,483
sqft
|
built
2020
727 Florence Isle Ave, Henderson, NV 89015
$-524
Cash flow
-7.4%
Cash-on-Cash Return
4.0%
Cap rate
0.6%
Rent to Value Ratio
Active
$490,000
3
bds
|
2
ba
|
1,592
sqft
|
built
2023
296 Fletcher Falls St, Henderson, NV 89015
$-1,162
Cash flow
-12.4%
Cash-on-Cash Return
2.8%
Cap rate
0.5%
Rent to Value Ratio
Active
$485,000
3
bds
|
2
ba
|
1,815
sqft
|
built
1997
1064 Pincay Dr, Henderson, NV 89015
$-936
Cash flow
-10.1%
Cash-on-Cash Return
3.4%
Cap rate
0.5%
Rent to Value Ratio
Active
$415,000
3
bds
|
2
ba
|
1,226
sqft
|
built
1995
500 Grape Dr, Henderson, NV 89015
$-556
Cash flow
-7.0%
Cash-on-Cash Return
4.1%
Cap rate
0.5%
Rent to Value Ratio
Active
$459,900
4
bds
|
2
ba
|
2,009
sqft
|
built
1992
364 Dooley Dr, Henderson, NV 89015
$-725
Cash flow
-8.2%
Cash-on-Cash Return
3.8%
Cap rate
0.5%
Rent to Value Ratio
Active
$585,500
4
bds
|
3
ba
|
2,703
sqft
|
built
2023
290 Mount Williamson St, Henderson, NV 89015
$-1,081
Cash flow
-9.6%
Cash-on-Cash Return
3.5%
Cap rate
0.5%
Rent to Value Ratio
Active
$450,000
4
bds
|
2
ba
|
1,629
sqft
|
built
1995
424 Wright Way, Henderson, NV 89015
$-686
Cash flow
-8.0%
Cash-on-Cash Return
3.9%
Cap rate
0.5%
Rent to Value Ratio
Active
$399,900
3
bds
|
1
ba
|
1,040
sqft
|
built
1942
39 E Pacific Ave, Henderson, NV 89015
$-1,138
Cash flow
-14.8%
Cash-on-Cash Return
2.3%
Cap rate
0.3%
Rent to Value Ratio
Active
$379,000
3
bds
|
2
ba
|
1,408
sqft
|
built
2001
732 Goshawk St, Henderson, NV 89015
$-657
Cash flow
-9.0%
Cash-on-Cash Return
3.6%
Cap rate
0.5%
Rent to Value Ratio
Active
$374,880
3
bds
|
2
ba
|
1,008
sqft
|
built
1980
407 Tiger Lily Way, Henderson, NV 89015
$-596
Cash flow
-8.3%
Cash-on-Cash Return
3.8%
Cap rate
0.5%
Rent to Value Ratio
Active
$499,000
3
bds
|
4
ba
|
2,344
sqft
|
built
2020
96 Campbelltown Ave, Henderson, NV 89015
$-1,080
Cash flow
-11.3%
Cash-on-Cash Return
3.1%
Cap rate
0.5%
Rent to Value Ratio
Active
$329,900
3
bds
|
3
ba
|
1,447
sqft
|
built
2022
480 Filaree Pl, Henderson, NV 89015
$-615
Cash flow
-9.7%
Cash-on-Cash Return
3.4%
Cap rate
0.6%
Rent to Value Ratio
Active
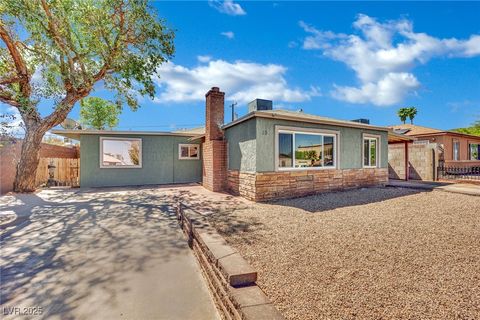
$419,777
4
bds
|
2
ba
|
1,916
sqft
|
built
1954
111 Cedar St, Henderson, NV 89015
$-526
Cash flow
-6.5%
Cash-on-Cash Return
4.2%
Cap rate
0.5%
Rent to Value Ratio
Active
$299,900
2
bds
|
1
ba
|
670
sqft
|
built
1942
206 W Atlantic Ave, Henderson, NV 89015
$-559
Cash flow
-9.7%
Cash-on-Cash Return
3.4%
Cap rate
0.4%
Rent to Value Ratio
Active
$519,999
3
bds
|
3
ba
|
1,661
sqft
|
built
2021
747 N Water St, Henderson, NV 89015
$-910
Cash flow
-9.1%
Cash-on-Cash Return
3.6%
Cap rate
0.6%
Rent to Value Ratio
Active
$475,000
3
bds
|
2
ba
|
1,622
sqft
|
built
1984
234 Denver Way, Henderson, NV 89015
$-797
Cash flow
-8.8%
Cash-on-Cash Return
3.7%
Cap rate
0.5%
Rent to Value Ratio
Active
$445,000
3
bds
|
2
ba
|
1,356
sqft
|
built
1994
260 Lido Dr, Henderson, NV 89015
$-877
Cash flow
-10.3%
Cash-on-Cash Return
3.3%
Cap rate
0.4%
Rent to Value Ratio
Active
$335,000
2
bds
|
3
ba
|
1,287
sqft
|
built
1997
690 Ambling Gait Ave, Henderson, NV 89015
$-601
Cash flow
-9.4%
Cash-on-Cash Return
3.5%
Cap rate
0.5%
Rent to Value Ratio
Active
$379,990
4
bds
|
2
ba
|
1,676
sqft
|
built
1952
15 Lowery St, Henderson, NV 89015
$-478
Cash flow
-6.6%
Cash-on-Cash Return
4.2%
Cap rate
0.5%
Rent to Value Ratio
Active
$1,395,000
3
bds
|
4
ba
|
2,713
sqft
|
built
2016
186 S Naples St, Henderson, NV 89015
$-2,395
Cash flow
-9.0%
Cash-on-Cash Return
3.6%
Cap rate
0.5%
Rent to Value Ratio
Active
$427,500
4
bds
|
3
ba
|
1,936
sqft
|
built
2023
328 Owens Peak Dr, Henderson, NV 89015
$-962
Cash flow
-11.7%
Cash-on-Cash Return
3.0%
Cap rate
0.5%
Rent to Value Ratio
Active
$324,900
3
bds
|
3
ba
|
1,446
sqft
|
built
1997
916 Twinkling Sky Ave, Henderson, NV 89015
$-452
Cash flow
-7.3%
Cash-on-Cash Return
4.0%
Cap rate
0.6%
Rent to Value Ratio
Active
$734,900
4
bds
|
2
ba
|
2,038
sqft
|
built
1992
308 Cannes St, Henderson, NV 89015
$-1,624
Cash flow
-11.5%
Cash-on-Cash Return
3.0%
Cap rate
0.4%
Rent to Value Ratio
Active
$198,000
2
bds
|
2
ba
|
886
sqft
|
built
1993
601 Cabrillo Cir, Henderson, NV 89015
$-352
Cash flow
-9.3%
Cash-on-Cash Return
3.5%
Cap rate
0.7%
Rent to Value Ratio
Active
$465,000
3
bds
|
2
ba
|
1,425
sqft
|
built
1995
834 Dulce Fountain Way, Henderson, NV 89015
$-902
Cash flow
-10.1%
Cash-on-Cash Return
3.4%
Cap rate
0.5%
Rent to Value Ratio
Active
$329,900
3
bds
|
1
ba
|
1,034
sqft
|
built
1942
170 Copper St, Henderson, NV 89015
$-422
Cash flow
-6.7%
Cash-on-Cash Return
4.1%
Cap rate
0.5%
Rent to Value Ratio
Active
$549,900
4
bds
|
3
ba
|
2,246
sqft
|
built
1997
994 River Walk Ct, Henderson, NV 89015
$-1,401
Cash flow
-13.3%
Cash-on-Cash Return
2.6%
Cap rate
0.4%
Rent to Value Ratio
Active
$255,000
2
bds
|
2
ba
|
1,151
sqft
|
built
1995
698 S Racetrack Rd, Henderson, NV 89015
$-385
Cash flow
-7.9%
Cash-on-Cash Return
3.9%
Cap rate
0.6%
Rent to Value Ratio
Active
$349,900
2
bds
|
2
ba
|
1,116
sqft
|
built
1983
403 Woodridge Dr, Henderson, NV 89015
$-494
Cash flow
-7.4%
Cash-on-Cash Return
4.0%
Cap rate
0.5%
Rent to Value Ratio
Active
$409,900
3
bds
|
2
ba
|
1,425
sqft
|
built
1997
812 Rio Poco Ct, Henderson, NV 89015
$-710
Cash flow
-9.0%
Cash-on-Cash Return
3.6%
Cap rate
0.5%
Rent to Value Ratio
Active
$640,000
4
bds
|
4
ba
|
3,668
sqft
|
built
2007
368 Misty Moonlight St, Henderson, NV 89015
$-965
Cash flow
-7.9%
Cash-on-Cash Return
3.9%
Cap rate
0.5%
Rent to Value Ratio