89029 Investment Properties for Sale
Browse homes for sale and investment properties in 89029. Refine your search by price, property type, or more.
Best cash flowing properties in 89029
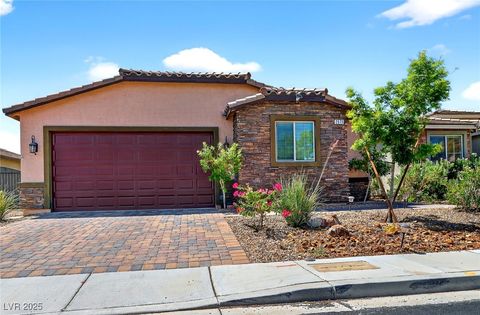
Active
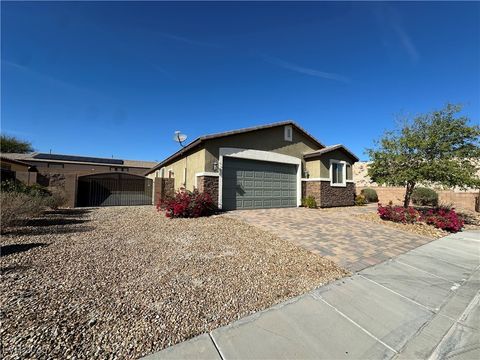
$129,900
3
bds
|
2
ba
|
1,194
sqft
|
built
1989
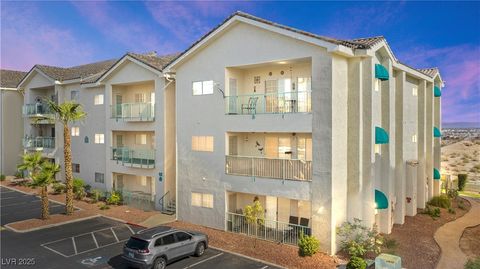
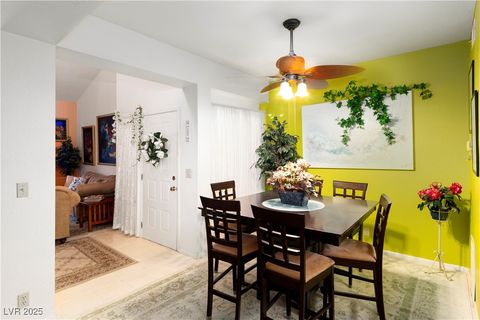
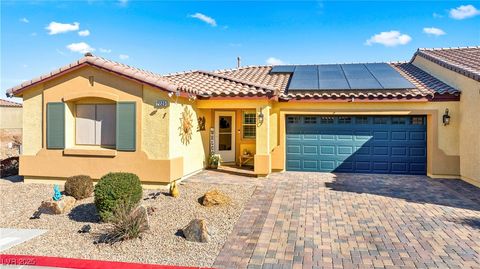
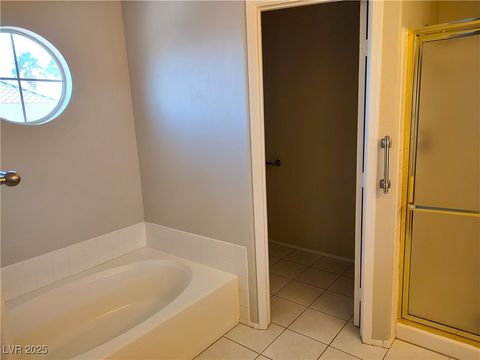
2012 Mesquite Ln, Laughlin, NV 89029
$-5
Cash flow
-0.2%
Cash-on-Cash Return
5.6%
Cap rate
1.1%
Rent to Value Ratio
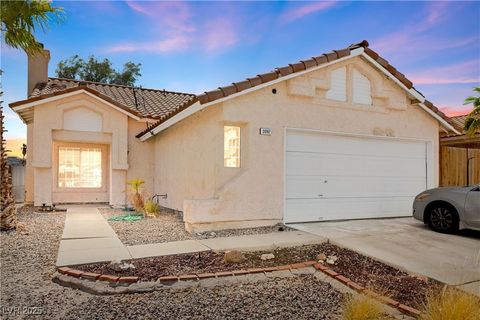
Active
$130,000
2
bds
|
2
ba
|
990
sqft
|
built
1989
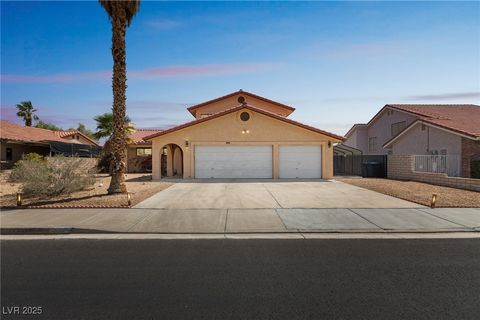
2004 Mesquite Ln, Laughlin, NV 89029
$-162
Cash flow
-6.5%
Cash-on-Cash Return
4.2%
Cap rate
0.8%
Rent to Value Ratio
92 out of 93 properties for sale in 89029
Limited Results Shown
Create a free account, or log in to reveal all property listings and enjoy the complete experience.
Active
$185,000
3
bds
|
2
ba
|
1,208
sqft
|
built
1987
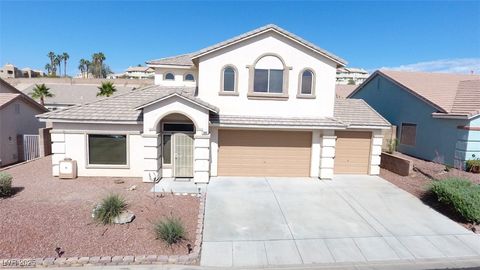
1936 Las Palmas Ln, Laughlin, NV 89029
$-348
Cash flow
-9.8%
Cash-on-Cash Return
3.4%
Cap rate
0.8%
Rent to Value Ratio
Active
$178,990
2
bds
|
2
ba
|
900
sqft
|
built
1990
2160 Highpointe Dr, Laughlin, NV 89029
$-448
Cash flow
-13.1%
Cash-on-Cash Return
2.7%
Cap rate
0.6%
Rent to Value Ratio
Active
$198,800
2
bds
|
2
ba
|
900
sqft
|
built
1990
2240 Highpointe Dr, Laughlin, NV 89029
$-403
Cash flow
-10.6%
Cash-on-Cash Return
3.2%
Cap rate
0.7%
Rent to Value Ratio
Active
$300,000
3
bds
|
2
ba
|
1,404
sqft
|
built
2018
2175 Limestone Cove Ct, Laughlin, NV 89029
$-520
Cash flow
-9.0%
Cash-on-Cash Return
3.6%
Cap rate
0.6%
Rent to Value Ratio
Active
$215,990
2
bds
|
2
ba
|
1,205
sqft
|
built
1984
3740 Desert Marina Dr, Laughlin, NV 89029
$-527
Cash flow
-12.7%
Cash-on-Cash Return
2.8%
Cap rate
0.6%
Rent to Value Ratio
Active
$189,900
2
bds
|
2
ba
|
1,067
sqft
|
built
1990
3550 Bay Sands Dr, Laughlin, NV 89029
$-272
Cash flow
-7.5%
Cash-on-Cash Return
4.0%
Cap rate
0.7%
Rent to Value Ratio
Active
$429,900
4
bds
|
3
ba
|
1,906
sqft
|
built
2017
2748 Brinkley Manor St, Laughlin, NV 89029
$-1,288
Cash flow
-15.6%
Cash-on-Cash Return
2.1%
Cap rate
0.4%
Rent to Value Ratio
Active
$299,999
3
bds
|
2
ba
|
1,404
sqft
|
built
2007
2851 China Cove St, Laughlin, NV 89029
$-577
Cash flow
-10.0%
Cash-on-Cash Return
3.4%
Cap rate
0.6%
Rent to Value Ratio
Active
$185,000
2
bds
|
2
ba
|
1,205
sqft
|
built
1984
3791 Desert Marina Dr, Laughlin, NV 89029
$-369
Cash flow
-10.4%
Cash-on-Cash Return
3.3%
Cap rate
0.8%
Rent to Value Ratio
Active
$215,000
2
bds
|
2
ba
|
1,205
sqft
|
built
1984
3750 Desert Marina Dr, Laughlin, NV 89029
$-521
Cash flow
-12.6%
Cash-on-Cash Return
2.8%
Cap rate
0.7%
Rent to Value Ratio
Active
$159,900
2
bds
|
2
ba
|
1,208
sqft
|
built
1994
3550 Bay Sands Dr, Laughlin, NV 89029
$-184
Cash flow
-6.0%
Cash-on-Cash Return
4.3%
Cap rate
0.9%
Rent to Value Ratio
Active
$282,500
3
bds
|
2
ba
|
1,244
sqft
|
built
1989
2266 Carved Canyon Ln, Laughlin, NV 89029
$-322
Cash flow
-5.9%
Cash-on-Cash Return
4.3%
Cap rate
0.6%
Rent to Value Ratio
Active
$239,500
3
bds
|
3
ba
|
1,617
sqft
|
built
1993
2208 Rugged Mesa Dr, Laughlin, NV 89029
$-530
Cash flow
-11.5%
Cash-on-Cash Return
3.0%
Cap rate
0.7%
Rent to Value Ratio
Active
$110,000
1
bds
|
1
ba
|
572
sqft
|
built
1990
3550 Bay Sands Dr, Laughlin, NV 89029
$-231
Cash flow
-11.0%
Cash-on-Cash Return
3.2%
Cap rate
0.8%
Rent to Value Ratio
Active
$239,000
2
bds
|
3
ba
|
1,634
sqft
|
built
1989
3859 Desert Marina Dr, Laughlin, NV 89029
$-368
Cash flow
-8.0%
Cash-on-Cash Return
3.8%
Cap rate
0.8%
Rent to Value Ratio
Active
$290,000
3
bds
|
2
ba
|
1,202
sqft
|
built
2017
2225 Chandler Ranch Pl, Laughlin, NV 89029
$-442
Cash flow
-8.0%
Cash-on-Cash Return
3.8%
Cap rate
0.6%
Rent to Value Ratio
Active
$414,900
4
bds
|
3
ba
|
2,332
sqft
|
built
1988
2111 River City Dr, Laughlin, NV 89029
$-397
Cash flow
-5.0%
Cash-on-Cash Return
4.5%
Cap rate
0.6%
Rent to Value Ratio
Active
$390,000
3
bds
|
3
ba
|
2,248
sqft
|
built
2003
2905 Shimmering Bay St, Laughlin, NV 89029
$-615
Cash flow
-8.2%
Cash-on-Cash Return
3.8%
Cap rate
0.5%
Rent to Value Ratio
Active
$440,000
4
bds
|
3
ba
|
2,129
sqft
|
built
2016
2040 Port Royal Dr, Laughlin, NV 89029
$-932
Cash flow
-11.1%
Cash-on-Cash Return
3.1%
Cap rate
0.5%
Rent to Value Ratio
Active
$159,990
2
bds
|
2
ba
|
986
sqft
|
built
1989
2064 Mesquite Ln, Laughlin, NV 89029
$-333
Cash flow
-10.9%
Cash-on-Cash Return
3.2%
Cap rate
0.7%
Rent to Value Ratio

Active
$459,990
4
bds
|
3
ba
|
2,728
sqft
|
built
1989
2089 Avalon Dr, Laughlin, NV 89029
$-858
Cash flow
-9.7%
Cash-on-Cash Return
3.4%
Cap rate
0.5%
Rent to Value Ratio
Active
$349,900
3
bds
|
2
ba
|
1,358
sqft
|
built
1988
3160 James A Bilbray Pkwy, Laughlin, NV 89029
$-770
Cash flow
-11.5%
Cash-on-Cash Return
3.0%
Cap rate
0.4%
Rent to Value Ratio
Active
$293,000
3
bds
|
2
ba
|
1,202
sqft
|
built
2008
2843 China Cove St, Laughlin, NV 89029
$-434
Cash flow
-7.7%
Cash-on-Cash Return
3.9%
Cap rate
0.6%
Rent to Value Ratio
Active
$399,990
4
bds
|
3
ba
|
1,906
sqft
|
built
2017
2079 Port Royal Dr, Laughlin, NV 89029
$-794
Cash flow
-10.4%
Cash-on-Cash Return
3.3%
Cap rate
0.5%
Rent to Value Ratio
Active
$279,900
3
bds
|
2
ba
|
1,244
sqft
|
built
1989
3097 Canyon Terrace Dr, Laughlin, NV 89029
$-384
Cash flow
-7.2%
Cash-on-Cash Return
4.0%
Cap rate
0.6%
Rent to Value Ratio
Active
$135,000
2
bds
|
1
ba
|
810
sqft
|
built
1984
3771 Desert Marina Dr, Laughlin, NV 89029
$-315
Cash flow
-12.2%
Cash-on-Cash Return
2.9%
Cap rate
0.8%
Rent to Value Ratio
Active
$147,000
1
bds
|
1
ba
|
716
sqft
|
built
1990
3550 Bay Sands Dr, Laughlin, NV 89029
$-182
Cash flow
-6.5%
Cash-on-Cash Return
4.2%
Cap rate
0.8%
Rent to Value Ratio
Active
$415,000
4
bds
|
3
ba
|
1,906
sqft
|
built
2017
2772 Brinkley Manor St, Laughlin, NV 89029
$-865
Cash flow
-10.9%
Cash-on-Cash Return
3.2%
Cap rate
0.5%
Rent to Value Ratio
Active
$174,950
2
bds
|
1
ba
|
810
sqft
|
built
1984
3791 Desert Marina Dr, Laughlin, NV 89029
$-307
Cash flow
-9.2%
Cash-on-Cash Return
3.6%
Cap rate
0.8%
Rent to Value Ratio
Active
$379,990
3
bds
|
2
ba
|
1,931
sqft
|
built
1988
3218 Ocotillo Dr, Laughlin, NV 89029
$-592
Cash flow
-8.1%
Cash-on-Cash Return
3.8%
Cap rate
0.5%
Rent to Value Ratio
Active
$407,900
3
bds
|
2
ba
|
1,944
sqft
|
built
1993
3652 Brian Ct, Laughlin, NV 89029
$-568
Cash flow
-7.3%
Cash-on-Cash Return
4.0%
Cap rate
0.6%
Rent to Value Ratio
Active
$239,900
3
bds
|
3
ba
|
1,617
sqft
|
built
1993
2223 Rugged Mesa Dr, Laughlin, NV 89029
$-487
Cash flow
-10.6%
Cash-on-Cash Return
3.2%
Cap rate
0.7%
Rent to Value Ratio
Active
$189,900
2
bds
|
2
ba
|
900
sqft
|
built
1989
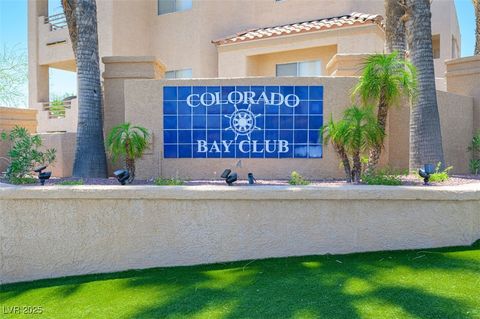
2191 Bay Club Dr, Laughlin, NV 89029
$-493
Cash flow
-13.5%
Cash-on-Cash Return
2.6%
Cap rate
0.6%
Rent to Value Ratio
Active
$120,000
1
bds
|
1
ba
|
700
sqft
|
built
1989
1964 Las Palmas Ln, Laughlin, NV 89029
$-218
Cash flow
-9.5%
Cash-on-Cash Return
3.5%
Cap rate
0.9%
Rent to Value Ratio
Active
$175,000
2
bds
|
1
ba
|
998
sqft
|
built
1994
3550 Bay Sands Dr, Laughlin, NV 89029
$-243
Cash flow
-7.2%
Cash-on-Cash Return
4.0%
Cap rate
0.8%
Rent to Value Ratio

Active
$178,500
2
bds
|
1
ba
|
911
sqft
|
built
1984
3811 Desert Marina Dr, Laughlin, NV 89029
$-401
Cash flow
-11.7%
Cash-on-Cash Return
3.0%
Cap rate
0.7%
Rent to Value Ratio

Active
$150,000
2
bds
|
1
ba
|
810
sqft
|
built
1984
3800 Desert Marina Dr, Laughlin, NV 89029
$-326
Cash flow
-11.3%
Cash-on-Cash Return
3.1%
Cap rate
0.8%
Rent to Value Ratio
Active
$389,000
3
bds
|
2
ba
|
1,906
sqft
|
built
1985
2063 Avalon Dr, Laughlin, NV 89029
$-627
Cash flow
-8.4%
Cash-on-Cash Return
3.7%
Cap rate
0.5%
Rent to Value Ratio