89030 Investment Properties for Sale
Browse homes for sale and investment properties in 89030. Refine your search by price, property type, or more.
Best cash flowing properties in 89030
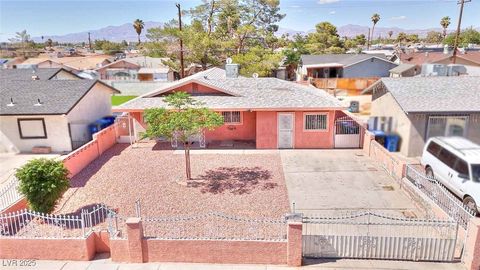
Active
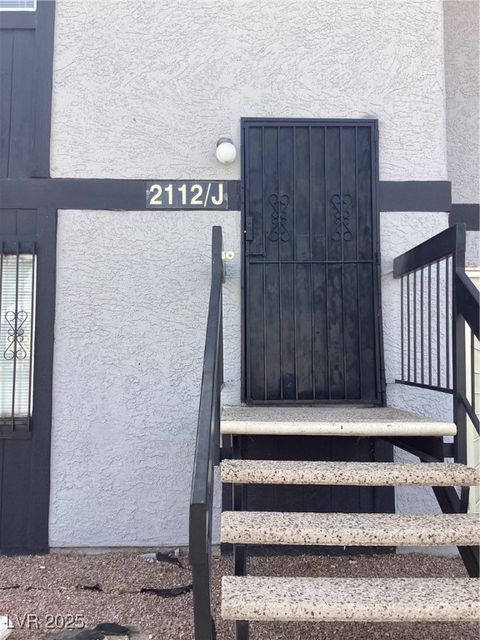
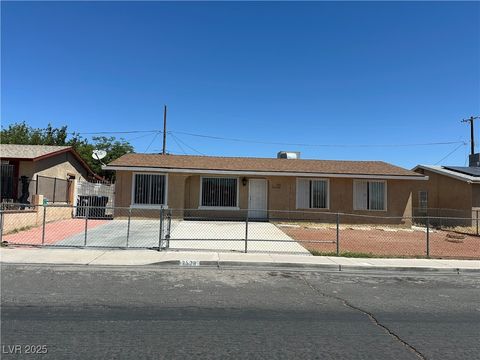
$195,000
3
bds
|
2
ba
|
1,188
sqft
|
built
1983
2112 Sun Ave, North Las Vegas, NV 89030
$134
Cash flow
3.6%
Cash-on-Cash Return
6.5%
Cap rate
0.9%
Rent to Value Ratio

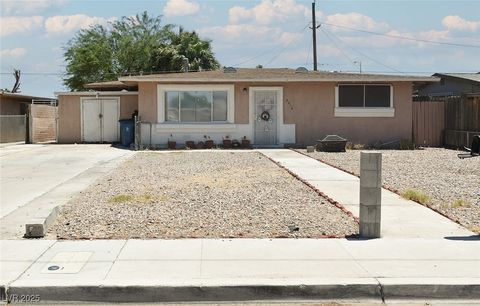
Active
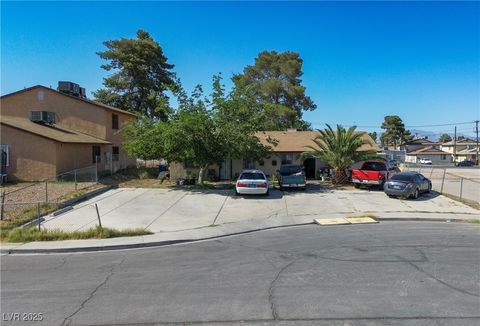
$170,000
2
bds
|
2
ba
|
1,080
sqft
|
built
1983
3420 Mercury St, North Las Vegas, NV 89030
$118
Cash flow
3.6%
Cash-on-Cash Return
6.5%
Cap rate
0.9%
Rent to Value Ratio
60 out of 60 properties for sale in 89030
Limited Results Shown
Create a free account, or log in to reveal all property listings and enjoy the complete experience.
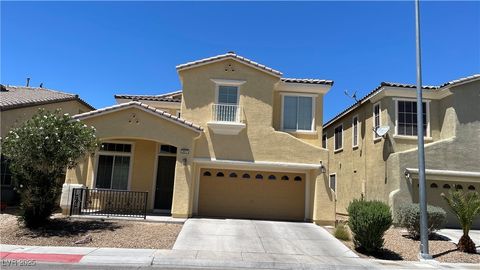
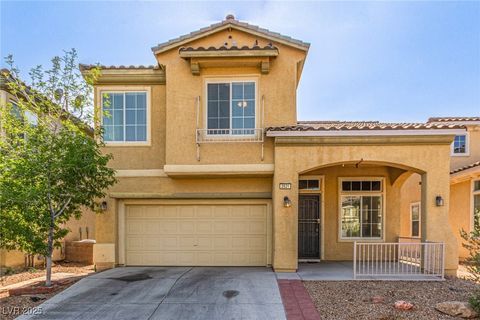
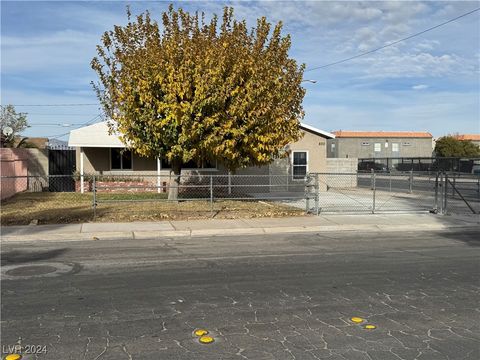
Active
$389,999
4
bds
|
0
ba
|
1,716
sqft
|
built
1980
4 Britz Cir, North Las Vegas, NV 89030
$-1,225
Cash flow
-16.4%
Cash-on-Cash Return
1.9%
Cap rate
0.3%
Rent to Value Ratio

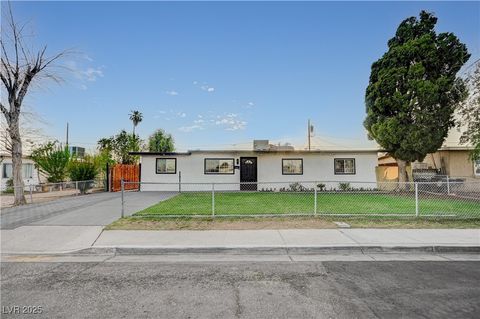
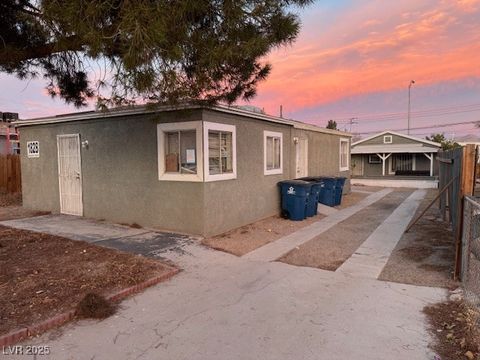
Active
$188,000
2
bds
|
2
ba
|
1,000
sqft
|
built
1983
3500 Mercury St, North Las Vegas, NV 89030
$-151
Cash flow
-4.2%
Cash-on-Cash Return
4.7%
Cap rate
0.7%
Rent to Value Ratio

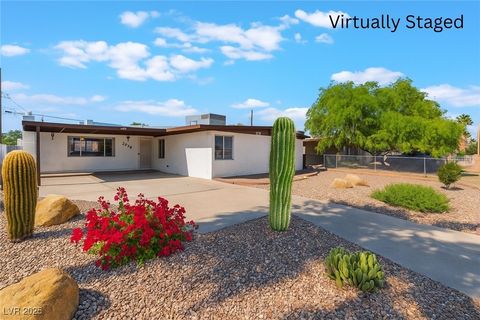
Active
$359,900
3
bds
|
2
ba
|
1,248
sqft
|
built
1966
725 Miller Ave, North Las Vegas, NV 89030
$-568
Cash flow
-8.2%
Cash-on-Cash Return
3.8%
Cap rate
0.5%
Rent to Value Ratio

Active
$365,000
4
bds
|
2
ba
|
1,336
sqft
|
built
1954
1628 Patricia St, North Las Vegas, NV 89030
$-545
Cash flow
-7.8%
Cash-on-Cash Return
3.9%
Cap rate
0.5%
Rent to Value Ratio
Active
$479,000
5
bds
|
3
ba
|
2,905
sqft
|
built
2007
2617 Star Manor St, North Las Vegas, NV 89030
$-872
Cash flow
-9.5%
Cash-on-Cash Return
3.5%
Cap rate
0.5%
Rent to Value Ratio
Active
$317,000
3
bds
|
2
ba
|
960
sqft
|
built
1956
2725 Holmes St, North Las Vegas, NV 89030
$-439
Cash flow
-7.2%
Cash-on-Cash Return
4.0%
Cap rate
0.5%
Rent to Value Ratio

Active
$319,990
3
bds
|
1
ba
|
1,023
sqft
|
built
1955
1736 Statz St, North Las Vegas, NV 89030
$-462
Cash flow
-7.5%
Cash-on-Cash Return
3.9%
Cap rate
0.5%
Rent to Value Ratio
Active
$349,900
4
bds
|
2
ba
|
1,252
sqft
|
built
1970
2528 E Brooks Ave, North Las Vegas, NV 89030
$-608
Cash flow
-9.1%
Cash-on-Cash Return
3.6%
Cap rate
0.5%
Rent to Value Ratio

Active
$325,000
4
bds
|
2
ba
|
1,100
sqft
|
built
1964
2537 Page St, North Las Vegas, NV 89030
$-616
Cash flow
-9.9%
Cash-on-Cash Return
3.4%
Cap rate
0.4%
Rent to Value Ratio

Active
$162,000
1
bds
|
1
ba
|
736
sqft
|
built
1981
3008 Saint George St, North Las Vegas, NV 89030
$-128
Cash flow
-4.1%
Cash-on-Cash Return
4.7%
Cap rate
0.7%
Rent to Value Ratio

Active
$349,900
3
bds
|
2
ba
|
1,150
sqft
|
built
1960
1629 James St, North Las Vegas, NV 89030
$-324
Cash flow
-4.8%
Cash-on-Cash Return
4.6%
Cap rate
0.6%
Rent to Value Ratio
Active
$292,990
3
bds
|
1
ba
|
1,016
sqft
|
built
1954
2616 Spear St, North Las Vegas, NV 89030
$-318
Cash flow
-5.7%
Cash-on-Cash Return
4.4%
Cap rate
0.5%
Rent to Value Ratio

Active
$310,000
3
bds
|
1
ba
|
1,213
sqft
|
built
1961
3308 Tabor Ave, North Las Vegas, NV 89030
$-275
Cash flow
-4.6%
Cash-on-Cash Return
4.6%
Cap rate
0.6%
Rent to Value Ratio
Active
$405,000
5
bds
|
0
ba
|
1,908
sqft
|
built
1981
1608 Putnam Ave, North Las Vegas, NV 89030
$-1,102
Cash flow
-14.2%
Cash-on-Cash Return
2.4%
Cap rate
0.3%
Rent to Value Ratio
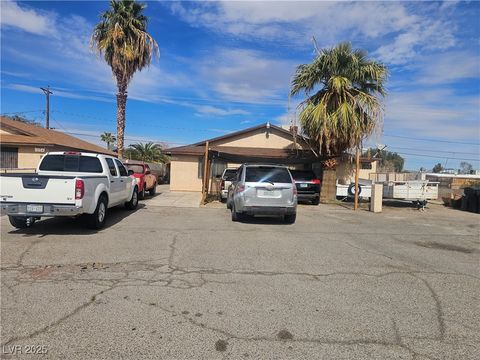
Active
$187,900
2
bds
|
2
ba
|
1,088
sqft
|
built
1981
3405 Civic Center Dr, North Las Vegas, NV 89030
$-102
Cash flow
-2.8%
Cash-on-Cash Return
5.0%
Cap rate
0.7%
Rent to Value Ratio

Active
$248,000
3
bds
|
2
ba
|
1,235
sqft
|
built
1971
3505 Mercury St, North Las Vegas, NV 89030
$-226
Cash flow
-4.8%
Cash-on-Cash Return
4.6%
Cap rate
0.6%
Rent to Value Ratio

Active
$140,000
1
bds
|
1
ba
|
736
sqft
|
built
1982
3008 Saint George St, North Las Vegas, NV 89030
$-100
Cash flow
-3.7%
Cash-on-Cash Return
4.8%
Cap rate
0.8%
Rent to Value Ratio
Active
$410,000
4
bds
|
3
ba
|
2,196
sqft
|
built
2007
2621 Rainbow Glow St, North Las Vegas, NV 89030
$-608
Cash flow
-7.7%
Cash-on-Cash Return
3.9%
Cap rate
0.5%
Rent to Value Ratio
Active
$340,000
3
bds
|
1
ba
|
1,169
sqft
|
built
1962
3104 Twining Ave, North Las Vegas, NV 89030
$-554
Cash flow
-8.5%
Cash-on-Cash Return
3.7%
Cap rate
0.5%
Rent to Value Ratio

Active
$188,000
2
bds
|
2
ba
|
1,080
sqft
|
built
1983
3500 Mercury St, North Las Vegas, NV 89030
$-84
Cash flow
-2.3%
Cash-on-Cash Return
5.1%
Cap rate
0.7%
Rent to Value Ratio
Active
$350,000
3
bds
|
3
ba
|
1,661
sqft
|
built
1958
2825 Hickey Ave, North Las Vegas, NV 89030
$-473
Cash flow
-7.1%
Cash-on-Cash Return
4.1%
Cap rate
0.5%
Rent to Value Ratio

Active
$369,900
3
bds
|
2
ba
|
1,640
sqft
|
built
1970
421 Miller Ave, North Las Vegas, NV 89030
$-643
Cash flow
-9.1%
Cash-on-Cash Return
3.6%
Cap rate
0.5%
Rent to Value Ratio

Active
$379,900
5
bds
|
1
ba
|
1,696
sqft
|
built
1966
2417 Saint George St, North Las Vegas, NV 89030
$-950
Cash flow
-13.0%
Cash-on-Cash Return
2.7%
Cap rate
0.3%
Rent to Value Ratio
Active
$375,000
bds
|
0
ba
|
1,300
sqft
|
built
1934
1828 Harvard St, North Las Vegas, NV 89030
$-985
Cash flow
-13.7%
Cash-on-Cash Return
2.5%
Cap rate
0.3%
Rent to Value Ratio
Active
$329,999
3
bds
|
1
ba
|
1,330
sqft
|
built
1954
820 Judson Ave, North Las Vegas, NV 89030
$-483
Cash flow
-7.6%
Cash-on-Cash Return
3.9%
Cap rate
0.5%
Rent to Value Ratio
Active
$230,000
2
bds
|
0
ba
|
988
sqft
|
built
1954
1400 Putnam Ave, North Las Vegas, NV 89030
$-514
Cash flow
-11.7%
Cash-on-Cash Return
3.0%
Cap rate
0.4%
Rent to Value Ratio
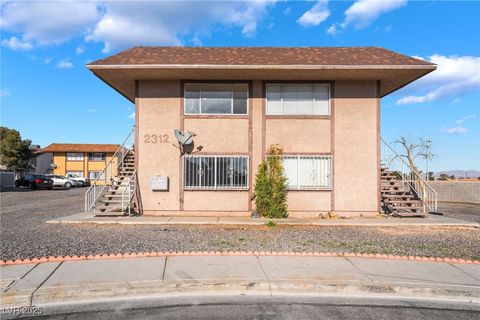
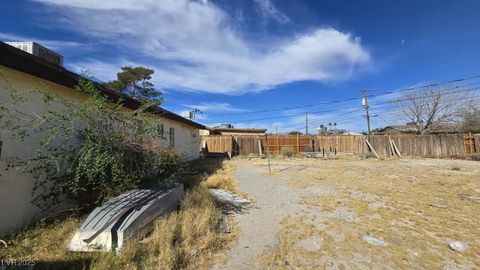
Active
$645,000
8
bds
|
0
ba
|
3,804
sqft
|
built
1984
2312 Seco Adobe Cir, North Las Vegas, NV 89030
$-2,106
Cash flow
-17.0%
Cash-on-Cash Return
1.8%
Cap rate
0.2%
Rent to Value Ratio

Active
$269,999
3
bds
|
1
ba
|
1,286
sqft
|
built
1960
3204 Emmons Ave, North Las Vegas, NV 89030
$-229
Cash flow
-4.4%
Cash-on-Cash Return
4.7%
Cap rate
0.6%
Rent to Value Ratio

Active
$175,000
2
bds
|
1
ba
|
991
sqft
|
built
1971
3523 Mercury St, North Las Vegas, NV 89030
$-104
Cash flow
-3.1%
Cash-on-Cash Return
5.0%
Cap rate
0.7%
Rent to Value Ratio
Active
$314,999
3
bds
|
1
ba
|
875
sqft
|
built
1962
3104 Dillon Ave, North Las Vegas, NV 89030
$-291
Cash flow
-4.8%
Cash-on-Cash Return
4.6%
Cap rate
0.6%
Rent to Value Ratio
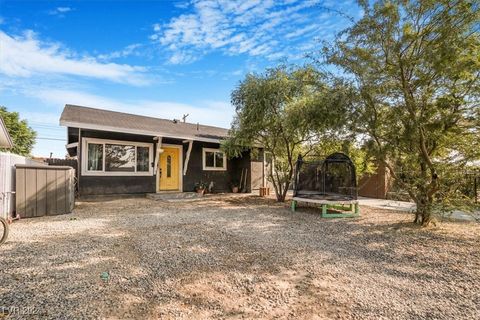
Active
$375,000
4
bds
|
0
ba
|
1,482
sqft
|
built
1954
2120 Glider St, North Las Vegas, NV 89030
$-1,054
Cash flow
-14.7%
Cash-on-Cash Return
2.3%
Cap rate
0.3%
Rent to Value Ratio
Active
$459,900
4
bds
|
2
ba
|
2,512
sqft
|
built
1964
309 Rossmoyne Ave, North Las Vegas, NV 89030
$-855
Cash flow
-9.7%
Cash-on-Cash Return
3.4%
Cap rate
0.4%
Rent to Value Ratio

Active
$365,000
3
bds
|
2
ba
|
1,161
sqft
|
built
1959
2801 Emmons Ave, North Las Vegas, NV 89030
$-56
Cash flow
-0.8%
Cash-on-Cash Return
5.5%
Cap rate
0.7%
Rent to Value Ratio

Active
$379,900
3
bds
|
2
ba
|
1,161
sqft
|
built
1961
2315 Perliter Ave, North Las Vegas, NV 89030
$-752
Cash flow
-10.3%
Cash-on-Cash Return
3.3%
Cap rate
0.4%
Rent to Value Ratio

Active
$369,000
3
bds
|
0
ba
|
1,350
sqft
|
built
1955
3213 Tabor Ave, North Las Vegas, NV 89030
$-1,038
Cash flow
-14.7%
Cash-on-Cash Return
2.3%
Cap rate
0.3%
Rent to Value Ratio

Active
$165,000
2
bds
|
2
ba
|
896
sqft
|
built
1982
3508 Rio Robles Dr, North Las Vegas, NV 89030
$-257
Cash flow
-8.1%
Cash-on-Cash Return
3.8%
Cap rate
0.6%
Rent to Value Ratio

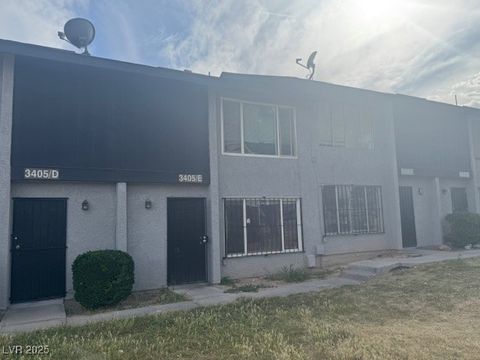
Active
$175,000
2
bds
|
2
ba
|
936
sqft
|
built
1983
3417 Civic Center Dr, North Las Vegas, NV 89030
$-39
Cash flow
-1.2%
Cash-on-Cash Return
5.4%
Cap rate
0.8%
Rent to Value Ratio

Active
$248,000
3
bds
|
2
ba
|
1,235
sqft
|
built
1971
3535 Mercury St, North Las Vegas, NV 89030
$-295
Cash flow
-6.2%
Cash-on-Cash Return
4.3%
Cap rate
0.6%
Rent to Value Ratio