89032 Investment Properties for Sale
Browse homes for sale and investment properties in 89032. Refine your search by price, property type, or more.
Best cash flowing properties in 89032
Active
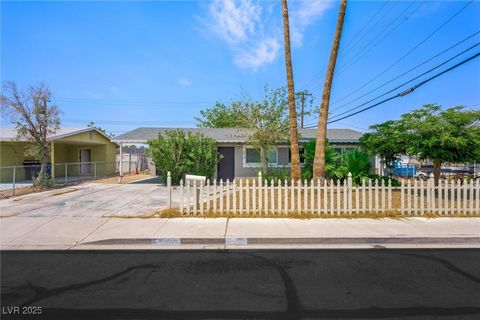
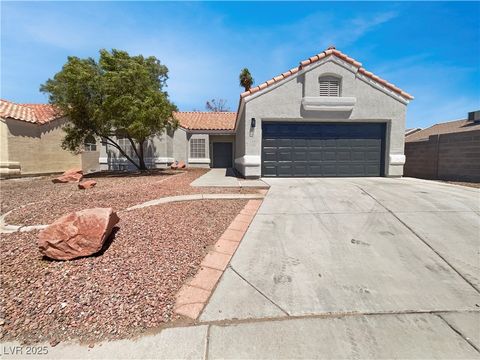
$187,000
2
bds
|
2
ba
|
1,151
sqft
|
built
1999
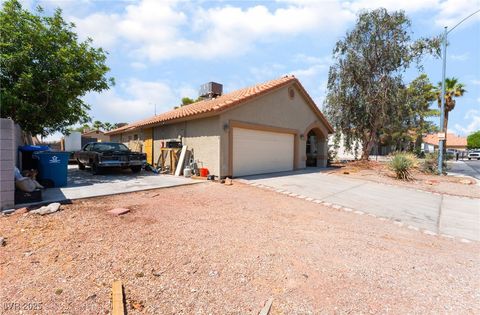
1881 W Alexander Rd, North Las Vegas, NV 89032
$-261
Cash flow
-7.3%
Cash-on-Cash Return
4.0%
Cap rate
0.7%
Rent to Value Ratio
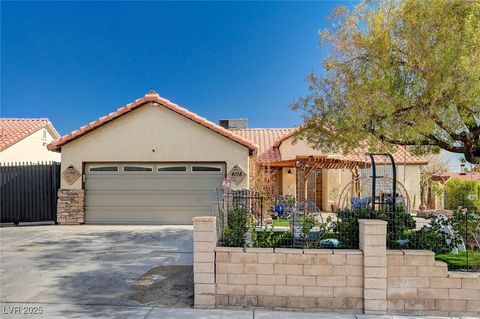
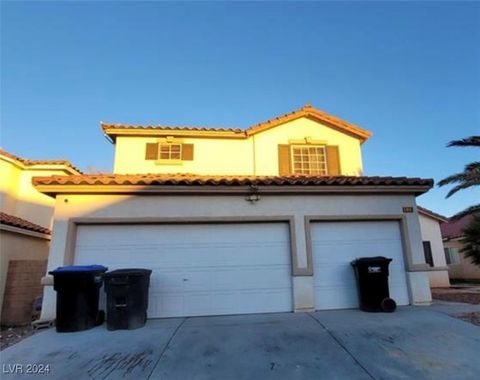
Active
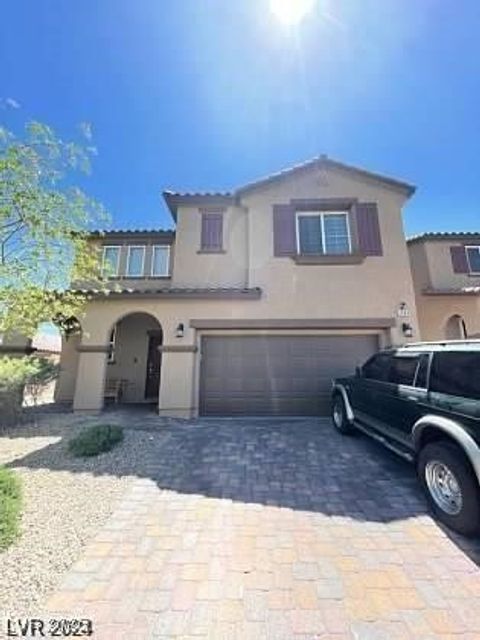
$430,000
3
bds
|
2
ba
|
1,649
sqft
|
built
1992
4108 Dove Creek Rd, North Las Vegas, NV 89032
$-409
Cash flow
-5.0%
Cash-on-Cash Return
4.5%
Cap rate
0.6%
Rent to Value Ratio
75 out of 77 properties for sale in 89032
Limited Results Shown
Create a free account, or log in to reveal all property listings and enjoy the complete experience.
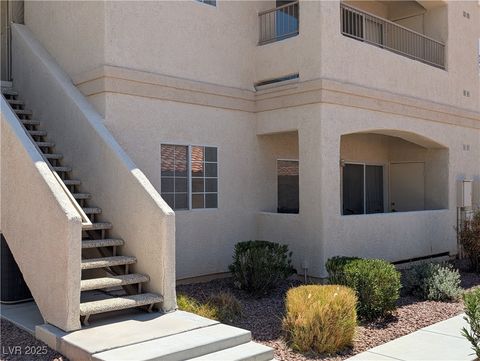
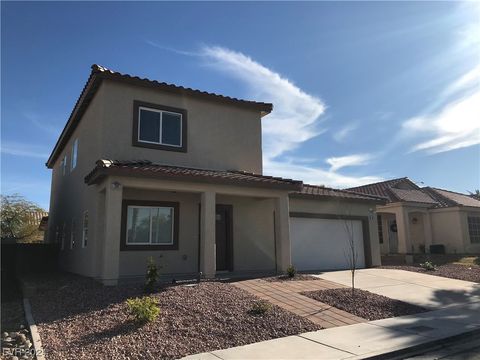
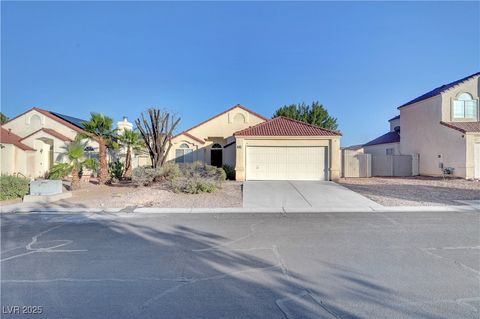
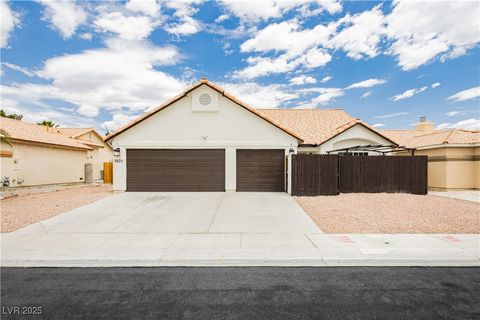
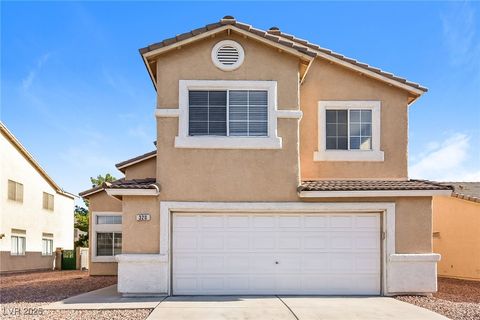
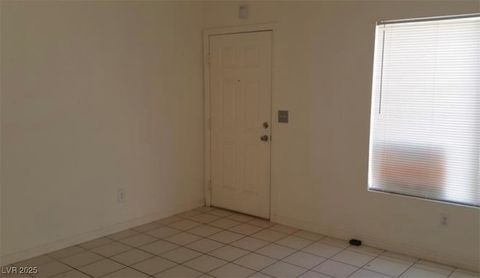
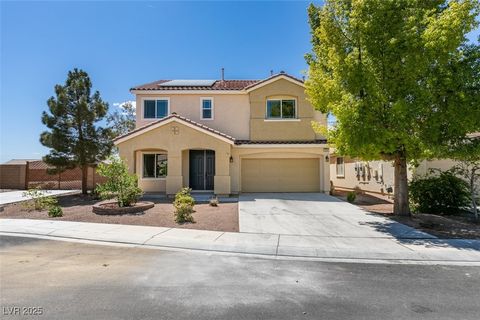
Active
$360,000
3
bds
|
3
ba
|
1,597
sqft
|
built
2010
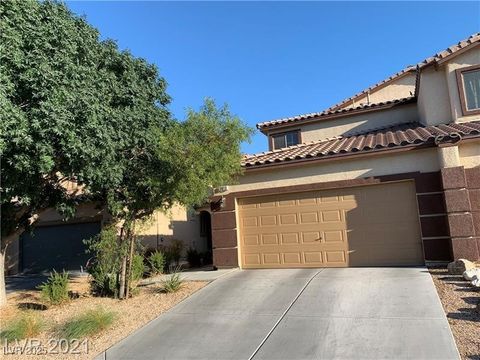
3784 Nerine Pass Way, North Las Vegas, NV 89032
$-660
Cash flow
-9.6%
Cash-on-Cash Return
3.5%
Cap rate
0.5%
Rent to Value Ratio
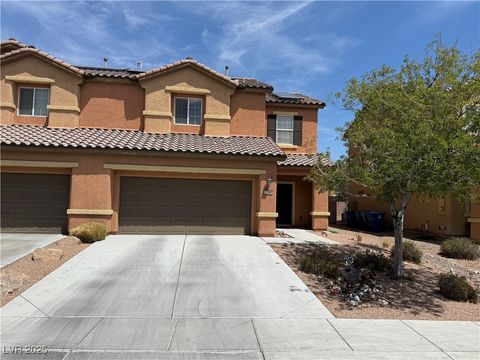
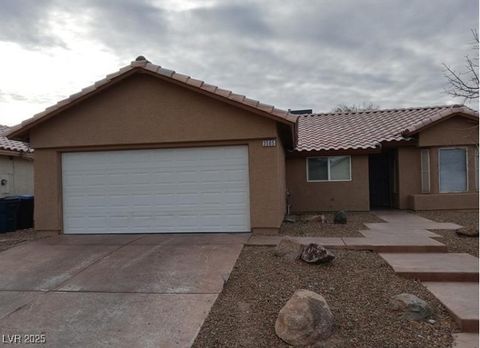
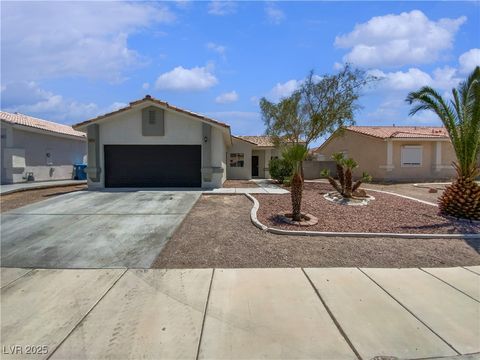
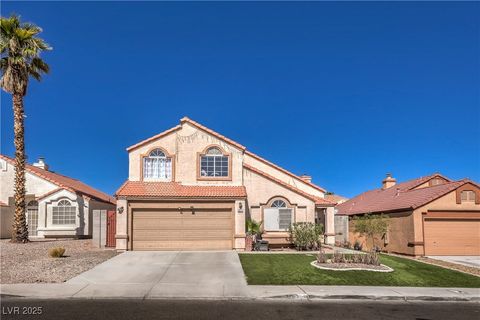
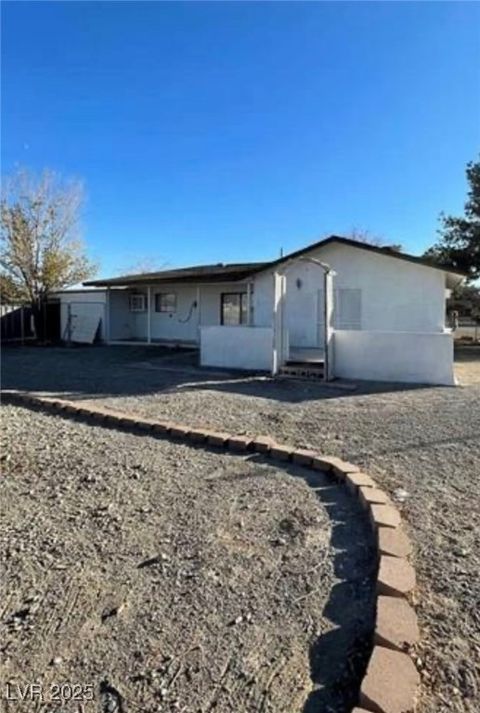
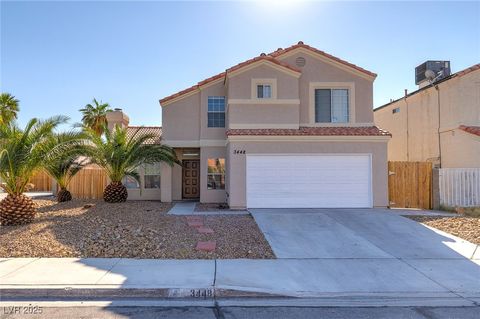
Active
$465,000
4
bds
|
3
ba
|
2,707
sqft
|
built
2007
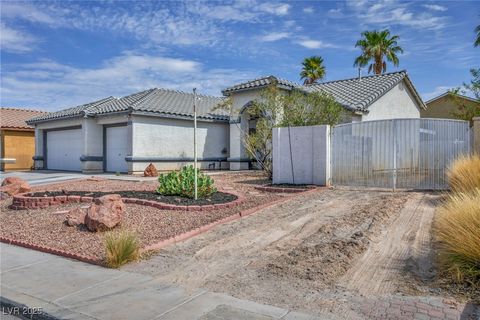
3941 Copper Stone Ct, North Las Vegas, NV 89032
$-713
Cash flow
-8.0%
Cash-on-Cash Return
3.8%
Cap rate
0.5%
Rent to Value Ratio
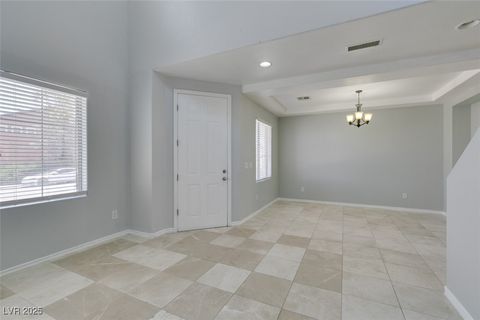
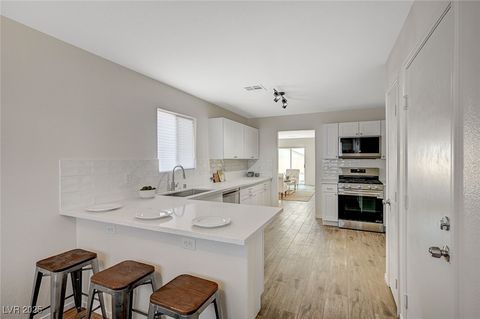
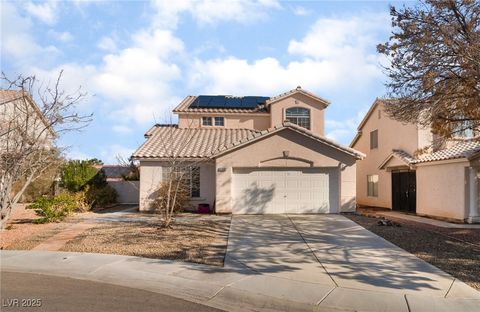
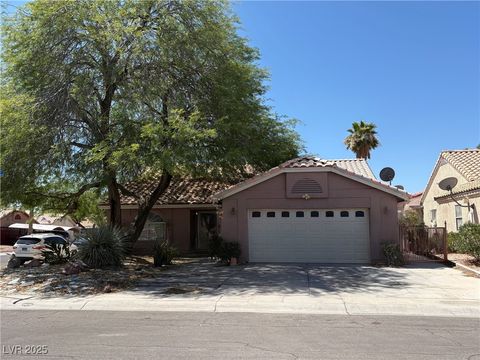
Active
$547,900
4
bds
|
3
ba
|
2,297
sqft
|
built
2020
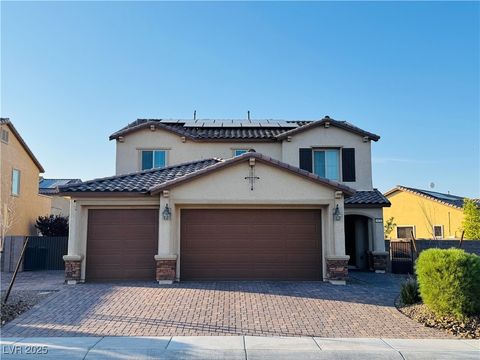
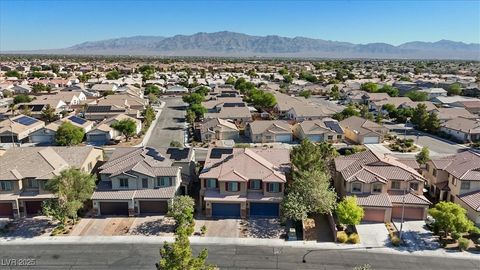
3644 Quail Creek Dr, North Las Vegas, NV 89032
$-1,198
Cash flow
-11.4%
Cash-on-Cash Return
3.1%
Cap rate
0.5%
Rent to Value Ratio
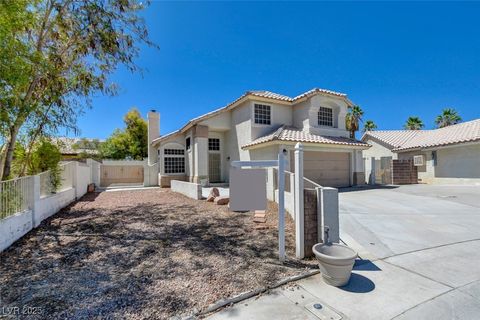
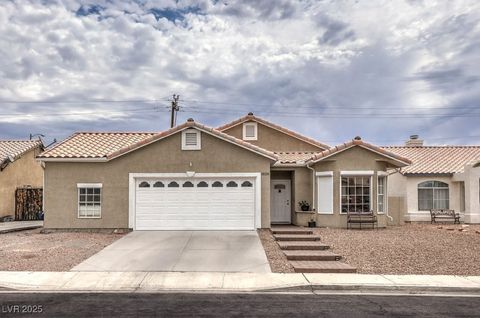
Active
$549,900
5
bds
|
4
ba
|
3,247
sqft
|
built
2006
1209 Equator Ave, North Las Vegas, NV 89032
$-1,595
Cash flow
-15.1%
Cash-on-Cash Return
2.2%
Cap rate
0.5%
Rent to Value Ratio
Active
$525,000
4
bds
|
3
ba
|
1,967
sqft
|
built
1999
3825 Manhattan Bridge Pl, North Las Vegas, NV 89032
$-966
Cash flow
-9.6%
Cash-on-Cash Return
3.5%
Cap rate
0.5%
Rent to Value Ratio
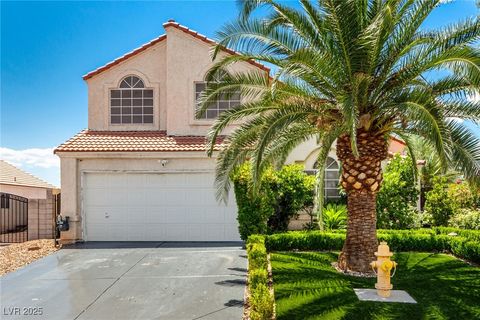
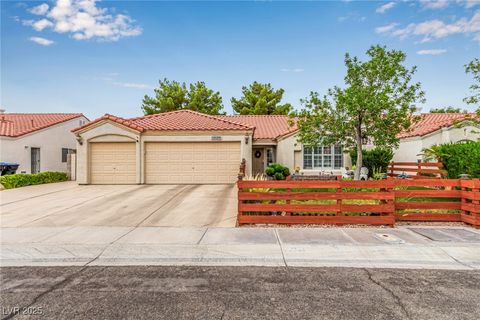
Active
$340,000
3
bds
|
3
ba
|
1,744
sqft
|
built
2007
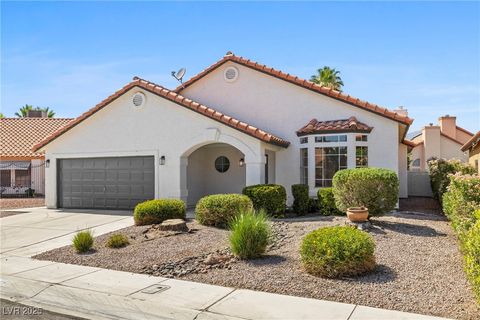
728 Twilight Blue Ave, North Las Vegas, NV 89032
$-438
Cash flow
-6.7%
Cash-on-Cash Return
4.1%
Cap rate
0.6%
Rent to Value Ratio
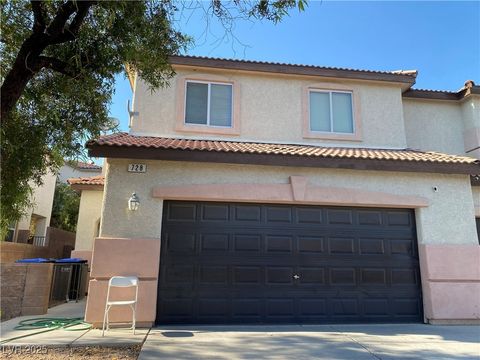
Active
$393,000
3
bds
|
2
ba
|
1,459
sqft
|
built
1999
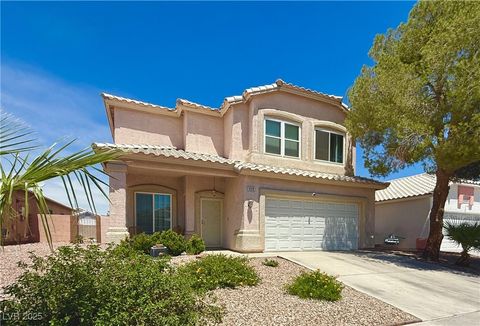
628 Bay Bridge Dr, North Las Vegas, NV 89032
$-709
Cash flow
-9.4%
Cash-on-Cash Return
3.5%
Cap rate
0.5%
Rent to Value Ratio
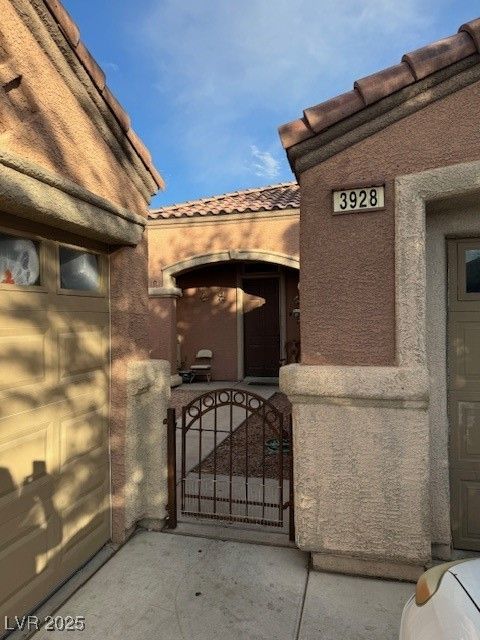
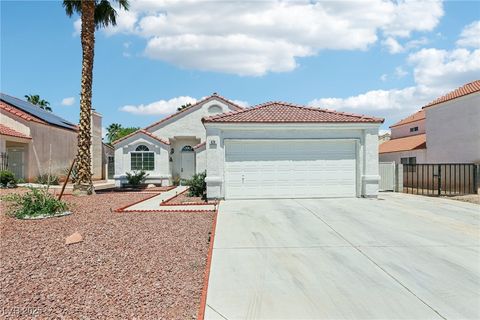
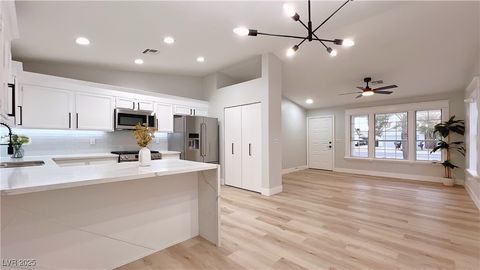
Active
$425,000
4
bds
|
2
ba
|
1,928
sqft
|
built
2007
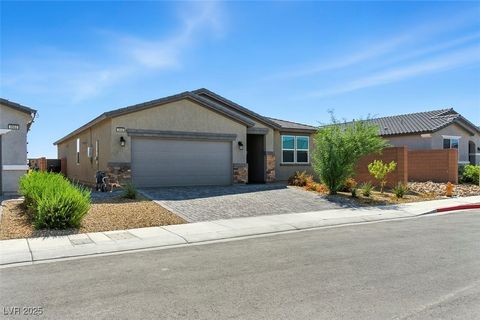
3928 Ropers Ranch St, North Las Vegas, NV 89032
$-832
Cash flow
-10.2%
Cash-on-Cash Return
3.3%
Cap rate
0.5%
Rent to Value Ratio
Active
$420,000
3
bds
|
2
ba
|
1,247
sqft
|
built
1992
4524 Denali Ave, North Las Vegas, NV 89032
$-875
Cash flow
-10.9%
Cash-on-Cash Return
3.2%
Cap rate
0.4%
Rent to Value Ratio
Active
$560,000
5
bds
|
3
ba
|
2,944
sqft
|
built
2022
1175 Willow Berry Ave, North Las Vegas, NV 89032
$-1,307
Cash flow
-12.2%
Cash-on-Cash Return
2.9%
Cap rate
0.5%
Rent to Value Ratio
Active
$375,000
4
bds
|
2
ba
|
1,071
sqft
|
built
1963
1904 Hart Ave, North Las Vegas, NV 89032
$-750
Cash flow
-10.4%
Cash-on-Cash Return
3.3%
Cap rate
0.5%
Rent to Value Ratio
Active
$559,900
4
bds
|
3
ba
|
2,354
sqft
|
built
2003
4116 Mattray St, North Las Vegas, NV 89032
$-1,488
Cash flow
-13.9%
Cash-on-Cash Return
2.5%
Cap rate
0.4%
Rent to Value Ratio
Active
$385,000
3
bds
|
2
ba
|
1,459
sqft
|
built
1999
641 Bay Bridge Dr, North Las Vegas, NV 89032
$-771
Cash flow
-10.4%
Cash-on-Cash Return
3.3%
Cap rate
0.5%
Rent to Value Ratio
Active
$479,900
3
bds
|
2
ba
|
1,208
sqft
|
built
1995
3505 Benson Ln, North Las Vegas, NV 89032
$-1,116
Cash flow
-12.1%
Cash-on-Cash Return
2.9%
Cap rate
0.4%
Rent to Value Ratio
Active
$438,000
3
bds
|
2
ba
|
1,972
sqft
|
built
1994
3630 Daisy Field Dr, North Las Vegas, NV 89032
$-733
Cash flow
-8.7%
Cash-on-Cash Return
3.7%
Cap rate
0.5%
Rent to Value Ratio
Active
$409,000
4
bds
|
2
ba
|
1,560
sqft
|
built
2000
3109 W Colton Ave, North Las Vegas, NV 89032
$-676
Cash flow
-8.6%
Cash-on-Cash Return
3.7%
Cap rate
0.5%
Rent to Value Ratio
Active
$400,000
4
bds
|
2
ba
|
1,576
sqft
|
built
2000
1911 Ona Marie Ave, North Las Vegas, NV 89032
$-631
Cash flow
-8.2%
Cash-on-Cash Return
3.8%
Cap rate
0.5%
Rent to Value Ratio
Active
$405,000
4
bds
|
3
ba
|
1,740
sqft
|
built
1992
2209 Farmouth Cir, North Las Vegas, NV 89032
$-657
Cash flow
-8.5%
Cash-on-Cash Return
3.7%
Cap rate
0.5%
Rent to Value Ratio
Active
$418,000
3
bds
|
3
ba
|
1,834
sqft
|
built
2003
320 Gray Robin Ave, North Las Vegas, NV 89032
$-576
Cash flow
-7.2%
Cash-on-Cash Return
4.0%
Cap rate
0.6%
Rent to Value Ratio
Active
$404,999
3
bds
|
3
ba
|
1,967
sqft
|
built
1997
3511 Citruscedar Way, North Las Vegas, NV 89032
$-639
Cash flow
-8.2%
Cash-on-Cash Return
3.8%
Cap rate
0.5%
Rent to Value Ratio
Active
$524,999
3
bds
|
2
ba
|
1,618
sqft
|
built
1994
3938 Redfield Ave, North Las Vegas, NV 89032
$-1,233
Cash flow
-12.3%
Cash-on-Cash Return
2.9%
Cap rate
0.4%
Rent to Value Ratio
Active
$446,400
4
bds
|
3
ba
|
2,108
sqft
|
built
1996
4542 Silver Bit Ct, North Las Vegas, NV 89032
$-661
Cash flow
-7.7%
Cash-on-Cash Return
3.9%
Cap rate
0.5%
Rent to Value Ratio
Active
$639,999
4
bds
|
4
ba
|
3,029
sqft
|
built
2019
4076 Topaz Hills Dr, North Las Vegas, NV 89032
$-1,552
Cash flow
-12.7%
Cash-on-Cash Return
2.8%
Cap rate
0.4%
Rent to Value Ratio
Active
$442,000
3
bds
|
2
ba
|
1,851
sqft
|
built
1990
4324 Peaceful Path Ct, North Las Vegas, NV 89032
$-851
Cash flow
-10.0%
Cash-on-Cash Return
3.4%
Cap rate
0.5%
Rent to Value Ratio
Active
$469,999
5
bds
|
3
ba
|
2,321
sqft
|
built
1995
1608 Knoll Heights Ct, North Las Vegas, NV 89032
$-869
Cash flow
-9.6%
Cash-on-Cash Return
3.5%
Cap rate
0.5%
Rent to Value Ratio
Active
$540,000
4
bds
|
3
ba
|
2,021
sqft
|
built
2022
3548 Valley Lily St, North Las Vegas, NV 89032
$-1,494
Cash flow
-14.4%
Cash-on-Cash Return
2.4%
Cap rate
0.4%
Rent to Value Ratio
Active
$413,000
3
bds
|
2
ba
|
1,532
sqft
|
built
1994
3804 Wren Ct, North Las Vegas, NV 89032
$-791
Cash flow
-10.0%
Cash-on-Cash Return
3.4%
Cap rate
0.5%
Rent to Value Ratio
Active
$599,900
5
bds
|
3
ba
|
2,977
sqft
|
built
2017
2409 W Gilmore Ave, North Las Vegas, NV 89032
$-1,301
Cash flow
-11.3%
Cash-on-Cash Return
3.1%
Cap rate
0.5%
Rent to Value Ratio
Active
$429,900
3
bds
|
2
ba
|
1,527
sqft
|
built
1997
33 Newburg Ave, North Las Vegas, NV 89032
$-1,001
Cash flow
-12.1%
Cash-on-Cash Return
2.9%
Cap rate
0.4%
Rent to Value Ratio
Active
$689,900
3
bds
|
2
ba
|
2,521
sqft
|
built
1986
4508 W San Miguel Ave, North Las Vegas, NV 89032
$-2,433
Cash flow
-18.4%
Cash-on-Cash Return
1.4%
Cap rate
0.2%
Rent to Value Ratio
Active
$489,000
3
bds
|
3
ba
|
2,480
sqft
|
built
2008
3809 Alpine Track Ave, North Las Vegas, NV 89032
$-936
Cash flow
-10.0%
Cash-on-Cash Return
3.4%
Cap rate
0.5%
Rent to Value Ratio
Active
$385,000
3
bds
|
3
ba
|
1,497
sqft
|
built
1993
3448 Oberon Ln, North Las Vegas, NV 89032
$-553
Cash flow
-7.5%
Cash-on-Cash Return
4.0%
Cap rate
0.5%
Rent to Value Ratio
Active
$449,999
3
bds
|
2
ba
|
1,785
sqft
|
built
1994
2305 Lone Ridge Ct, North Las Vegas, NV 89032
$-958
Cash flow
-11.1%
Cash-on-Cash Return
3.1%
Cap rate
0.4%
Rent to Value Ratio
Active
$365,000
3
bds
|
3
ba
|
1,406
sqft
|
built
1994
3528 Silver Lantern Dr, North Las Vegas, NV 89032
$-596
Cash flow
-8.5%
Cash-on-Cash Return
3.7%
Cap rate
0.5%
Rent to Value Ratio
Active
$438,000
3
bds
|
2
ba
|
1,851
sqft
|
built
1990
4335 Twin Peaks Dr, North Las Vegas, NV 89032
$-703
Cash flow
-8.4%
Cash-on-Cash Return
3.8%
Cap rate
0.5%
Rent to Value Ratio
Active
$360,000
3
bds
|
3
ba
|
1,653
sqft
|
built
2008
3813 Juanita May Ave, North Las Vegas, NV 89032
$-676
Cash flow
-9.8%
Cash-on-Cash Return
3.4%
Cap rate
0.5%
Rent to Value Ratio
Active
$379,500
3
bds
|
2
ba
|
1,767
sqft
|
built
1997
3810 Scotsman Way, North Las Vegas, NV 89032
$-562
Cash flow
-7.7%
Cash-on-Cash Return
3.9%
Cap rate
0.5%
Rent to Value Ratio
Active
$395,000
3
bds
|
3
ba
|
1,979
sqft
|
built
2019
3916 Thomas Patrick Ave, North Las Vegas, NV 89032
$-827
Cash flow
-10.9%
Cash-on-Cash Return
3.2%
Cap rate
0.5%
Rent to Value Ratio