90805 Investment Properties for Sale
Browse homes for sale and investment properties in 90805. Refine your search by price, property type, or more.
Best cash flowing properties in 90805
Active
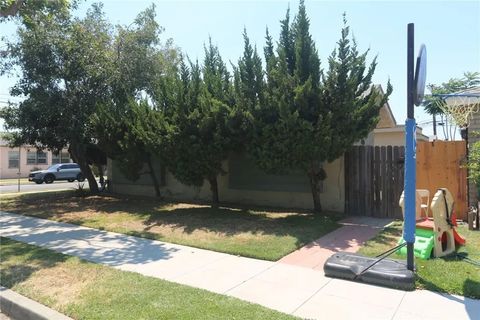
$640,000
2
bds
|
1
ba
|
868
sqft
|
built
1946
5943 Gardenia Ave, Long Beach, CA 90805
$-1,097
Cash flow
-8.9%
Cash-on-Cash Return
4.0%
Cap rate
0.5%
Rent to Value Ratio
Active
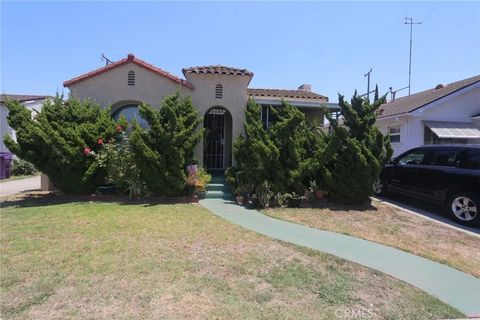
$699,000
3
bds
|
2
ba
|
1,101
sqft
|
built
1928
1501 E 63rd St, Long Beach, CA 90805
$-1,120
Cash flow
-8.4%
Cash-on-Cash Return
4.1%
Cap rate
0.5%
Rent to Value Ratio
15 out of 37 properties for sale in 90805
Limited Results Shown
Create a free account, or log in to reveal all property listings and enjoy the complete experience.
Active
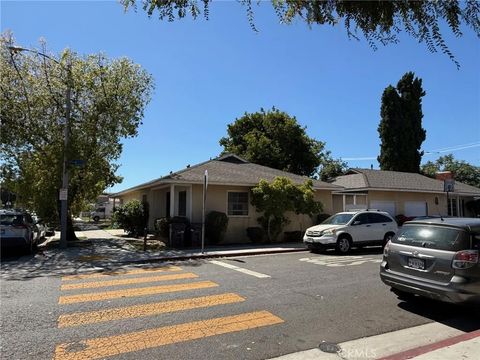
$900,000
2
bds
|
1
ba
|
0
sqft
|
built
1946
5846 Gardenia Ave, Long Beach, CA 90805
$-2,619
Cash flow
-15.2%
Cash-on-Cash Return
2.6%
Cap rate
0.3%
Rent to Value Ratio
Active
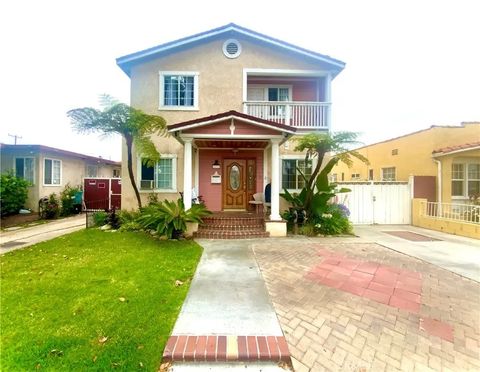
$650,000
2
bds
|
2
ba
|
0
sqft
|
built
1953
6576 California Ave, Long Beach, CA 90805
$-1,493
Cash flow
-12.0%
Cash-on-Cash Return
3.3%
Cap rate
0.4%
Rent to Value Ratio
Active
$1,099,000
7
bds
|
4
ba
|
0
sqft
|
built
1971
6001 California Ave, Long Beach, CA 90805
$-3,418
Cash flow
-16.2%
Cash-on-Cash Return
2.3%
Cap rate
0.3%
Rent to Value Ratio
Active
$735,000
2
bds
|
1
ba
|
996
sqft
|
built
1929
6072 Myrtle Ave, Long Beach, CA 90805
$-1,509
Cash flow
-10.7%
Cash-on-Cash Return
3.6%
Cap rate
0.4%
Rent to Value Ratio
Active
$1,290,000
6
bds
|
3
ba
|
0
sqft
|
built
1953
5355 Pine Ave, Long Beach, CA 90805
$-4,591
Cash flow
-18.6%
Cash-on-Cash Return
1.8%
Cap rate
0.2%
Rent to Value Ratio
Active
$999,900
5
bds
|
3
ba
|
0
sqft
|
built
1927
5636 California Ave, Long Beach, CA 90805
$-3,124
Cash flow
-16.3%
Cash-on-Cash Return
2.3%
Cap rate
0.3%
Rent to Value Ratio
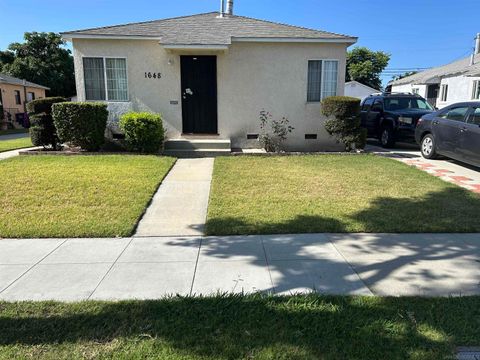
Active
$895,000
4
bds
|
3
ba
|
0
sqft
|
built
1943
1648 E Plymouth St, Long Beach, CA 90805
$-2,594
Cash flow
-15.1%
Cash-on-Cash Return
2.6%
Cap rate
0.3%
Rent to Value Ratio
Active
$1,499,995
9
bds
|
5
ba
|
0
sqft
|
built
1965
489 E 55th St, Long Beach, CA 90805
$-5,584
Cash flow
-19.4%
Cash-on-Cash Return
1.6%
Cap rate
0.2%
Rent to Value Ratio
Active
$868,000
4
bds
|
2
ba
|
1,558
sqft
|
built
1925
5444 Lime Ave, Long Beach, CA 90805
$-2,388
Cash flow
-14.4%
Cash-on-Cash Return
2.8%
Cap rate
0.3%
Rent to Value Ratio
Active
$749,000
4
bds
|
2
ba
|
0
sqft
|
built
1926
325 E 59th St, Long Beach, CA 90805
$-1,993
Cash flow
-13.9%
Cash-on-Cash Return
2.9%
Cap rate
0.3%
Rent to Value Ratio
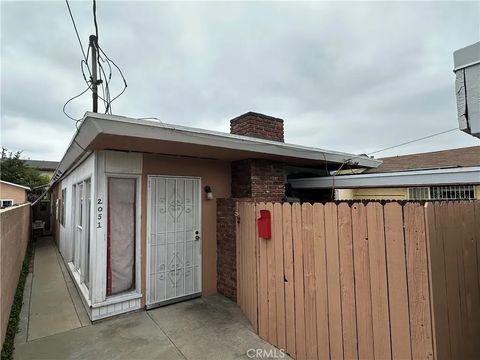
Active
$589,000
1
bds
|
1
ba
|
0
sqft
|
built
1957
2051 E Harding St, Long Beach, CA 90805
$-1,253
Cash flow
-11.1%
Cash-on-Cash Return
3.5%
Cap rate
0.4%
Rent to Value Ratio
Active
$1,150,000
7
bds
|
4
ba
|
0
sqft
|
built
1978
6140 Orange Ave, Long Beach, CA 90805
$-4,090
Cash flow
-18.6%
Cash-on-Cash Return
1.8%
Cap rate
0.2%
Rent to Value Ratio
Active
$1,169,000
7
bds
|
6
ba
|
0
sqft
|
built
1949
1921 E Washington St, Long Beach, CA 90805
$-3,772
Cash flow
-16.8%
Cash-on-Cash Return
2.2%
Cap rate
0.3%
Rent to Value Ratio