Alpharetta, GA Investment Properties for Sale
Browse homes for sale and investment properties in Alpharetta, GA. Refine your search by price, property type, or more.
Best cash flowing properties in Alpharetta, GA
Active
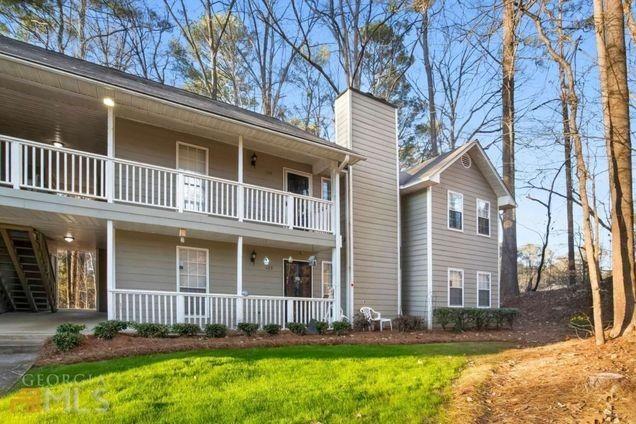
$289,000
2
bds
|
2
ba
|
1,250
sqft
|
built
1982
124 Sterling Ct, Alpharetta, GA 30004
$-589
Cash flow
-10.6%
Cash-on-Cash Return
3.7%
Cap rate
0.7%
Rent to Value Ratio
Active
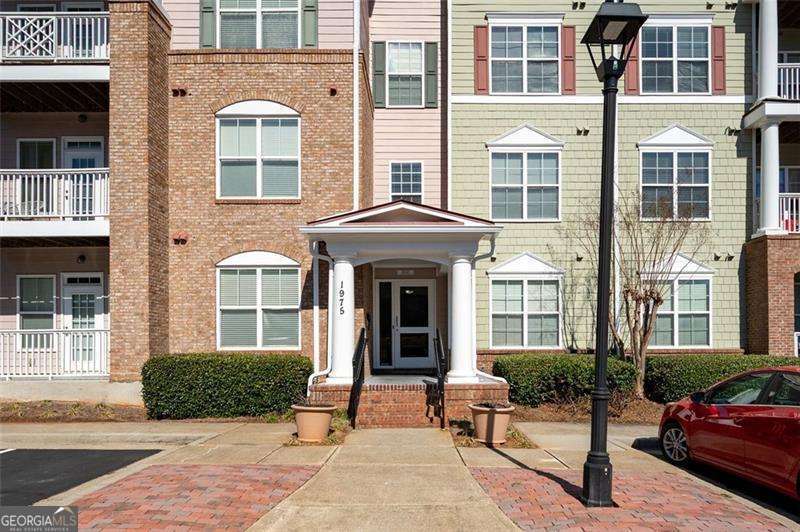
$346,000
2
bds
|
0
ba
|
1,209
sqft
|
built
2006
1975 Nocturne Dr, Alpharetta, GA 30009
$-688
Cash flow
-10.4%
Cash-on-Cash Return
3.8%
Cap rate
0.7%
Rent to Value Ratio
427 out of 477 properties for sale in Alpharetta, GA
Limited Results Shown
Create a free account, or log in to reveal all property listings and enjoy the complete experience.
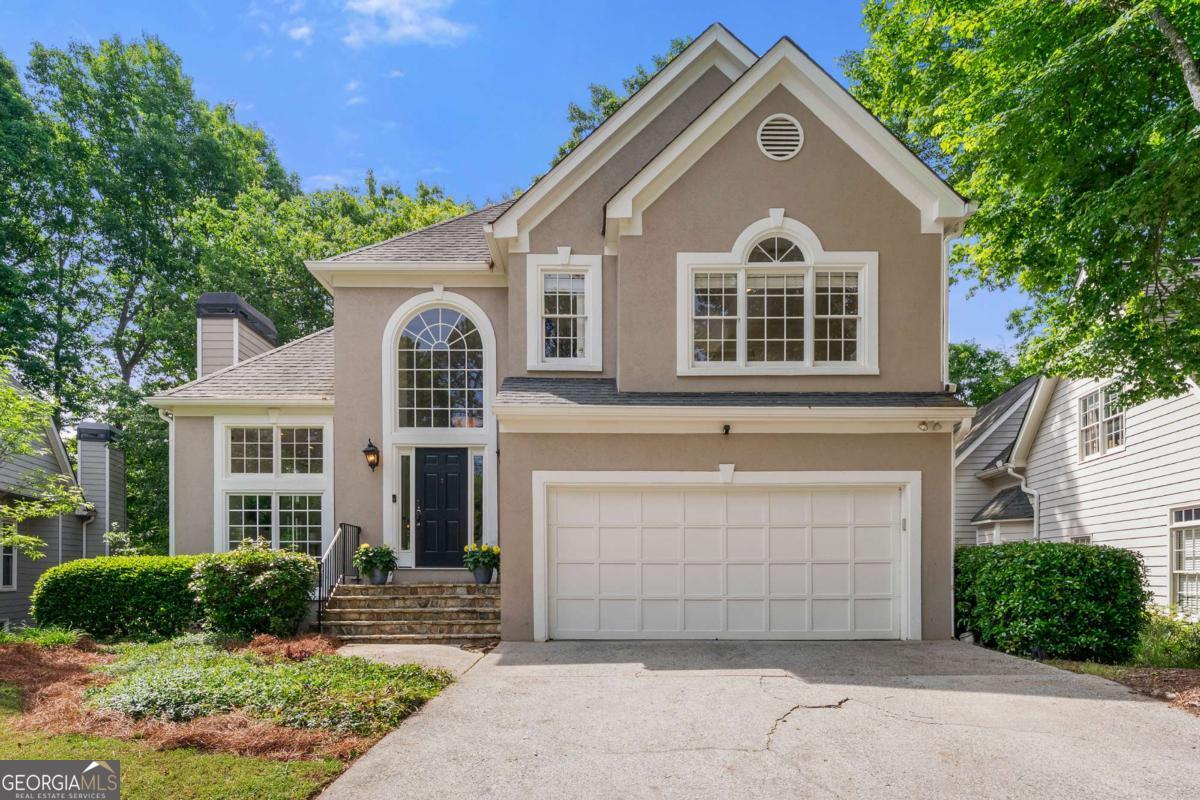
Active
$589,900
4
bds
|
0
ba
|
2,215
sqft
|
built
2018
1914 Forte Ln, Alpharetta, GA 30009
$-1,160
Cash flow
-10.3%
Cash-on-Cash Return
3.8%
Cap rate
0.6%
Rent to Value Ratio
Active
$729,990
3
bds
|
0
ba
|
2,871
sqft
|
built
1993
5065 Harbour Ridge Dr, Alpharetta, GA 30005
$-1,622
Cash flow
-11.6%
Cash-on-Cash Return
3.5%
Cap rate
0.5%
Rent to Value Ratio
Active
$915,000
5
bds
|
5
ba
|
0
sqft
|
built
1989
10000 Groomsbridge Rd, Alpharetta, GA 30022
$-2,441
Cash flow
-13.9%
Cash-on-Cash Return
2.9%
Cap rate
0.4%
Rent to Value Ratio
Active
$2,050,000
6
bds
|
0
ba
|
6,625
sqft
|
built
2018
116 Serenity Lake Dr, Alpharetta, GA 30004
$-6,385
Cash flow
-16.3%
Cash-on-Cash Return
2.4%
Cap rate
0.4%
Rent to Value Ratio
Active
$369,900
2
bds
|
0
ba
|
1,215
sqft
|
built
2004
2114 Woodland Ln, Alpharetta, GA 30009
$-999
Cash flow
-14.1%
Cash-on-Cash Return
2.9%
Cap rate
0.6%
Rent to Value Ratio
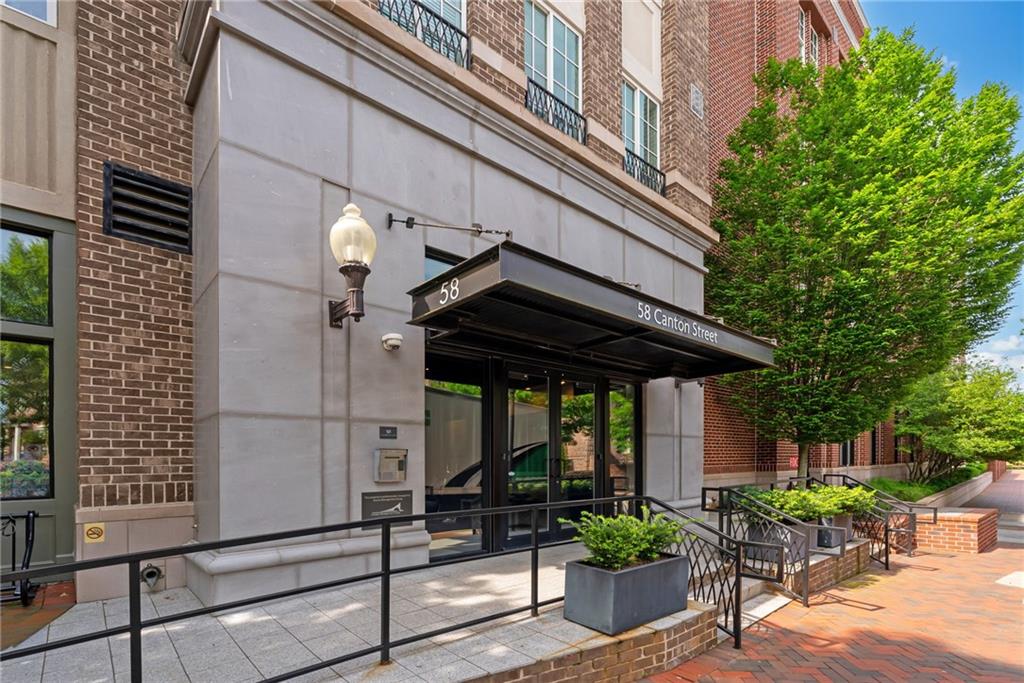
Active
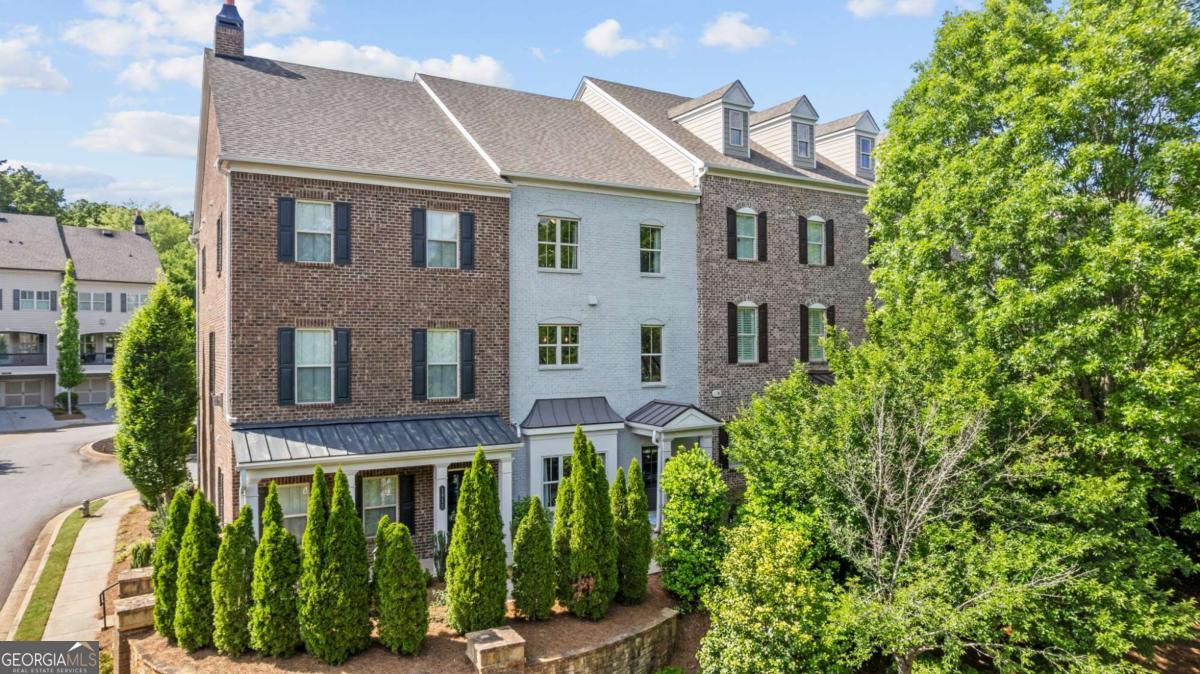
$1,199,500
3
bds
|
3
ba
|
1,975
sqft
|
built
2016
58 Canton St, Alpharetta, GA 30009
$-5,602
Cash flow
-24.4%
Cash-on-Cash Return
0.5%
Cap rate
0.3%
Rent to Value Ratio
Active
$675,000
4
bds
|
0
ba
|
3,043
sqft
|
built
1998
1360 Woodvine Way, Alpharetta, GA 30005
$-1,788
Cash flow
-13.8%
Cash-on-Cash Return
3.0%
Cap rate
0.5%
Rent to Value Ratio
Active
$2,600,000
5
bds
|
0
ba
|
4,781
sqft
|
built
1985
520 Flying Scot Way, Alpharetta, GA 30005
$-7,205
Cash flow
-14.5%
Cash-on-Cash Return
2.8%
Cap rate
0.4%
Rent to Value Ratio
Active
$2,985,000
6
bds
|
7
ba
|
5,381
sqft
|
built
2022
320 Shady Grove Ln, Alpharetta, GA 30009
$-13,449
Cash flow
-23.5%
Cash-on-Cash Return
0.7%
Cap rate
0.1%
Rent to Value Ratio
Active
$635,000
4
bds
|
0
ba
|
0
sqft
|
built
1999
1095 S Bethany Creek Dr, Alpharetta, GA 30004
$-1,793
Cash flow
-14.7%
Cash-on-Cash Return
2.8%
Cap rate
0.5%
Rent to Value Ratio
Active
$725,000
4
bds
|
0
ba
|
3,221
sqft
|
built
1986
120 N Bluff, Alpharetta, GA 30004
$-1,862
Cash flow
-13.4%
Cash-on-Cash Return
3.1%
Cap rate
0.5%
Rent to Value Ratio
Active under contract
$557,000
4
bds
|
0
ba
|
2,164
sqft
|
built
1988
6370 Maid Marion Close, Alpharetta, GA 30005
$-961
Cash flow
-9.0%
Cash-on-Cash Return
4.1%
Cap rate
0.6%
Rent to Value Ratio
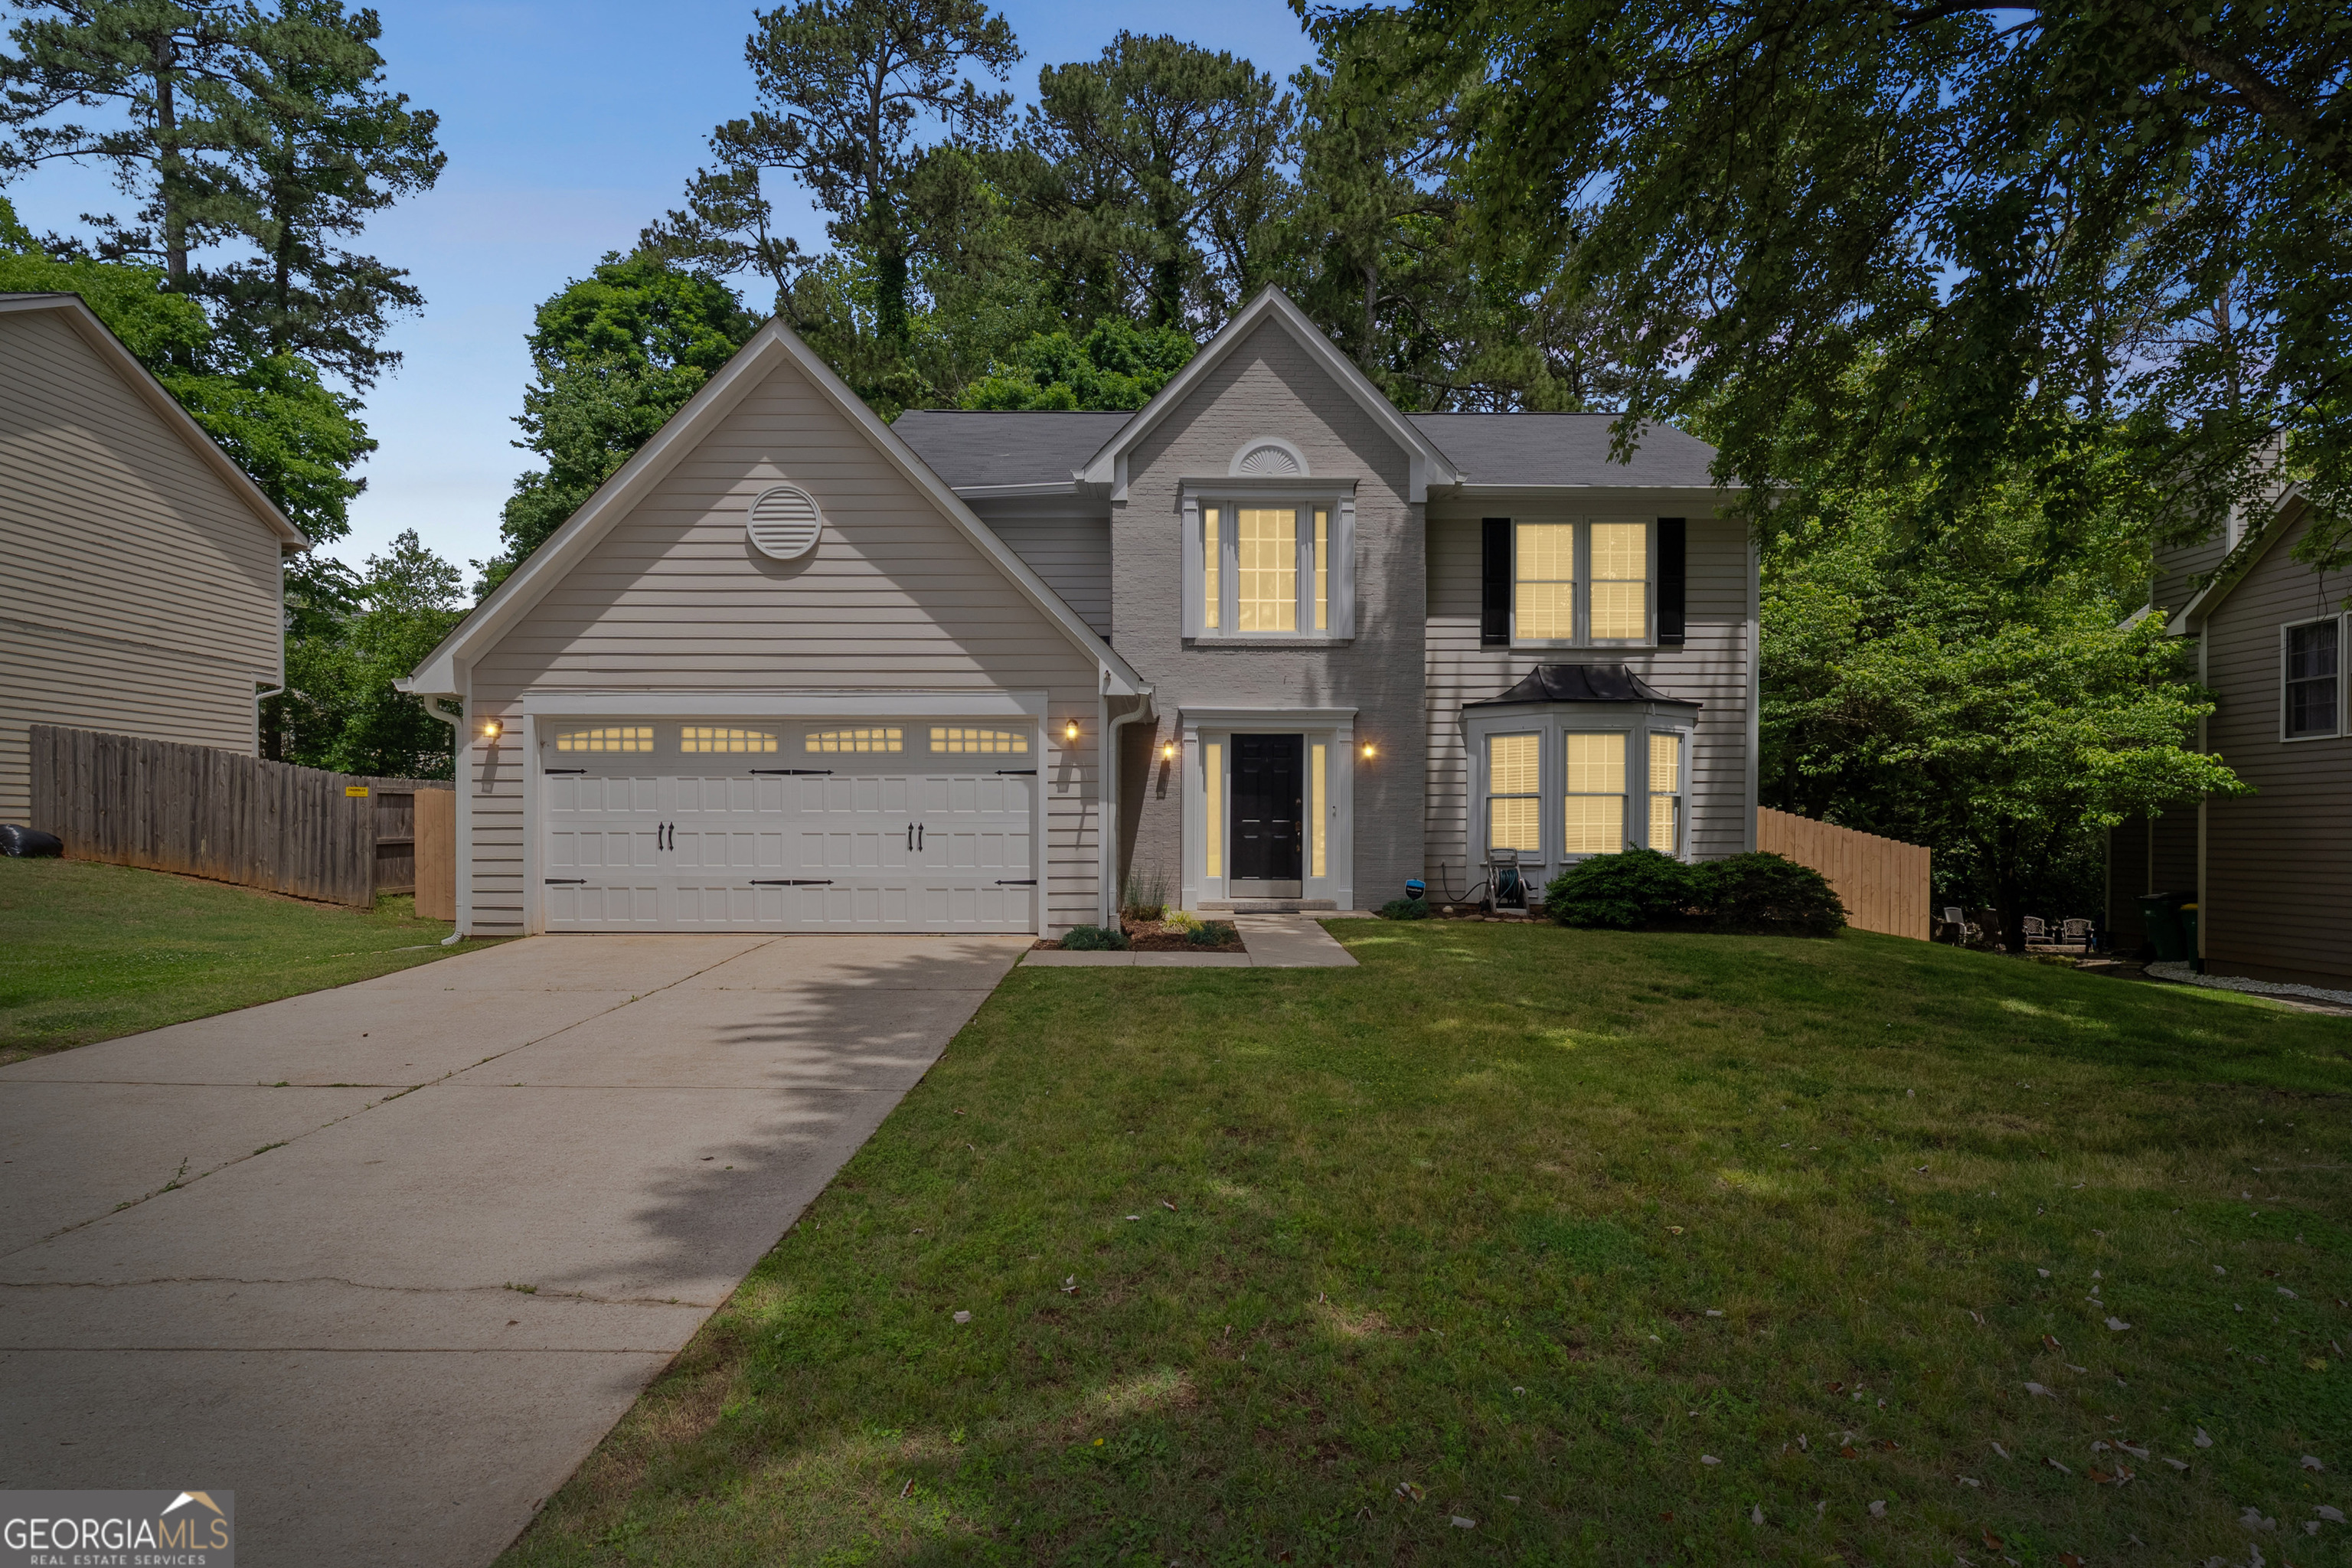
Active
$380,000
4
bds
|
0
ba
|
1,617
sqft
|
built
1999
9155 Nesbit Ferry Rd, Alpharetta, GA 30022
$-1,126
Cash flow
-15.5%
Cash-on-Cash Return
2.6%
Cap rate
0.6%
Rent to Value Ratio
Active
$1,199,500
3
bds
|
3
ba
|
0
sqft
|
built
2016
58 Canton St, Alpharetta, GA 30009
$-4,968
Cash flow
-21.6%
Cash-on-Cash Return
1.2%
Cap rate
0.3%
Rent to Value Ratio

Active
$639,000
4
bds
|
0
ba
|
2,300
sqft
|
built
2020
753 Topsail Ln, Alpharetta, GA 30005
$-1,501
Cash flow
-12.3%
Cash-on-Cash Return
3.3%
Cap rate
0.5%
Rent to Value Ratio
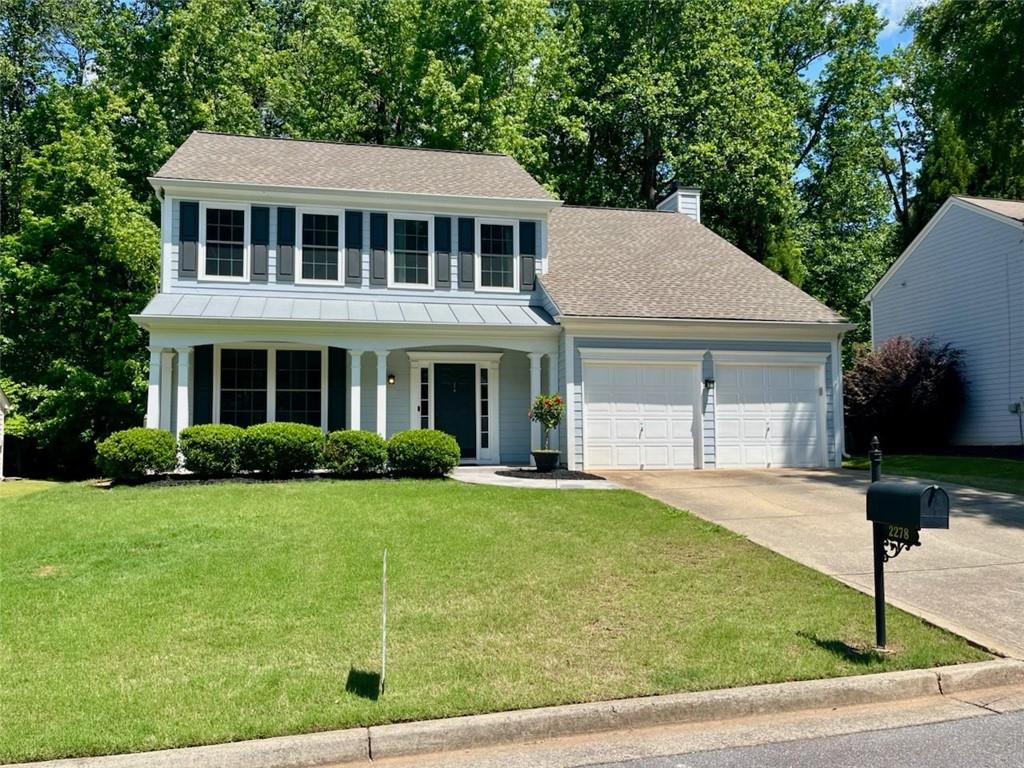
Active
$665,000
4
bds
|
2
ba
|
2,156
sqft
|
built
1997
2278 Traywick Chase, Alpharetta, GA 30004
$-1,814
Cash flow
-14.2%
Cash-on-Cash Return
2.9%
Cap rate
0.5%
Rent to Value Ratio
Active
$3,325,000
6
bds
|
0
ba
|
14,039
sqft
|
built
2004
110 Ryan Lake Trl, Alpharetta, GA 30004
$-13,643
Cash flow
-21.4%
Cash-on-Cash Return
1.2%
Cap rate
0.2%
Rent to Value Ratio
Active
$565,000
3
bds
|
0
ba
|
0
sqft
|
built
1991
5320 Taylor Rd, Alpharetta, GA 30022
$-1,262
Cash flow
-11.7%
Cash-on-Cash Return
3.5%
Cap rate
0.5%
Rent to Value Ratio
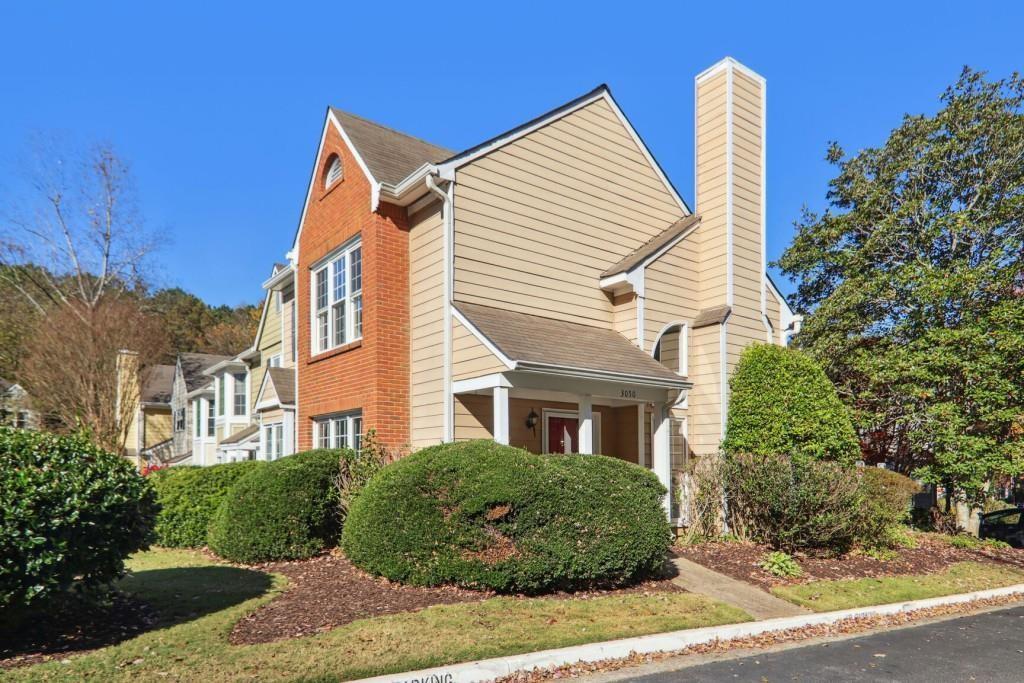
Active
$345,900
2
bds
|
2
ba
|
0
sqft
|
built
1986
3050 Camden Way, Alpharetta, GA 30005
$-955
Cash flow
-14.4%
Cash-on-Cash Return
2.8%
Cap rate
0.6%
Rent to Value Ratio
Active
$289,000
2
bds
|
2
ba
|
1,250
sqft
|
built
1982
124 Sterling Ct, Alpharetta, GA 30004
$-589
Cash flow
-10.6%
Cash-on-Cash Return
3.7%
Cap rate
0.7%
Rent to Value Ratio
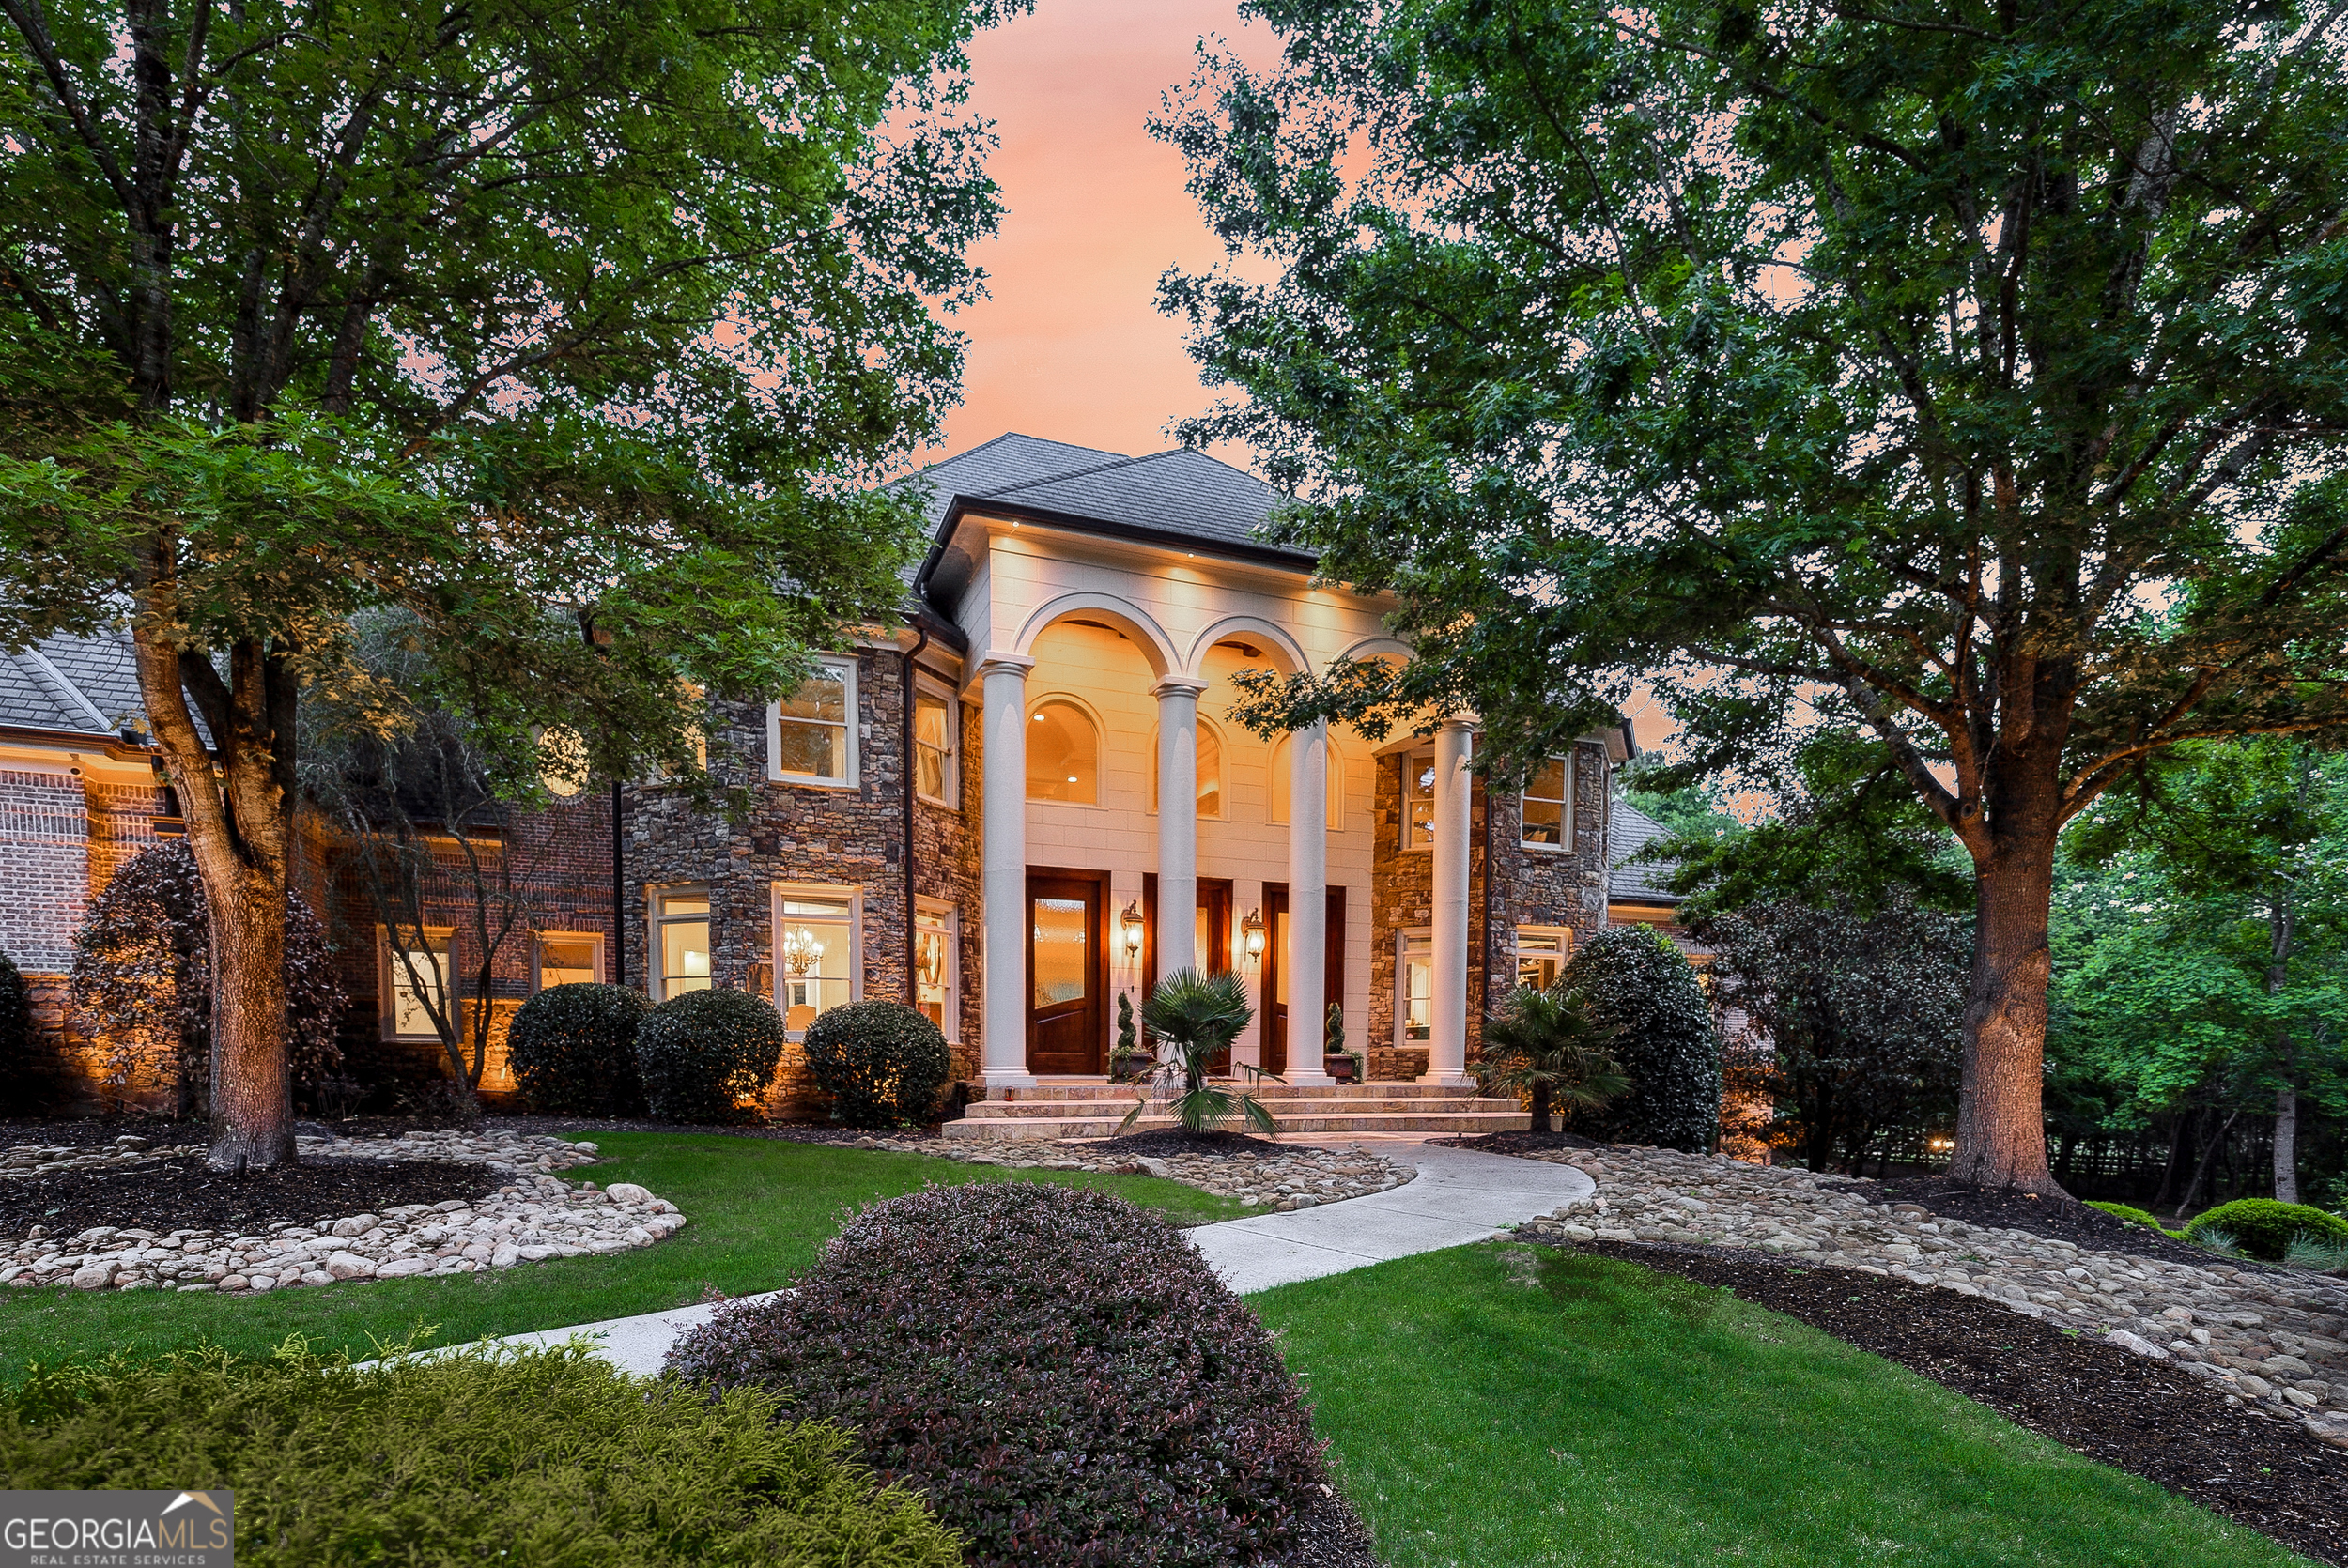
Active
$725,000
5
bds
|
4
ba
|
3,690
sqft
|
built
2008
5375 Fairmont Gln, Alpharetta, GA 30004
$-2,206
Cash flow
-15.9%
Cash-on-Cash Return
2.5%
Cap rate
0.4%
Rent to Value Ratio
Active
$875,000
5
bds
|
0
ba
|
3,012
sqft
|
built
1997
135 Stone Orchard Ct, Alpharetta, GA 30004
$-1,668
Cash flow
-9.9%
Cash-on-Cash Return
3.9%
Cap rate
0.6%
Rent to Value Ratio
Active
$949,730
4
bds
|
5
ba
|
4,398
sqft
|
built
2014
11760 Stratham Dr, Alpharetta, GA 30009
$-1,602
Cash flow
-8.8%
Cash-on-Cash Return
4.1%
Cap rate
0.6%
Rent to Value Ratio
Active
$349,000
2
bds
|
0
ba
|
0
sqft
|
built
1985
1630 Homestead Trl, Alpharetta, GA 30004
$-956
Cash flow
-14.3%
Cash-on-Cash Return
2.9%
Cap rate
0.6%
Rent to Value Ratio
Active
$1,345,000
7
bds
|
0
ba
|
7,395
sqft
|
built
2001
882 Hallbrook Ln, Alpharetta, GA 30004
$-4,088
Cash flow
-15.9%
Cash-on-Cash Return
2.5%
Cap rate
0.4%
Rent to Value Ratio
Active
$309,000
1
bds
|
2
ba
|
1,052
sqft
|
built
2006
1955 Nocturne Dr, Alpharetta, GA 30009
$-859
Cash flow
-14.5%
Cash-on-Cash Return
2.8%
Cap rate
0.6%
Rent to Value Ratio
Active under contract
$809,000
4
bds
|
0
ba
|
0
sqft
|
built
1985
5600 Surrey Ct, Alpharetta, GA 30009
$-1,733
Cash flow
-11.2%
Cash-on-Cash Return
3.6%
Cap rate
0.5%
Rent to Value Ratio
Active
$375,000
2
bds
|
0
ba
|
1,218
sqft
|
built
2000
1135 Kilmington Ct, Alpharetta, GA 30009
$-1,006
Cash flow
-14.0%
Cash-on-Cash Return
2.9%
Cap rate
0.5%
Rent to Value Ratio
Active
$1,250,000
7
bds
|
0
ba
|
5,682
sqft
|
built
1995
1008 Stream Valley Ct, Alpharetta, GA 30022
$-4,107
Cash flow
-17.1%
Cash-on-Cash Return
2.2%
Cap rate
0.4%
Rent to Value Ratio
Active
$346,000
2
bds
|
0
ba
|
1,209
sqft
|
built
2006
1975 Nocturne Dr, Alpharetta, GA 30009
$-688
Cash flow
-10.4%
Cash-on-Cash Return
3.8%
Cap rate
0.7%
Rent to Value Ratio
Active
$565,000
5
bds
|
0
ba
|
3,470
sqft
|
built
1990
215 Boca Ciega Ct, Alpharetta, GA 30022
$-882
Cash flow
-8.1%
Cash-on-Cash Return
4.3%
Cap rate
0.6%
Rent to Value Ratio
Active
$1,885,000
6
bds
|
0
ba
|
7,935
sqft
|
built
2001
8109 Lawnview, Alpharetta, GA 30022
$-6,351
Cash flow
-17.6%
Cash-on-Cash Return
2.1%
Cap rate
0.3%
Rent to Value Ratio
Active
$976,000
5
bds
|
0
ba
|
3,780
sqft
|
built
1996
4345 Park Brooke Trce, Alpharetta, GA 30022
$-2,633
Cash flow
-14.1%
Cash-on-Cash Return
2.9%
Cap rate
0.5%
Rent to Value Ratio
Active
$1,200,000
5
bds
|
0
ba
|
4,200
sqft
|
built
1999
515 Watboro Hill Dr, Alpharetta, GA 30004
$-3,172
Cash flow
-13.8%
Cash-on-Cash Return
3.0%
Cap rate
0.4%
Rent to Value Ratio
Active under contract
$1,355,000
6
bds
|
0
ba
|
5,471
sqft
|
built
1998
10410 High Falls Cir, Alpharetta, GA 30022
$-4,030
Cash flow
-15.5%
Cash-on-Cash Return
2.6%
Cap rate
0.4%
Rent to Value Ratio
Active
$775,000
4
bds
|
0
ba
|
3,158
sqft
|
built
2018
605 Lanshire Dr, Alpharetta, GA 30004
$-1,804
Cash flow
-12.1%
Cash-on-Cash Return
3.4%
Cap rate
0.5%
Rent to Value Ratio
Active
$2,849,000
7
bds
|
8
ba
|
6,702
sqft
|
built
2016
14300 Providence Rd, Alpharetta, GA 30004
$-9,079
Cash flow
-16.6%
Cash-on-Cash Return
2.3%
Cap rate
0.4%
Rent to Value Ratio
Active
$530,000
3
bds
|
0
ba
|
0
sqft
|
built
2000
715 Alstonefield Dr, Alpharetta, GA 30004
$-1,196
Cash flow
-11.8%
Cash-on-Cash Return
3.4%
Cap rate
0.5%
Rent to Value Ratio
Active
$899,900
3
bds
|
0
ba
|
0
sqft
|
built
1993
16335 Henderson Rd, Alpharetta, GA 30004
$-2,143
Cash flow
-12.4%
Cash-on-Cash Return
3.3%
Cap rate
0.5%
Rent to Value Ratio
Active
$580,000
5
bds
|
0
ba
|
2,112
sqft
|
built
1984
3480 Stillridge Dr, Alpharetta, GA 30022
$-1,026
Cash flow
-9.2%
Cash-on-Cash Return
4.0%
Cap rate
0.6%
Rent to Value Ratio