Apollo Beach, FL Investment Properties for Sale
Browse homes for sale and investment properties in Apollo Beach, FL. Refine your search by price, property type, or more.
Best cash flowing properties in Apollo Beach, FL
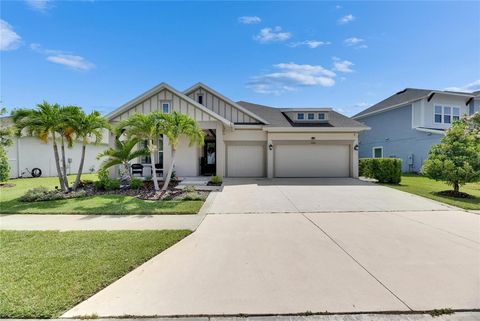
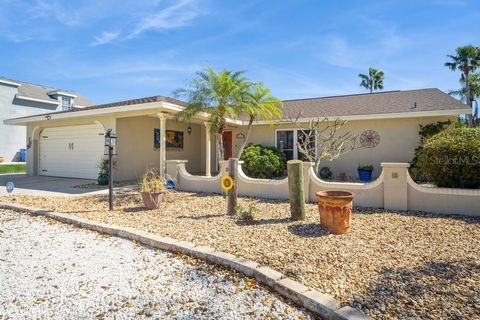
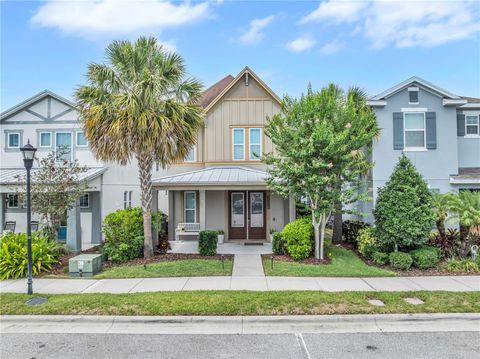
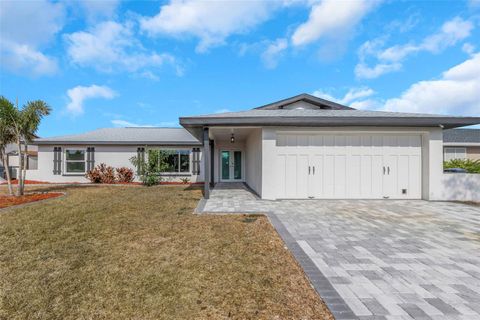
Active
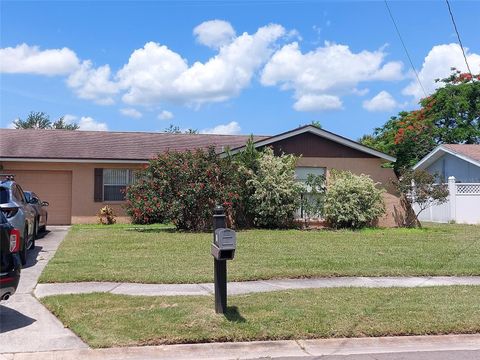
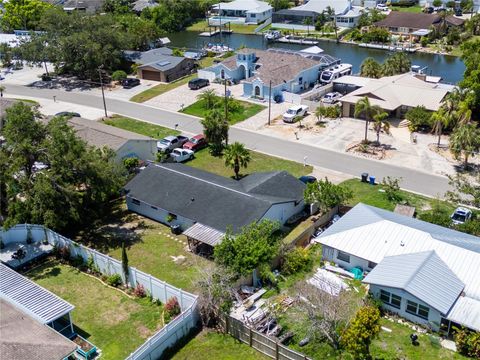
$264,900
3
bds
|
2
ba
|
1,118
sqft
|
built
1974
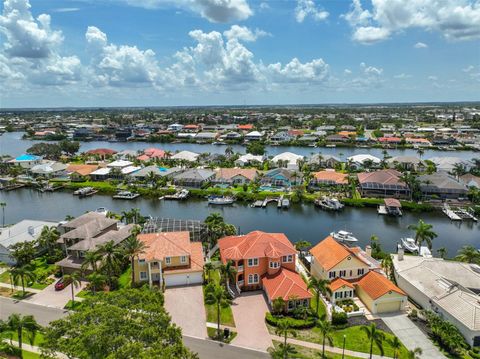
432 Flamingo Dr, Apollo Beach, FL 33572
$-57
Cash flow
-1.1%
Cash-on-Cash Return
5.9%
Cap rate
0.8%
Rent to Value Ratio
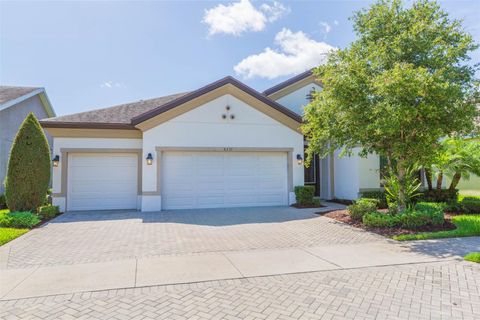
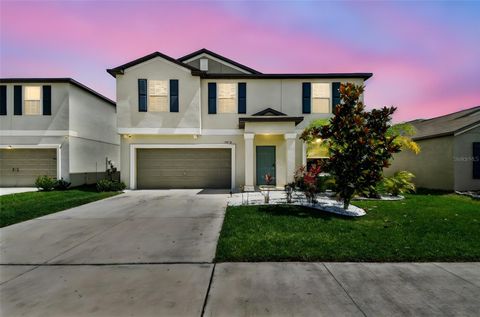
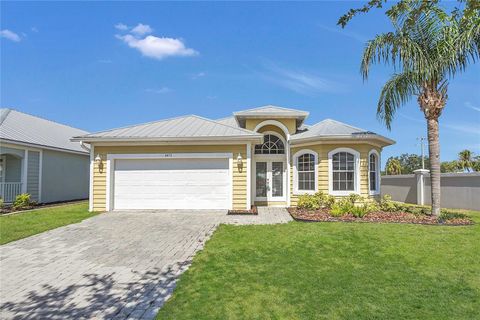
Active
$250,000
2
bds
|
1
ba
|
872
sqft
|
built
1959
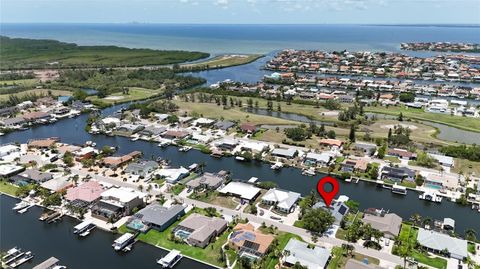
512 Flame Tree Dr, Apollo Beach, FL 33572
$-234
Cash flow
-4.9%
Cash-on-Cash Return
5.0%
Cap rate
0.7%
Rent to Value Ratio
227 out of 228 properties for sale in Apollo Beach, FL
Limited Results Shown
Create a free account, or log in to reveal all property listings and enjoy the complete experience.
Active
$549,900
4
bds
|
3
ba
|
2,058
sqft
|
built
2017
6467 Seasound Dr, Apollo Beach, FL 33572
$-1,148
Cash flow
-10.9%
Cash-on-Cash Return
3.6%
Cap rate
0.6%
Rent to Value Ratio
Active
$800,000
3
bds
|
3
ba
|
1,972
sqft
|
built
1988
835 Symphony Isles Blvd, Apollo Beach, FL 33572
$-1,816
Cash flow
-11.8%
Cash-on-Cash Return
3.4%
Cap rate
0.5%
Rent to Value Ratio
Active
$428,000
5
bds
|
3
ba
|
2,415
sqft
|
built
2020
5126 Dandelion St, Apollo Beach, FL 33572
$-725
Cash flow
-8.8%
Cash-on-Cash Return
4.1%
Cap rate
0.6%
Rent to Value Ratio
Active
$539,900
3
bds
|
3
ba
|
2,142
sqft
|
built
2023
6219 Golden Nettle Dr, Apollo Beach, FL 33572
$-1,248
Cash flow
-12.1%
Cash-on-Cash Return
3.4%
Cap rate
0.6%
Rent to Value Ratio
Active
$499,000
3
bds
|
2
ba
|
1,751
sqft
|
built
2017
6408 Seasound Dr, Apollo Beach, FL 33572
$-1,297
Cash flow
-13.6%
Cash-on-Cash Return
3.0%
Cap rate
0.6%
Rent to Value Ratio
Active
$554,900
4
bds
|
3
ba
|
2,592
sqft
|
built
2014
511 Winterside Dr, Apollo Beach, FL 33572
$-1,650
Cash flow
-15.5%
Cash-on-Cash Return
2.6%
Cap rate
0.6%
Rent to Value Ratio

Active
$2,895,000
5
bds
|
4
ba
|
4,176
sqft
|
built
2004
6418 Bright Bay Ct, Apollo Beach, FL 33572
$-10,320
Cash flow
-18.6%
Cash-on-Cash Return
1.9%
Cap rate
0.4%
Rent to Value Ratio
Active
$737,500
4
bds
|
3
ba
|
2,617
sqft
|
built
2020
7420 Paradiso Dr, Apollo Beach, FL 33572
$-1,758
Cash flow
-12.4%
Cash-on-Cash Return
3.3%
Cap rate
0.6%
Rent to Value Ratio
Active
$500,000
4
bds
|
3
ba
|
2,492
sqft
|
built
2017
6331 Voyagers Pl, Apollo Beach, FL 33572
$-1,142
Cash flow
-11.9%
Cash-on-Cash Return
3.4%
Cap rate
0.7%
Rent to Value Ratio
Active
$515,000
3
bds
|
2
ba
|
1,500
sqft
|
built
1999
318 Lookout Dr, Apollo Beach, FL 33572
$-1,246
Cash flow
-12.6%
Cash-on-Cash Return
3.2%
Cap rate
0.5%
Rent to Value Ratio
Active
$340,000
3
bds
|
2
ba
|
1,370
sqft
|
built
1980
6008 Firefly Ln, Apollo Beach, FL 33572
$-542
Cash flow
-8.3%
Cash-on-Cash Return
4.2%
Cap rate
0.6%
Rent to Value Ratio
Active
$324,000
3
bds
|
2
ba
|
1,452
sqft
|
built
1977
621 Gran Kaymen Way, Apollo Beach, FL 33572
$-675
Cash flow
-10.9%
Cash-on-Cash Return
3.6%
Cap rate
0.6%
Rent to Value Ratio
Active
$399,900
4
bds
|
3
ba
|
2,511
sqft
|
built
2004
7705 Nottinghill Sky Dr, Apollo Beach, FL 33572
$-433
Cash flow
-5.6%
Cash-on-Cash Return
4.8%
Cap rate
0.7%
Rent to Value Ratio
Active
$729,000
3
bds
|
4
ba
|
2,026
sqft
|
built
2007
6512 Simone Shores Cir, Apollo Beach, FL 33572
$-2,246
Cash flow
-16.1%
Cash-on-Cash Return
2.4%
Cap rate
0.4%
Rent to Value Ratio
Active
$524,990
4
bds
|
2
ba
|
2,694
sqft
|
built
2006
7114 Cromwell Park Ln, Apollo Beach, FL 33572
$-952
Cash flow
-9.5%
Cash-on-Cash Return
4.0%
Cap rate
0.6%
Rent to Value Ratio
Active
$614,900
3
bds
|
2
ba
|
1,770
sqft
|
built
1980
6503 Santiago Ct, Apollo Beach, FL 33572
$-1,348
Cash flow
-11.4%
Cash-on-Cash Return
3.5%
Cap rate
0.5%
Rent to Value Ratio
Active
$204,900
2
bds
|
2
ba
|
1,084
sqft
|
built
1977
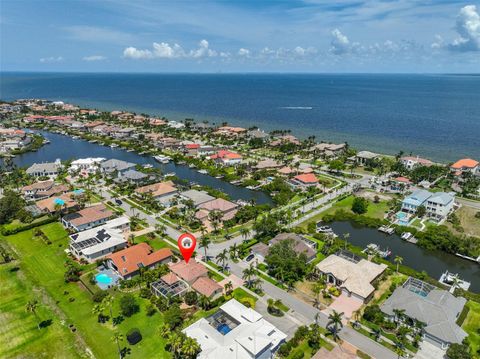
1028 Apollo Beach Blvd, Apollo Beach, FL 33572
$-502
Cash flow
-12.8%
Cash-on-Cash Return
3.2%
Cap rate
1.1%
Rent to Value Ratio

Active
$919,000
3
bds
|
2
ba
|
1,938
sqft
|
built
1985
6604 Dolphin Cove Dr, Apollo Beach, FL 33572
$-2,772
Cash flow
-15.7%
Cash-on-Cash Return
2.5%
Cap rate
0.4%
Rent to Value Ratio
Active
$665,000
4
bds
|
3
ba
|
3,519
sqft
|
built
2007
5457 Sandy Shell Dr, Apollo Beach, FL 33572
$-1,718
Cash flow
-13.5%
Cash-on-Cash Return
3.0%
Cap rate
0.5%
Rent to Value Ratio
Active
$500,000
3
bds
|
2
ba
|
1,989
sqft
|
built
2018
5102 Coastal Scene Dr, Apollo Beach, FL 33572
$-1,107
Cash flow
-11.6%
Cash-on-Cash Return
3.5%
Cap rate
0.7%
Rent to Value Ratio
Active
$1,238,000
4
bds
|
4
ba
|
3,339
sqft
|
built
2006
920 Symphony Isles Blvd, Apollo Beach, FL 33572
$-3,830
Cash flow
-16.1%
Cash-on-Cash Return
2.4%
Cap rate
0.4%
Rent to Value Ratio
Active
$854,990
4
bds
|
2
ba
|
2,190
sqft
|
built
1988
907 Golf Island Dr, Apollo Beach, FL 33572
$-2,206
Cash flow
-13.5%
Cash-on-Cash Return
3.1%
Cap rate
0.5%
Rent to Value Ratio
Active
$657,000
3
bds
|
2
ba
|
1,590
sqft
|
built
1972
1024 Spindle Palm Way, Apollo Beach, FL 33572
$-1,765
Cash flow
-14.0%
Cash-on-Cash Return
2.9%
Cap rate
0.4%
Rent to Value Ratio
Active
$829,000
4
bds
|
3
ba
|
2,968
sqft
|
built
2001
6468 Rubia Cir, Apollo Beach, FL 33572
$-1,367
Cash flow
-8.6%
Cash-on-Cash Return
4.2%
Cap rate
0.7%
Rent to Value Ratio
Active
$2,195,000
4
bds
|
5
ba
|
4,406
sqft
|
built
2007
5417 Tybee Island Dr, Apollo Beach, FL 33572
$-10,385
Cash flow
-24.7%
Cash-on-Cash Return
0.5%
Cap rate
0.3%
Rent to Value Ratio
Active
$450,000
4
bds
|
3
ba
|
2,115
sqft
|
built
2020
6118 Voyagers Pl, Apollo Beach, FL 33572
$-815
Cash flow
-9.4%
Cash-on-Cash Return
4.0%
Cap rate
0.7%
Rent to Value Ratio
Active
$343,900
3
bds
|
2
ba
|
1,797
sqft
|
built
2014
610 Winterside Dr, Apollo Beach, FL 33572
$-671
Cash flow
-10.2%
Cash-on-Cash Return
3.8%
Cap rate
0.8%
Rent to Value Ratio
Active
$570,000
4
bds
|
3
ba
|
2,563
sqft
|
built
2013
347 Cockle Shell Loop, Apollo Beach, FL 33572
$-1,416
Cash flow
-13.0%
Cash-on-Cash Return
3.2%
Cap rate
0.5%
Rent to Value Ratio
Active
$425,000
3
bds
|
3
ba
|
2,278
sqft
|
built
2014
7238 Milestone Dr, Apollo Beach, FL 33572
$-740
Cash flow
-9.1%
Cash-on-Cash Return
4.1%
Cap rate
0.7%
Rent to Value Ratio
Active
$379,900
4
bds
|
3
ba
|
2,635
sqft
|
built
2022
5410 Amaryllis Garden St, Apollo Beach, FL 33572
$-786
Cash flow
-10.8%
Cash-on-Cash Return
3.7%
Cap rate
0.7%
Rent to Value Ratio
Active
$1,250,000
3
bds
|
3
ba
|
2,892
sqft
|
built
1986
6611 Surfside Blvd, Apollo Beach, FL 33572
$-3,235
Cash flow
-13.5%
Cash-on-Cash Return
3.0%
Cap rate
0.5%
Rent to Value Ratio

Active
$899,000
3
bds
|
3
ba
|
2,095
sqft
|
built
2006
574 Bimini Bay Blvd, Apollo Beach, FL 33572
$-2,682
Cash flow
-15.6%
Cash-on-Cash Return
2.6%
Cap rate
0.4%
Rent to Value Ratio
Active
$625,000
4
bds
|
3
ba
|
3,004
sqft
|
built
2016
212 Shell Creek Ct, Apollo Beach, FL 33572
$-1,503
Cash flow
-12.5%
Cash-on-Cash Return
3.3%
Cap rate
0.6%
Rent to Value Ratio

Active
$400,000
3
bds
|
3
ba
|
2,647
sqft
|
built
2005
110 Aberdeen Pond Dr, Apollo Beach, FL 33572
$-1,340
Cash flow
-17.5%
Cash-on-Cash Return
2.1%
Cap rate
0.8%
Rent to Value Ratio

Active
$344,900
3
bds
|
2
ba
|
1,388
sqft
|
built
1959
489 Fox Run Trl, Apollo Beach, FL 33572
$-864
Cash flow
-13.1%
Cash-on-Cash Return
3.1%
Cap rate
0.6%
Rent to Value Ratio
Active
$735,000
3
bds
|
2
ba
|
1,474
sqft
|
built
1979
6508 Senegal Palm Way, Apollo Beach, FL 33572
$-1,358
Cash flow
-9.6%
Cash-on-Cash Return
3.9%
Cap rate
0.6%
Rent to Value Ratio
Active
$400,000
3
bds
|
3
ba
|
2,184
sqft
|
built
2006
6412 Coquina Island Cv, Apollo Beach, FL 33572
$-890
Cash flow
-11.6%
Cash-on-Cash Return
3.5%
Cap rate
0.7%
Rent to Value Ratio
Active
$420,000
3
bds
|
3
ba
|
2,184
sqft
|
built
2006
530 Bimini Bay Blvd, Apollo Beach, FL 33572
$-978
Cash flow
-12.1%
Cash-on-Cash Return
3.4%
Cap rate
0.7%
Rent to Value Ratio