Bacliff, TX Investment Properties for Sale
Browse homes for sale and investment properties in Bacliff, TX. Refine your search by price, property type, or more.
Best cash flowing properties in Bacliff, TX
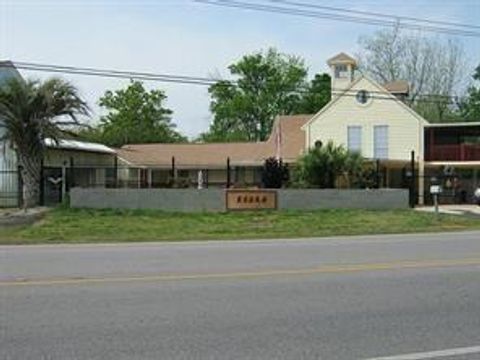
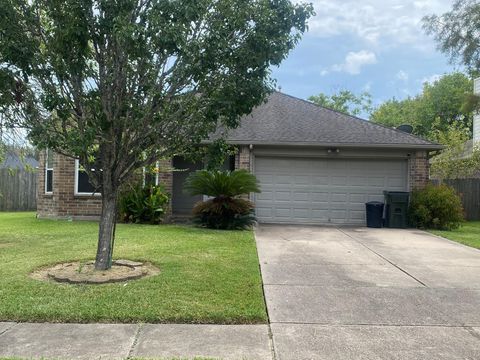
Active
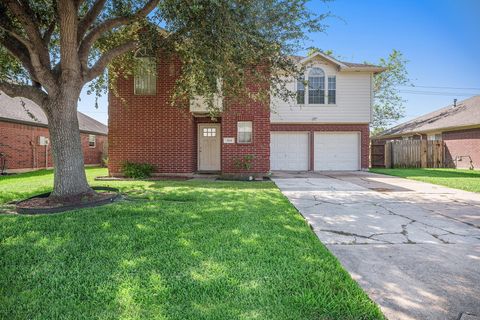
$310,000
2
bds
|
2
ba
|
2,466
sqft
|
built
2000
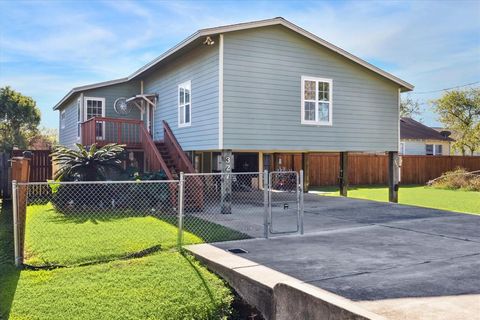
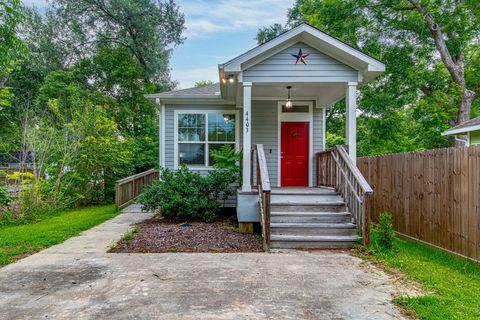
327 Kansas St, Bacliff, TX 77518
$145
Cash flow
2.4%
Cash-on-Cash Return
6.2%
Cap rate
0.9%
Rent to Value Ratio
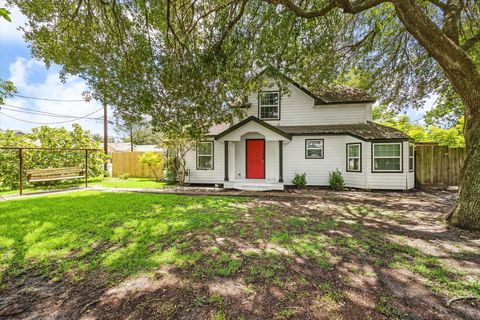
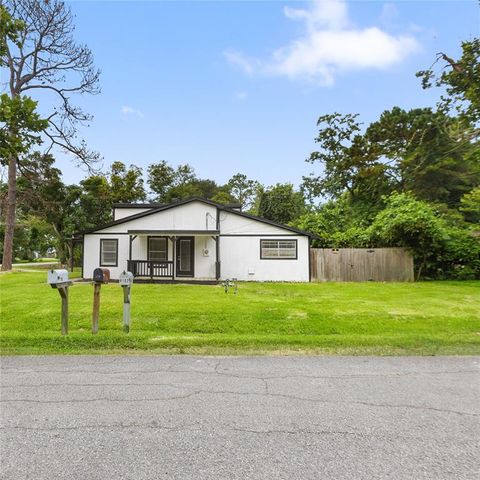
Active
$159,000
4
bds
|
2
ba
|
1,755
sqft
|
built
1977
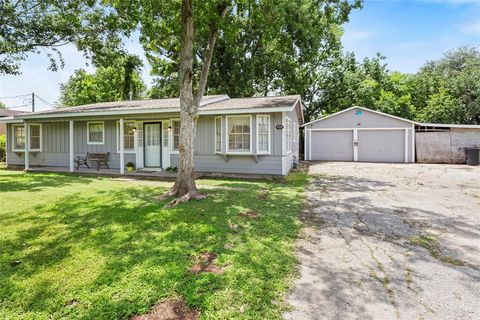
1118 Bacliff Dr, Bacliff, TX 77518
$116
Cash flow
3.8%
Cash-on-Cash Return
6.6%
Cap rate
1.1%
Rent to Value Ratio
32 out of 37 properties for sale in Bacliff, TX
Limited Results Shown
Create a free account, or log in to reveal all property listings and enjoy the complete experience.

Active
$325,000
4
bds
|
3
ba
|
2,228
sqft
|
built
2015
5218 Misty Ln, Bacliff, TX 77518
$-453
Cash flow
-7.3%
Cash-on-Cash Return
4.0%
Cap rate
0.7%
Rent to Value Ratio
Active
$1,399,999
3
bds
|
1
ba
|
6,000
sqft
|
built
1973
4119 Houx St, Bacliff, TX 77518
$-5,521
Cash flow
-20.6%
Cash-on-Cash Return
0.9%
Cap rate
0.1%
Rent to Value Ratio
Active
$185,000
2
bds
|
2
ba
|
1,200
sqft
|
built
1972
4444 18th St, Bacliff, TX 77518
$45
Cash flow
1.3%
Cash-on-Cash Return
6.0%
Cap rate
0.9%
Rent to Value Ratio
Active
$159,000
2
bds
|
1
ba
|
1,152
sqft
|
built
1965
4743 6th St, Bacliff, TX 77518
$-321
Cash flow
-10.5%
Cash-on-Cash Return
3.3%
Cap rate
0.6%
Rent to Value Ratio
Active
$200,000
2
bds
|
1
ba
|
624
sqft
|
built
1995
4213 Kinne St, Bacliff, TX 77518
$-275
Cash flow
-7.2%
Cash-on-Cash Return
4.0%
Cap rate
0.6%
Rent to Value Ratio
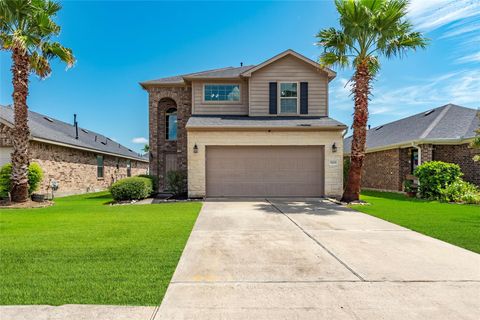
Active
$206,900
4
bds
|
2
ba
|
3,326
sqft
|
built
1972
4109 Lechenger St, Bacliff, TX 77518
$12
Cash flow
0.3%
Cash-on-Cash Return
5.7%
Cap rate
1.0%
Rent to Value Ratio
Active
$899,900
4
bds
|
3
ba
|
3,101
sqft
|
built
1992
5123 W Bayshore Dr, Bacliff, TX 77518
$-2,797
Cash flow
-16.2%
Cash-on-Cash Return
1.9%
Cap rate
0.4%
Rent to Value Ratio
Active
$215,000
4
bds
|
3
ba
|
1,980
sqft
|
built
1972
4617 3rd St, Bacliff, TX 77518
$-652
Cash flow
-15.8%
Cash-on-Cash Return
2.0%
Cap rate
0.5%
Rent to Value Ratio
Active
$309,000
2
bds
|
3
ba
|
2,051
sqft
|
built
1988
4201 Sevan St, Bacliff, TX 77518
$-401
Cash flow
-6.8%
Cash-on-Cash Return
4.1%
Cap rate
0.7%
Rent to Value Ratio
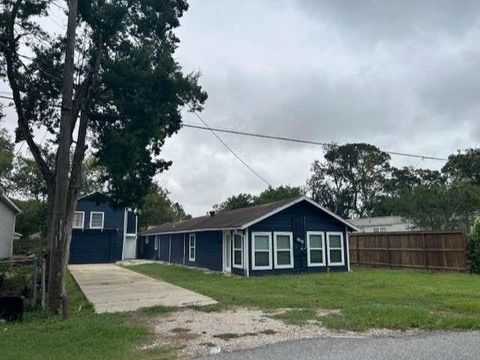
Active
$135,000
3
bds
|
1
ba
|
934
sqft
|
built
2004
4619 18th St, Bacliff, TX 77518
$-68
Cash flow
-2.6%
Cash-on-Cash Return
5.1%
Cap rate
0.9%
Rent to Value Ratio
Active
$279,900
3
bds
|
2
ba
|
1,680
sqft
|
built
2005
4624 6th St, Bacliff, TX 77518
$-399
Cash flow
-7.4%
Cash-on-Cash Return
4.0%
Cap rate
0.6%
Rent to Value Ratio
Active
$399,000
4
bds
|
3
ba
|
2,788
sqft
|
built
1994
4700 W Bayshore Dr, Bacliff, TX 77518
$-360
Cash flow
-4.7%
Cash-on-Cash Return
4.6%
Cap rate
0.6%
Rent to Value Ratio
Active
$280,000
3
bds
|
2
ba
|
1,942
sqft
|
built
1956
3702 Chanterway St, Bacliff, TX 77518
$-291
Cash flow
-5.4%
Cash-on-Cash Return
4.4%
Cap rate
0.8%
Rent to Value Ratio

Active
$1,199,000
5
bds
|
4
ba
|
5,062
sqft
|
built
1995
5419 W Bayshore Dr, Bacliff, TX 77518
$-2,987
Cash flow
-13.0%
Cash-on-Cash Return
2.7%
Cap rate
0.6%
Rent to Value Ratio
Active
$259,000
3
bds
|
3
ba
|
1,641
sqft
|
built
2015
5203 Lagoon Ct, Bacliff, TX 77518
$-281
Cash flow
-5.7%
Cash-on-Cash Return
4.4%
Cap rate
0.8%
Rent to Value Ratio
Active
$242,499
bds
|
2
ba
|
1,456
sqft
|
built
1950
4711 3rd St, Bacliff, TX 77518
$-626
Cash flow
-13.5%
Cash-on-Cash Return
2.6%
Cap rate
0.6%
Rent to Value Ratio
Active
$242,500
3
bds
|
2
ba
|
1,769
sqft
|
built
1998
5010 Chase Stone Dr, Bacliff, TX 77518
$-225
Cash flow
-4.8%
Cash-on-Cash Return
4.6%
Cap rate
0.8%
Rent to Value Ratio

Active
$250,000
3
bds
|
1
ba
|
944
sqft
|
built
2010
4817 12th St, Bacliff, TX 77518
$-469
Cash flow
-9.8%
Cash-on-Cash Return
3.4%
Cap rate
0.6%
Rent to Value Ratio
Active
$200,000
3
bds
|
2
ba
|
1,347
sqft
|
built
1967
4623 Orange St, Bacliff, TX 77518
$-110
Cash flow
-2.9%
Cash-on-Cash Return
5.0%
Cap rate
0.9%
Rent to Value Ratio
Active
$359,000
4
bds
|
3
ba
|
2,228
sqft
|
built
2015
5107 Lagoon Ct, Bacliff, TX 77518
$-777
Cash flow
-11.3%
Cash-on-Cash Return
3.1%
Cap rate
0.6%
Rent to Value Ratio
Active
$240,000
3
bds
|
3
ba
|
1,457
sqft
|
built
2016
207 Sea Breeze Dr, Bacliff, TX 77518
$-219
Cash flow
-4.8%
Cash-on-Cash Return
4.6%
Cap rate
0.8%
Rent to Value Ratio
Active
$229,900
3
bds
|
3
ba
|
1,729
sqft
|
built
1997
5114 Chase Court Dr, Bacliff, TX 77518
$-99
Cash flow
-2.2%
Cash-on-Cash Return
5.2%
Cap rate
0.9%
Rent to Value Ratio
Active
$1,600,000
4
bds
|
5
ba
|
4,000
sqft
|
built
2002
3039 Bayshore Dr, Bacliff, TX 77518
$-5,179
Cash flow
-16.9%
Cash-on-Cash Return
1.8%
Cap rate
0.3%
Rent to Value Ratio
Active
$205,000
3
bds
|
1
ba
|
1,862
sqft
|
built
1952
3307 Triplett St, Bacliff, TX 77518
$38
Cash flow
1.0%
Cash-on-Cash Return
5.9%
Cap rate
1.0%
Rent to Value Ratio
Active
$239,000
3
bds
|
2
ba
|
1,480
sqft
|
built
2002
5114 Chasewood Dr, Bacliff, TX 77518
$-244
Cash flow
-5.3%
Cash-on-Cash Return
4.5%
Cap rate
0.8%
Rent to Value Ratio
Active
$212,000
2
bds
|
2
ba
|
1,368
sqft
|
built
2014
4403 2nd St, Bacliff, TX 77518
$-120
Cash flow
-3.0%
Cash-on-Cash Return
5.0%
Cap rate
0.8%
Rent to Value Ratio
Active
$199,999
2
bds
|
2
ba
|
1,380
sqft
|
built
1995
4103 Fuqua St, Bacliff, TX 77518
$-117
Cash flow
-3.1%
Cash-on-Cash Return
5.0%
Cap rate
0.9%
Rent to Value Ratio
Active
$194,000
3
bds
|
2
ba
|
1,352
sqft
|
built
1968
3114 Carolyn St, Bacliff, TX 77518
$102
Cash flow
2.7%
Cash-on-Cash Return
6.3%
Cap rate
0.9%
Rent to Value Ratio
Active
$214,900
2
bds
|
1
ba
|
745
sqft
|
built
1986
4749 2nd St, Bacliff, TX 77518
$-161
Cash flow
-3.9%
Cash-on-Cash Return
4.8%
Cap rate
0.7%
Rent to Value Ratio
Active
$269,500
4
bds
|
3
ba
|
1,993
sqft
|
built
2006
827 Chase View Dr, Bacliff, TX 77518
$-493
Cash flow
-9.5%
Cash-on-Cash Return
3.5%
Cap rate
0.7%
Rent to Value Ratio