Baton Rouge, LA Investment Properties for Sale
Browse homes for sale and investment properties in Baton Rouge, LA. Refine your search by price, property type, or more.
Best cash flowing properties in Baton Rouge, LA

Active
$77,900
4
bds
|
1
ba
|
1,552
sqft
|
built
1983
2301 N 20th St, Baton Rouge, LA 70802
$459
Cash flow
30.7%
Cash-on-Cash Return
12.8%
Cap rate
1.5%
Rent to Value Ratio

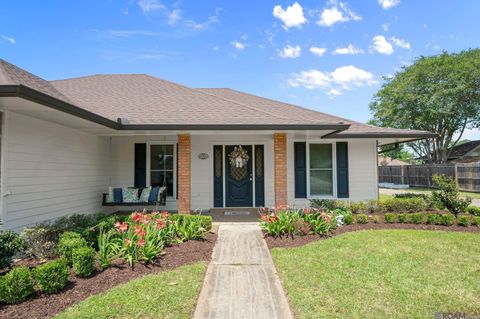
Active
$224,000
3
bds
|
2
ba
|
1,741
sqft
|
built
1969
3923 Aletha Dr, Baton Rouge, LA 70814
$458
Cash flow
10.7%
Cash-on-Cash Return
8.1%
Cap rate
1.0%
Rent to Value Ratio
726 out of 954 properties for sale in Baton Rouge, LA
Limited Results Shown
Create a free account, or log in to reveal all property listings and enjoy the complete experience.

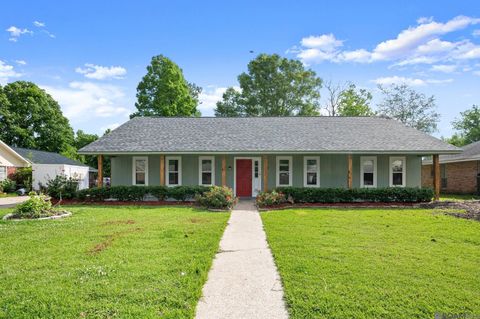
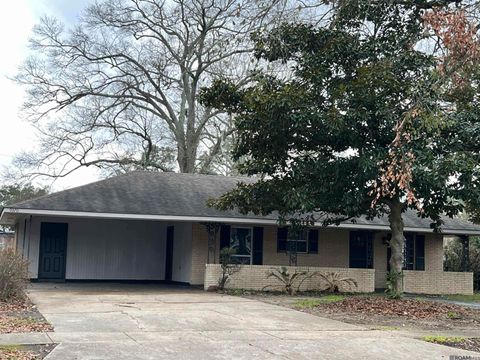
Active
$160,000
4
bds
|
2
ba
|
1,600
sqft
|
built
1989
1915 Tennessee St, Baton Rouge, LA 70802
$2
Cash flow
0.1%
Cash-on-Cash Return
5.7%
Cap rate
0.7%
Rent to Value Ratio

Active
$2,349,000
3
bds
|
3
ba
|
3,186
sqft
|
built
2003
16056 Highland Bluff Ct, Baton Rouge, LA 70810
$-6,790
Cash flow
-15.1%
Cash-on-Cash Return
2.2%
Cap rate
0.3%
Rent to Value Ratio
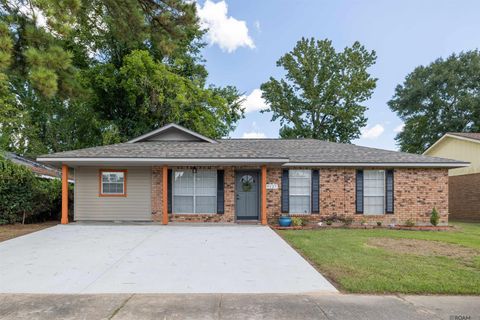
Active
$143,000
3
bds
|
1
ba
|
1,412
sqft
|
built
1954
2635 79th Ave, Baton Rouge, LA 70807
$427
Cash flow
15.6%
Cash-on-Cash Return
9.3%
Cap rate
1.1%
Rent to Value Ratio
Active
$369,500
5
bds
|
3
ba
|
2,950
sqft
|
built
1974
1233 Ashbourne Dr, Baton Rouge, LA 70815
$45
Cash flow
0.6%
Cash-on-Cash Return
5.8%
Cap rate
0.7%
Rent to Value Ratio
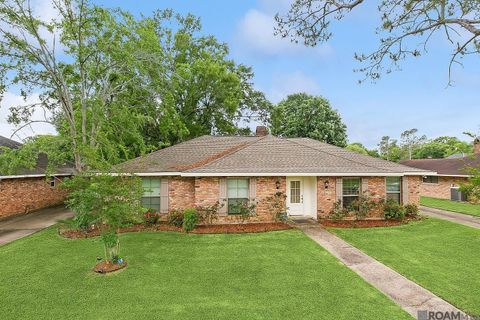
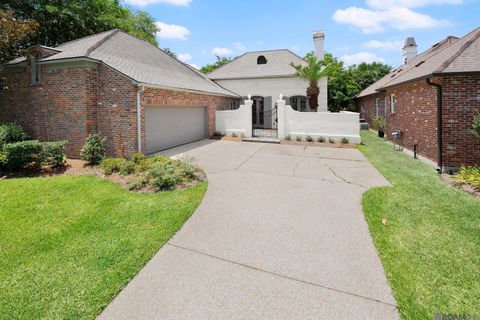
Active
$289,900
4
bds
|
3
ba
|
2,502
sqft
|
built
1981
13456 Cedar Ridge Ave, Baton Rouge, LA 70817
$146
Cash flow
2.6%
Cash-on-Cash Return
6.3%
Cap rate
0.8%
Rent to Value Ratio
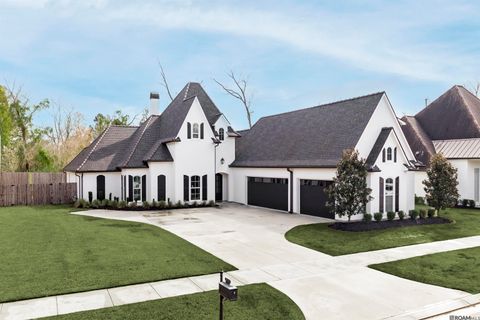
Active
$725,000
4
bds
|
4
ba
|
3,481
sqft
|
built
2004
3018 Tradition Ave, Baton Rouge, LA 70810
$-468
Cash flow
-3.4%
Cash-on-Cash Return
4.9%
Cap rate
0.6%
Rent to Value Ratio

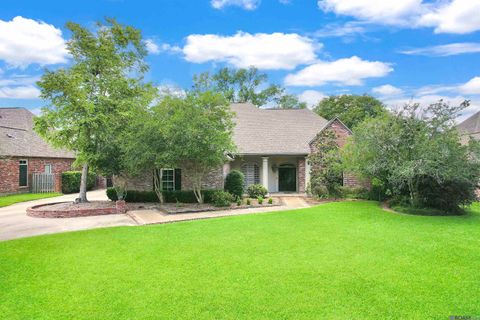
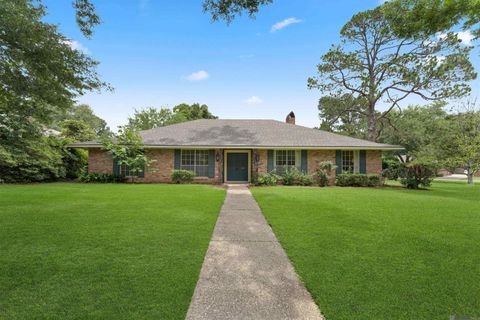
Active
$280,000
3
bds
|
2
ba
|
1,615
sqft
|
built
1996
3978 Meadow Ridge Dr, Baton Rouge, LA 70817
$-98
Cash flow
-1.8%
Cash-on-Cash Return
5.3%
Cap rate
0.6%
Rent to Value Ratio
Active
$1,075,000
4
bds
|
3
ba
|
3,408
sqft
|
built
1983
17929 Cascades Ave, Baton Rouge, LA 70810
$-1,912
Cash flow
-9.3%
Cash-on-Cash Return
3.5%
Cap rate
0.5%
Rent to Value Ratio
Active
$235,000
3
bds
|
2
ba
|
1,450
sqft
|
built
1990
17725 Nine Oaks Ave, Baton Rouge, LA 70817
$-8
Cash flow
-0.2%
Cash-on-Cash Return
5.6%
Cap rate
0.7%
Rent to Value Ratio

Active
$499,900
3
bds
|
2
ba
|
2,027
sqft
|
built
1949
418 Kenwood Ave, Baton Rouge, LA 70806
$-572
Cash flow
-6.0%
Cash-on-Cash Return
4.3%
Cap rate
0.5%
Rent to Value Ratio
Active
$230,000
3
bds
|
2
ba
|
1,550
sqft
|
built
1980
2128 Elkwood Ave, Baton Rouge, LA 70816
$16
Cash flow
0.4%
Cash-on-Cash Return
5.8%
Cap rate
0.7%
Rent to Value Ratio

Active
$279,900
2
bds
|
1
ba
|
1,384
sqft
|
built
1920
614 Europe St, Baton Rouge, LA 70802
$55
Cash flow
1.0%
Cash-on-Cash Return
5.9%
Cap rate
0.7%
Rent to Value Ratio

Active
$995,000
4
bds
|
4
ba
|
4,723
sqft
|
built
1979
8753 W Fairway Dr, Baton Rouge, LA 70809
$-914
Cash flow
-4.8%
Cash-on-Cash Return
4.6%
Cap rate
0.6%
Rent to Value Ratio
Active
$599,900
4
bds
|
4
ba
|
2,773
sqft
|
built
2007
3005 Rue D Orleans, Baton Rouge, LA 70810
$-572
Cash flow
-5.0%
Cash-on-Cash Return
4.5%
Cap rate
0.6%
Rent to Value Ratio

Active
$1,048,000
4
bds
|
4
ba
|
3,809
sqft
|
built
1991
17627 Masters Pointe Ct, Baton Rouge, LA 70810
$-1,707
Cash flow
-8.5%
Cash-on-Cash Return
3.7%
Cap rate
0.5%
Rent to Value Ratio
Active
$434,900
4
bds
|
3
ba
|
2,488
sqft
|
built
1978
7726 Lew Hoad Ave, Baton Rouge, LA 70810
$-130
Cash flow
-1.6%
Cash-on-Cash Return
5.3%
Cap rate
0.6%
Rent to Value Ratio

Active
$1,630,000
5
bds
|
6
ba
|
5,179
sqft
|
built
2005
2611 Cedar Lodge Dr, Baton Rouge, LA 70809
$-3,023
Cash flow
-9.7%
Cash-on-Cash Return
3.5%
Cap rate
0.4%
Rent to Value Ratio
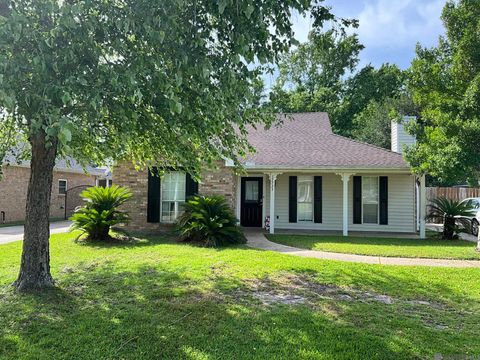
Active
$245,000
4
bds
|
2
ba
|
1,906
sqft
|
built
1977
1837 Stonewood Dr, Baton Rouge, LA 70816
$83
Cash flow
1.8%
Cash-on-Cash Return
6.1%
Cap rate
0.7%
Rent to Value Ratio
Active
$338,000
4
bds
|
3
ba
|
2,484
sqft
|
built
1973
13212 Avants Ave, Baton Rouge, LA 70815
$-82
Cash flow
-1.3%
Cash-on-Cash Return
5.4%
Cap rate
0.7%
Rent to Value Ratio

Active
$119,000
3
bds
|
2
ba
|
1,020
sqft
|
built
1960
1606 Myrtle Walk, Baton Rouge, LA 70802
$127
Cash flow
5.6%
Cash-on-Cash Return
7.0%
Cap rate
0.8%
Rent to Value Ratio
Active
$469,900
4
bds
|
3
ba
|
2,642
sqft
|
built
1970
5977 Hyacinth Ave, Baton Rouge, LA 70808
$-499
Cash flow
-5.5%
Cash-on-Cash Return
4.4%
Cap rate
0.5%
Rent to Value Ratio

Active
$749,000
4
bds
|
4
ba
|
3,865
sqft
|
built
1984
931 Woodstone Dr, Baton Rouge, LA 70808
$-834
Cash flow
-5.8%
Cash-on-Cash Return
4.3%
Cap rate
0.5%
Rent to Value Ratio

Active
$4,995,000
6
bds
|
7
ba
|
6,494
sqft
|
built
1953
6326 Highland Rd, Baton Rouge, LA 70808
$-20,947
Cash flow
-21.9%
Cash-on-Cash Return
0.6%
Cap rate
0.1%
Rent to Value Ratio
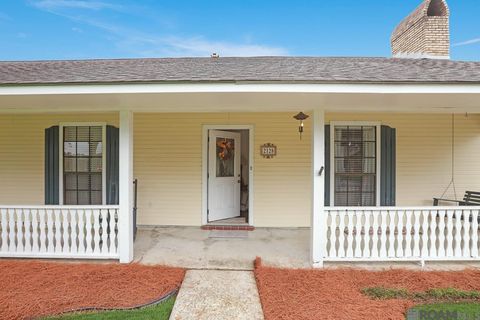
Active
$210,000
4
bds
|
2
ba
|
1,600
sqft
|
built
1975
9370 W Tams Dr, Baton Rouge, LA 70815
$110
Cash flow
2.7%
Cash-on-Cash Return
6.3%
Cap rate
0.8%
Rent to Value Ratio

Active
$449,900
4
bds
|
3
ba
|
2,823
sqft
|
built
1973
4480 Downing Dr, Baton Rouge, LA 70809
$355
Cash flow
4.1%
Cash-on-Cash Return
6.6%
Cap rate
0.8%
Rent to Value Ratio
Active
$499,500
3
bds
|
3
ba
|
2,351
sqft
|
built
1998
19516 Cape Hart Ct, Baton Rouge, LA 70809
$-628
Cash flow
-6.6%
Cash-on-Cash Return
4.2%
Cap rate
0.5%
Rent to Value Ratio

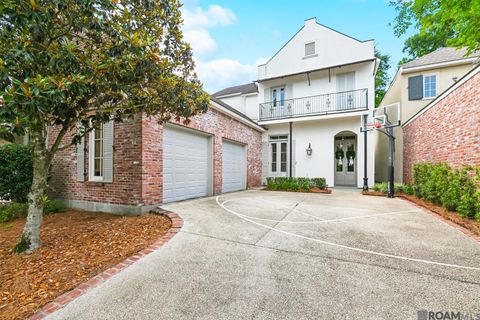
Active
$699,900
4
bds
|
4
ba
|
2,531
sqft
|
built
2015
2063 Rue Venelle, Baton Rouge, LA 70808
$-1,295
Cash flow
-9.7%
Cash-on-Cash Return
3.5%
Cap rate
0.5%
Rent to Value Ratio

Active
$749,900
4
bds
|
4
ba
|
3,424
sqft
|
built
1960
6565 Sevenoaks Ave, Baton Rouge, LA 70806
$-1,824
Cash flow
-12.7%
Cash-on-Cash Return
2.8%
Cap rate
0.3%
Rent to Value Ratio
Active
$895,000
5
bds
|
5
ba
|
4,038
sqft
|
built
2018
18219 Woodland Cove Dr, Baton Rouge, LA 70817
$-896
Cash flow
-5.2%
Cash-on-Cash Return
4.5%
Cap rate
0.5%
Rent to Value Ratio
Active
$229,000
4
bds
|
2
ba
|
1,400
sqft
|
built
1977
9127 Baronne Dr, Baton Rouge, LA 70810
$-49
Cash flow
-1.1%
Cash-on-Cash Return
5.4%
Cap rate
0.7%
Rent to Value Ratio

Active
$759,000
4
bds
|
3
ba
|
3,300
sqft
|
built
1994
18030 Cascades Ave, Baton Rouge, LA 70810
$-1,442
Cash flow
-9.9%
Cash-on-Cash Return
3.4%
Cap rate
0.5%
Rent to Value Ratio
Active
$537,400
4
bds
|
3
ba
|
2,260
sqft
|
built
2021
14238 Haile Way, Baton Rouge, LA 70817
$-475
Cash flow
-4.6%
Cash-on-Cash Return
4.6%
Cap rate
0.6%
Rent to Value Ratio

Active
$1,295,000
4
bds
|
6
ba
|
5,301
sqft
|
built
2007
1923 Old Plantation Ln, Baton Rouge, LA 70806
$-3,023
Cash flow
-12.2%
Cash-on-Cash Return
2.9%
Cap rate
0.3%
Rent to Value Ratio
Active
$2,349,000
6
bds
|
8
ba
|
5,266
sqft
|
built
1994
19420 N Muirfield Cir, Baton Rouge, LA 70810
$-8,286
Cash flow
-18.4%
Cash-on-Cash Return
1.4%
Cap rate
0.2%
Rent to Value Ratio

Active
$421,000
3
bds
|
2
ba
|
2,170
sqft
|
built
1969
3755 Drusilla Dr, Baton Rouge, LA 70809
$-60
Cash flow
-0.7%
Cash-on-Cash Return
5.5%
Cap rate
0.7%
Rent to Value Ratio
Active
$95,000
3
bds
|
1
ba
|
1,064
sqft
|
built
1970
5496 Frey St, Baton Rouge, LA 70805
$240
Cash flow
13.2%
Cash-on-Cash Return
8.7%
Cap rate
1.1%
Rent to Value Ratio
Active
$220,000
bds
|
0
ba
|
2,281
sqft
|
built
12549 Lorna Ave, Baton Rouge, LA 70815
$-144
Cash flow
-3.4%
Cash-on-Cash Return
4.9%
Cap rate
0.6%
Rent to Value Ratio
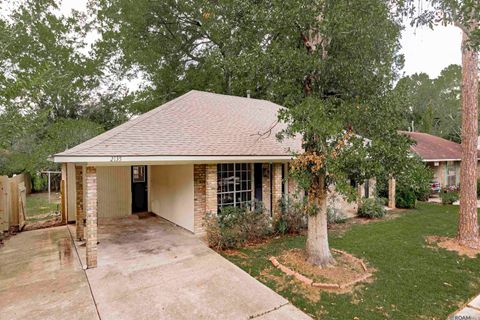
Active
$187,000
3
bds
|
2
ba
|
1,335
sqft
|
built
1980
2135 Vickers Dr, Baton Rouge, LA 70815
$219
Cash flow
6.1%
Cash-on-Cash Return
7.1%
Cap rate
0.9%
Rent to Value Ratio