Baton Rouge, LA Investment Properties for Sale
Browse homes for sale and investment properties in Baton Rouge, LA. Refine your search by price, property type, or more.
Best cash flowing properties in Baton Rouge, LA
Active
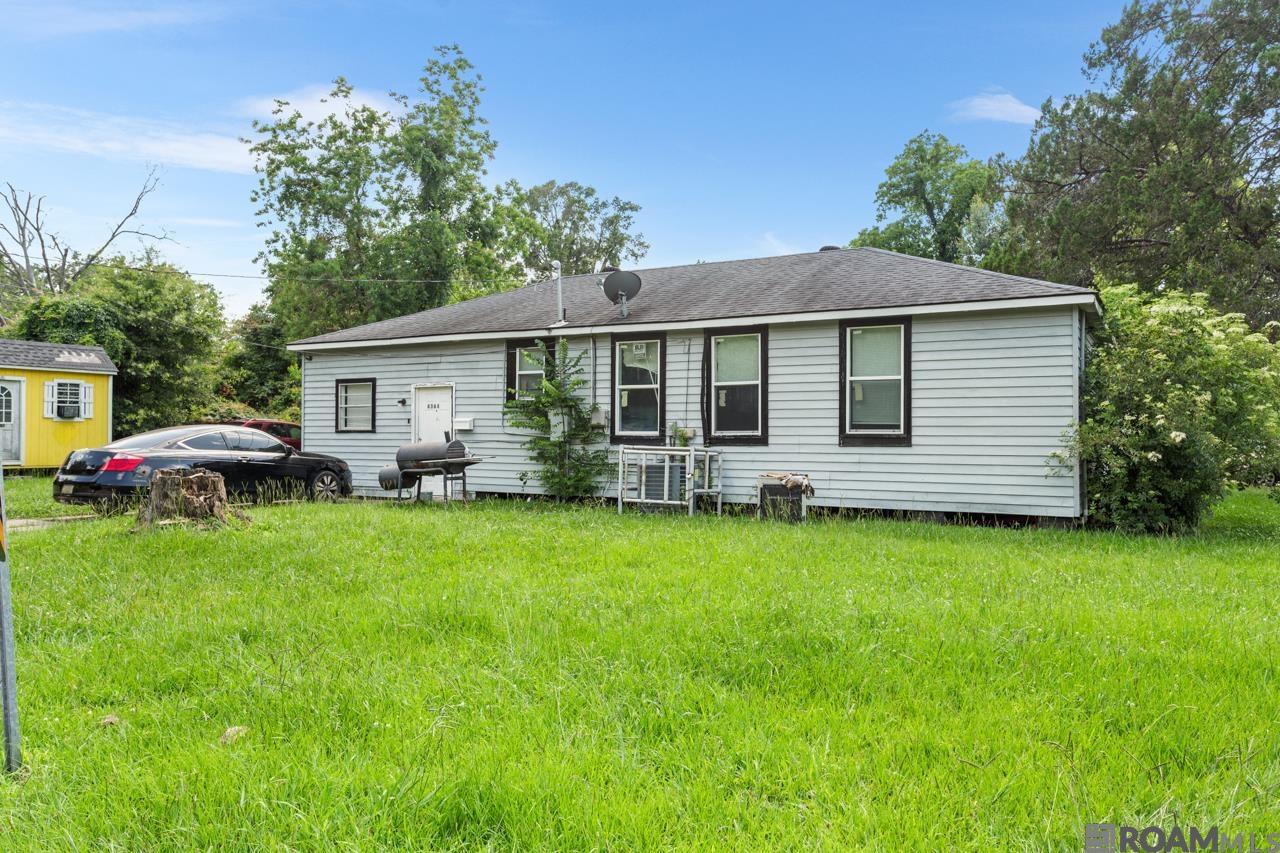
$89,000
2
bds
|
2
ba
|
1,135
sqft
|
built
1975
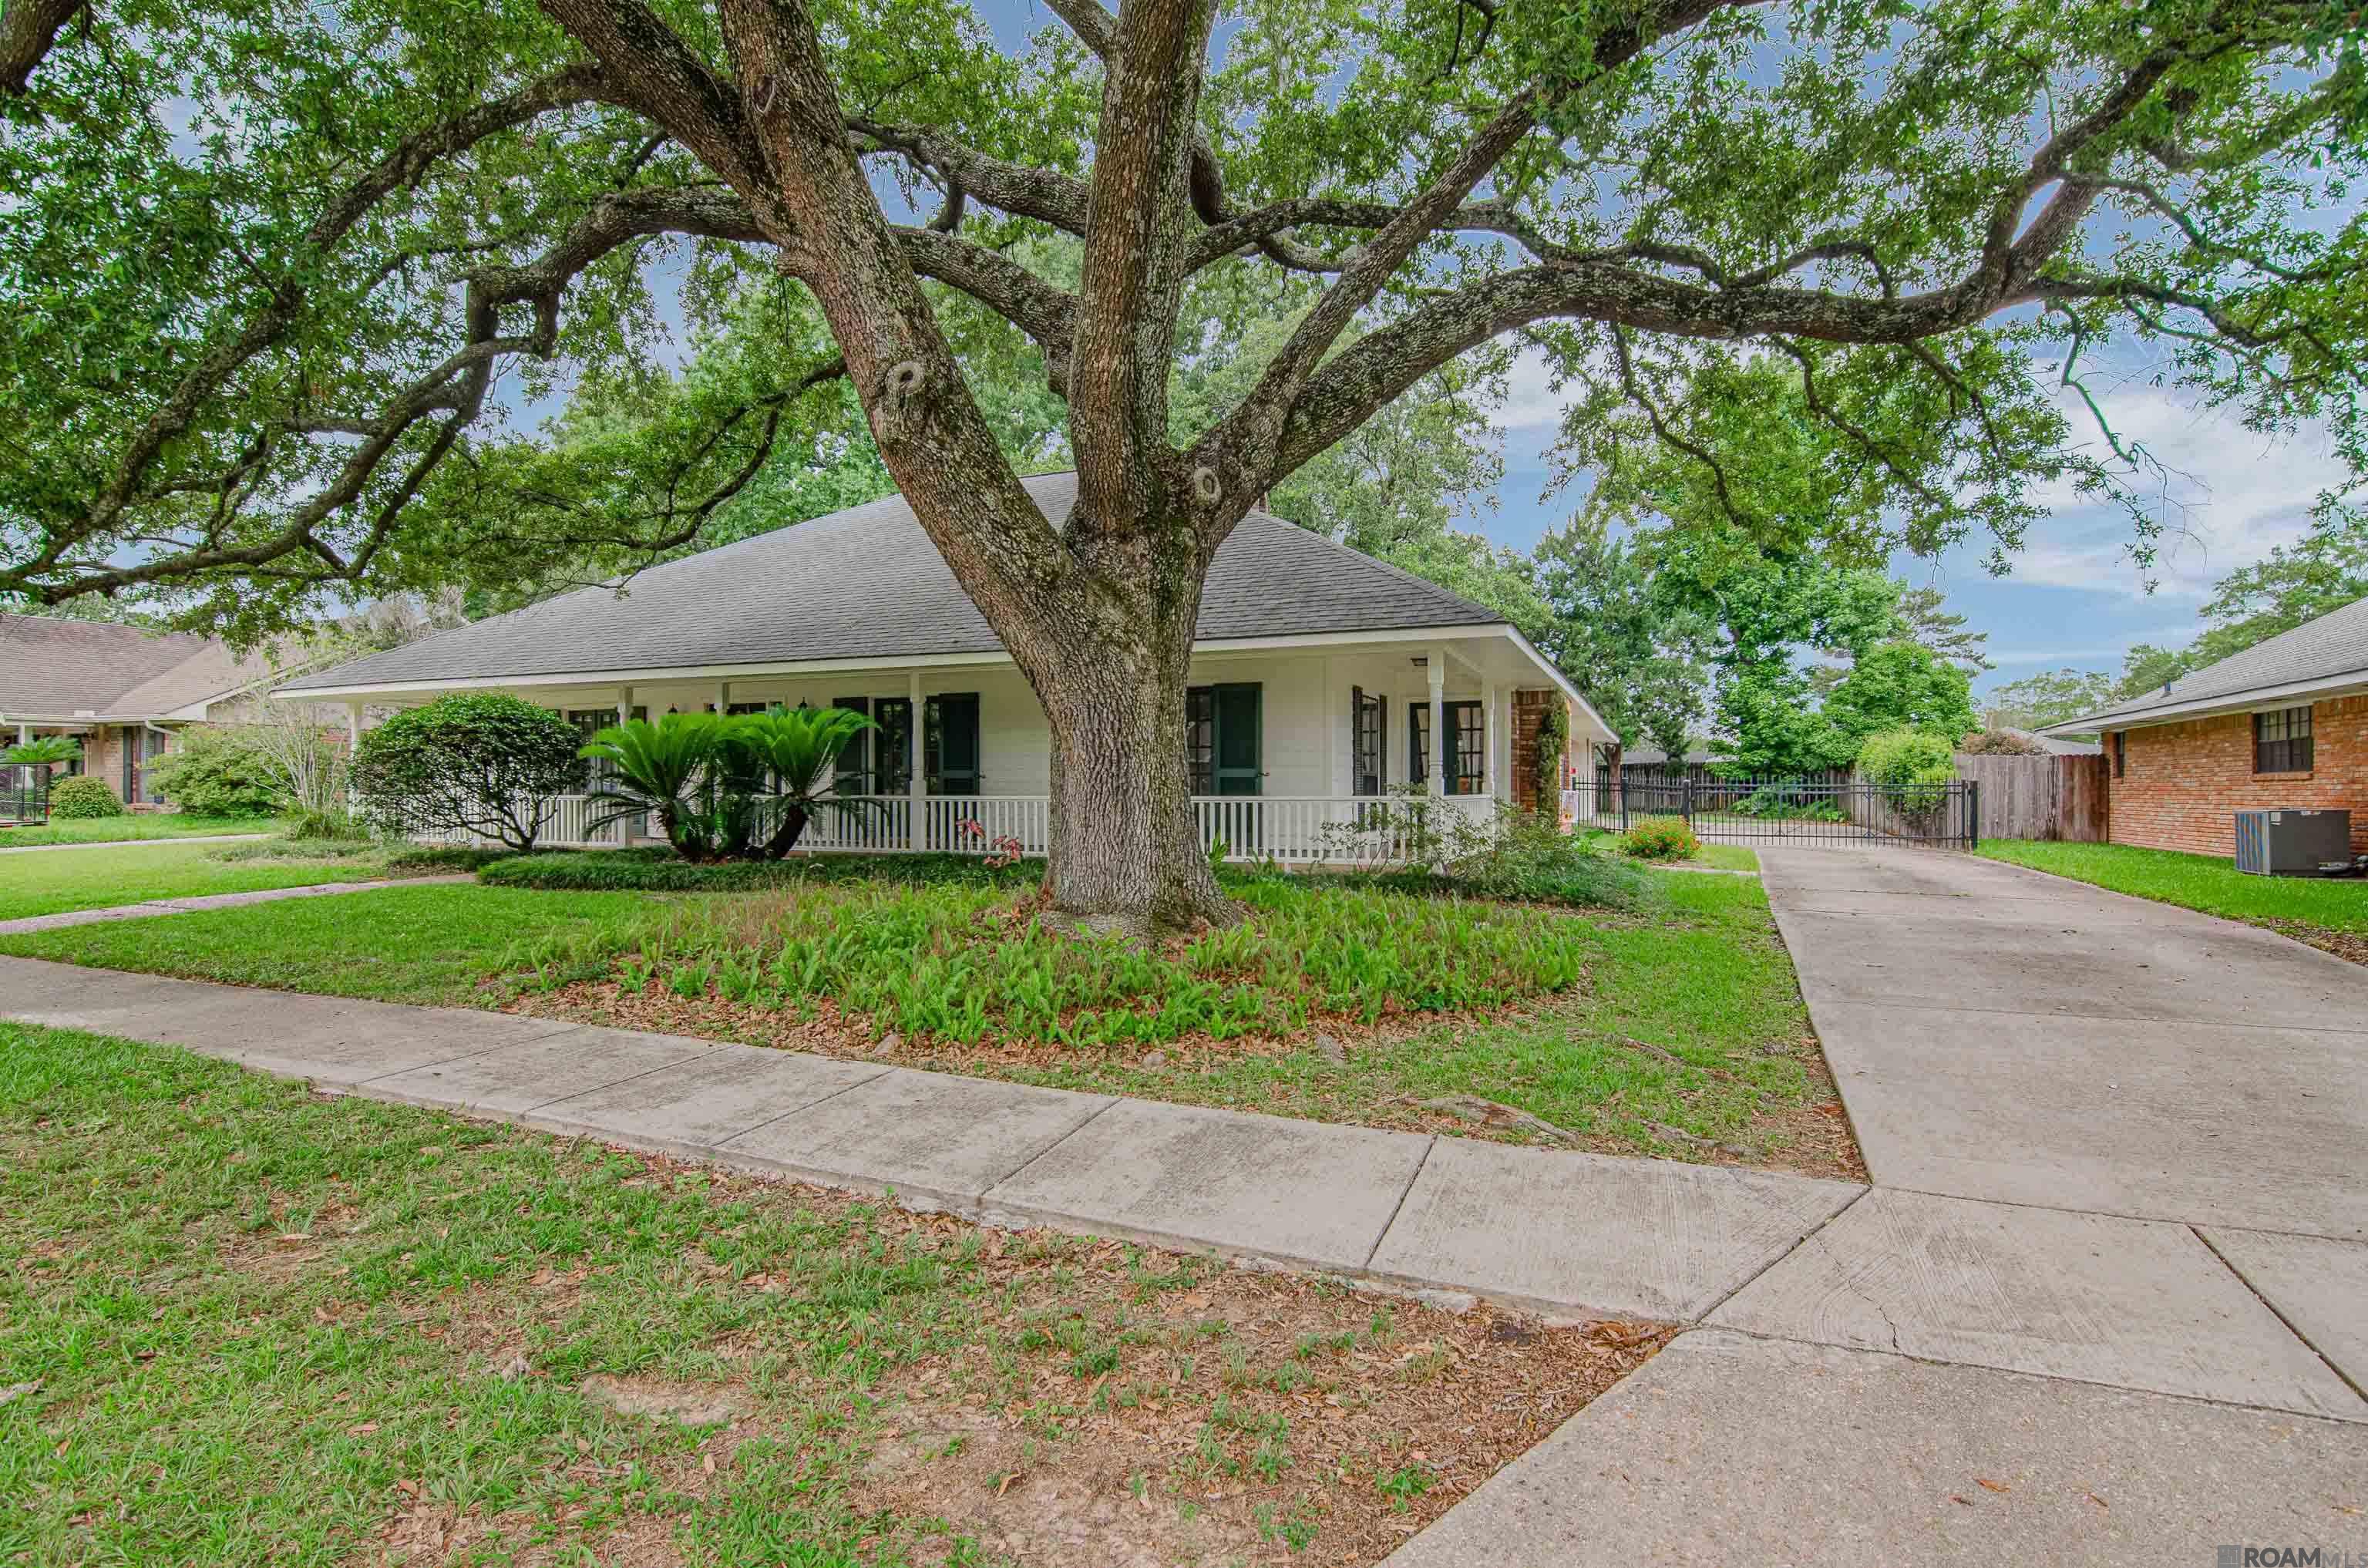
4364 Gurney St, Baton Rouge, LA 70805
$431
Cash flow
25.3%
Cash-on-Cash Return
12.1%
Cap rate
1.5%
Rent to Value Ratio
Active
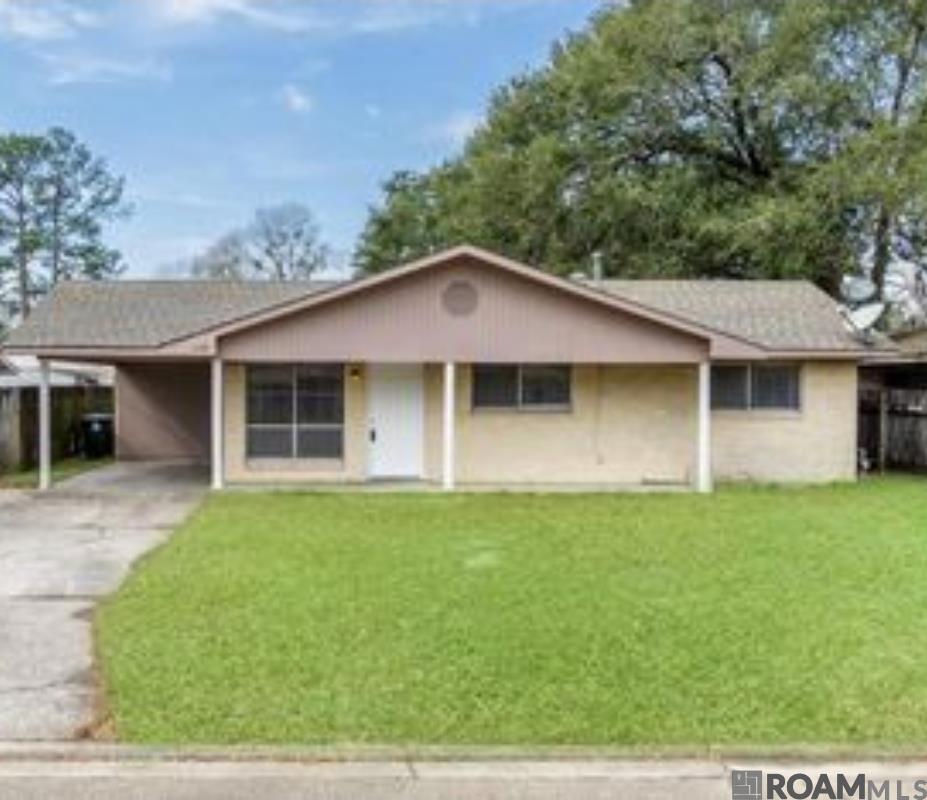
$189,995
3
bds
|
2
ba
|
2,090
sqft
|
built
1967
1133 Flora Ln, Baton Rouge, LA 70810
$247
Cash flow
6.8%
Cash-on-Cash Return
7.8%
Cap rate
0.9%
Rent to Value Ratio
986 out of 1,271 properties for sale in Baton Rouge, LA
Limited Results Shown
Create a free account, or log in to reveal all property listings and enjoy the complete experience.

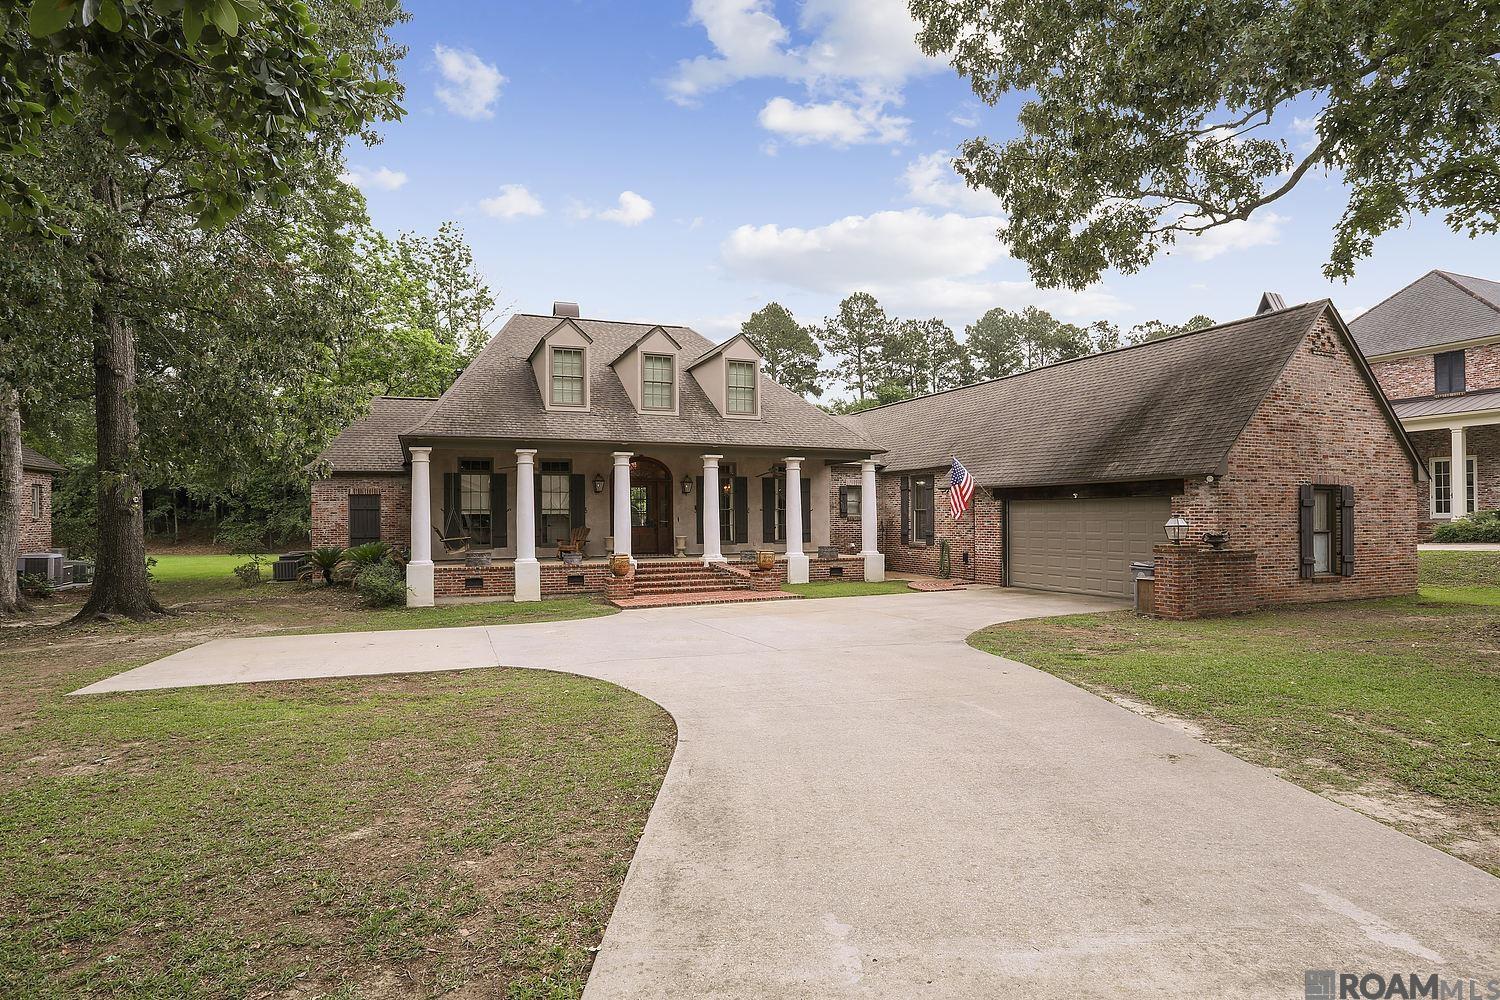
Active
$475,000
5
bds
|
3
ba
|
2,967
sqft
|
built
1974
11403 Joor Rd, Baton Rouge, LA 70818
$-279
Cash flow
-3.1%
Cash-on-Cash Return
5.6%
Cap rate
0.7%
Rent to Value Ratio
Active
$180,000
3
bds
|
2
ba
|
1,325
sqft
|
built
1981
10351 N Harvey Dr, Baton Rouge, LA 70815
$23
Cash flow
0.7%
Cash-on-Cash Return
6.4%
Cap rate
0.8%
Rent to Value Ratio
Pending
$219,900
4
bds
|
2
ba
|
1,754
sqft
|
built
2003
330 Edgehaven Dr, Baton Rouge, LA 70810
$82
Cash flow
1.9%
Cash-on-Cash Return
6.7%
Cap rate
0.8%
Rent to Value Ratio
Active
$165,000
3
bds
|
2
ba
|
1,250
sqft
|
built
1985
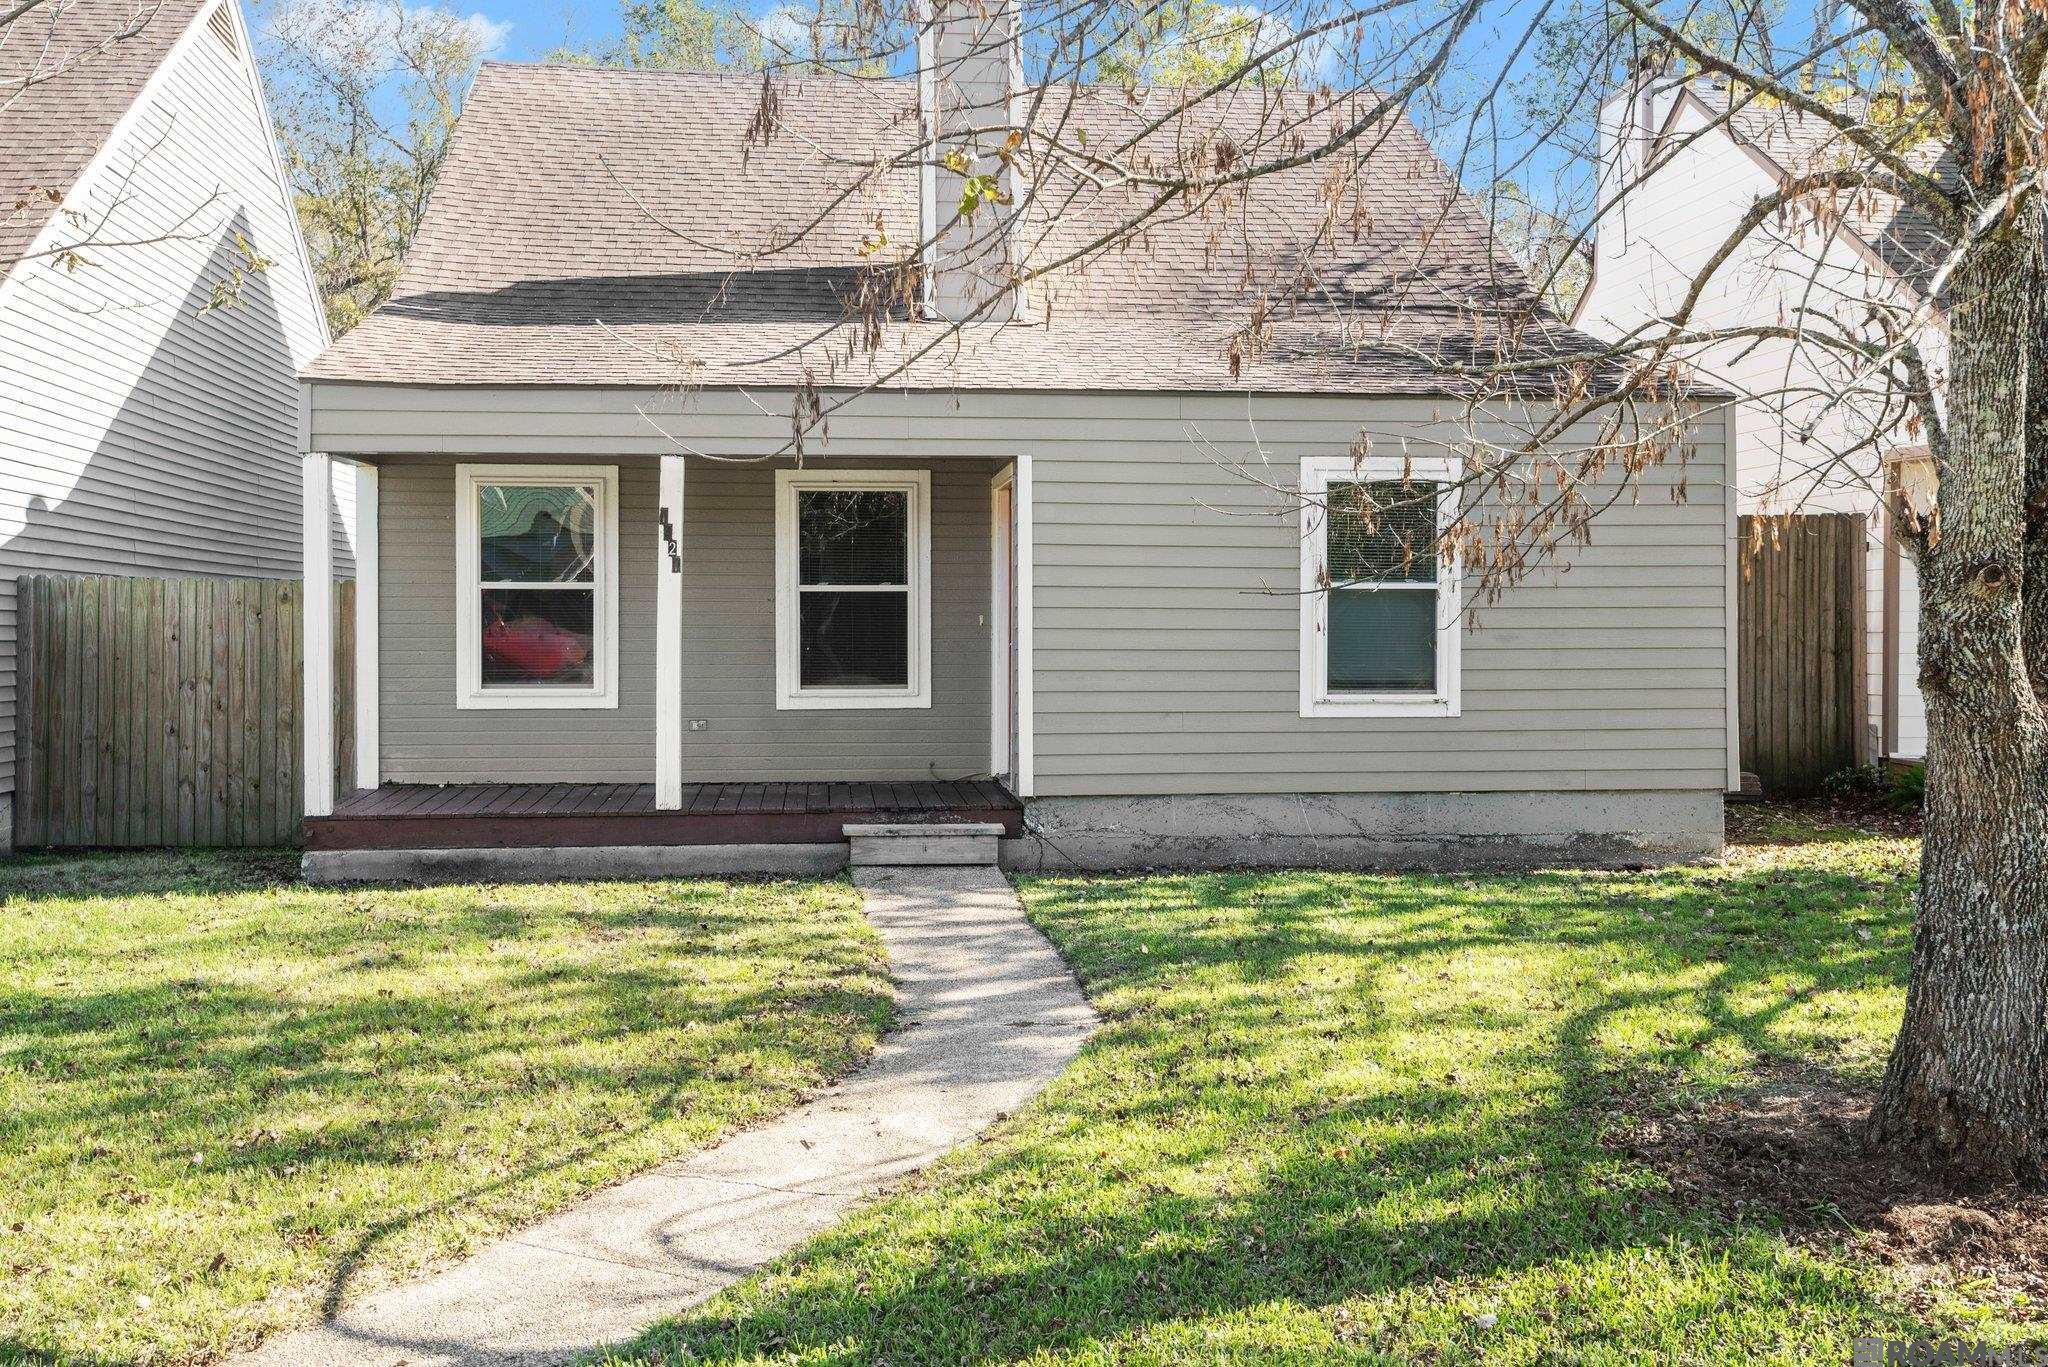
1421 Lila St, Baton Rouge, LA 70820
$240
Cash flow
7.6%
Cash-on-Cash Return
8.0%
Cap rate
1.0%
Rent to Value Ratio

Active
$200,000
2
bds
|
2
ba
|
1,520
sqft
|
built
1980
10157 Jefferson Hwy, Baton Rouge, LA 70809
$-188
Cash flow
-4.9%
Cash-on-Cash Return
5.2%
Cap rate
0.8%
Rent to Value Ratio
Active
$399,721
6
bds
|
4
ba
|
3,695
sqft
|
built
1974
5906 Bennington Ave, Baton Rouge, LA 70808
$-161
Cash flow
-2.1%
Cash-on-Cash Return
5.8%
Cap rate
0.7%
Rent to Value Ratio
Active
$565,000
4
bds
|
3
ba
|
2,856
sqft
|
built
1989
626 Shadow Oak Dr, Baton Rouge, LA 70810
$-281
Cash flow
-2.6%
Cash-on-Cash Return
5.7%
Cap rate
0.7%
Rent to Value Ratio
Active
$285,000
bds
|
0
ba
|
1,536
sqft
|
built
3408 Wilshire Dr, Baton Rouge, LA 70806
$-112
Cash flow
-2.1%
Cash-on-Cash Return
5.8%
Cap rate
0.7%
Rent to Value Ratio
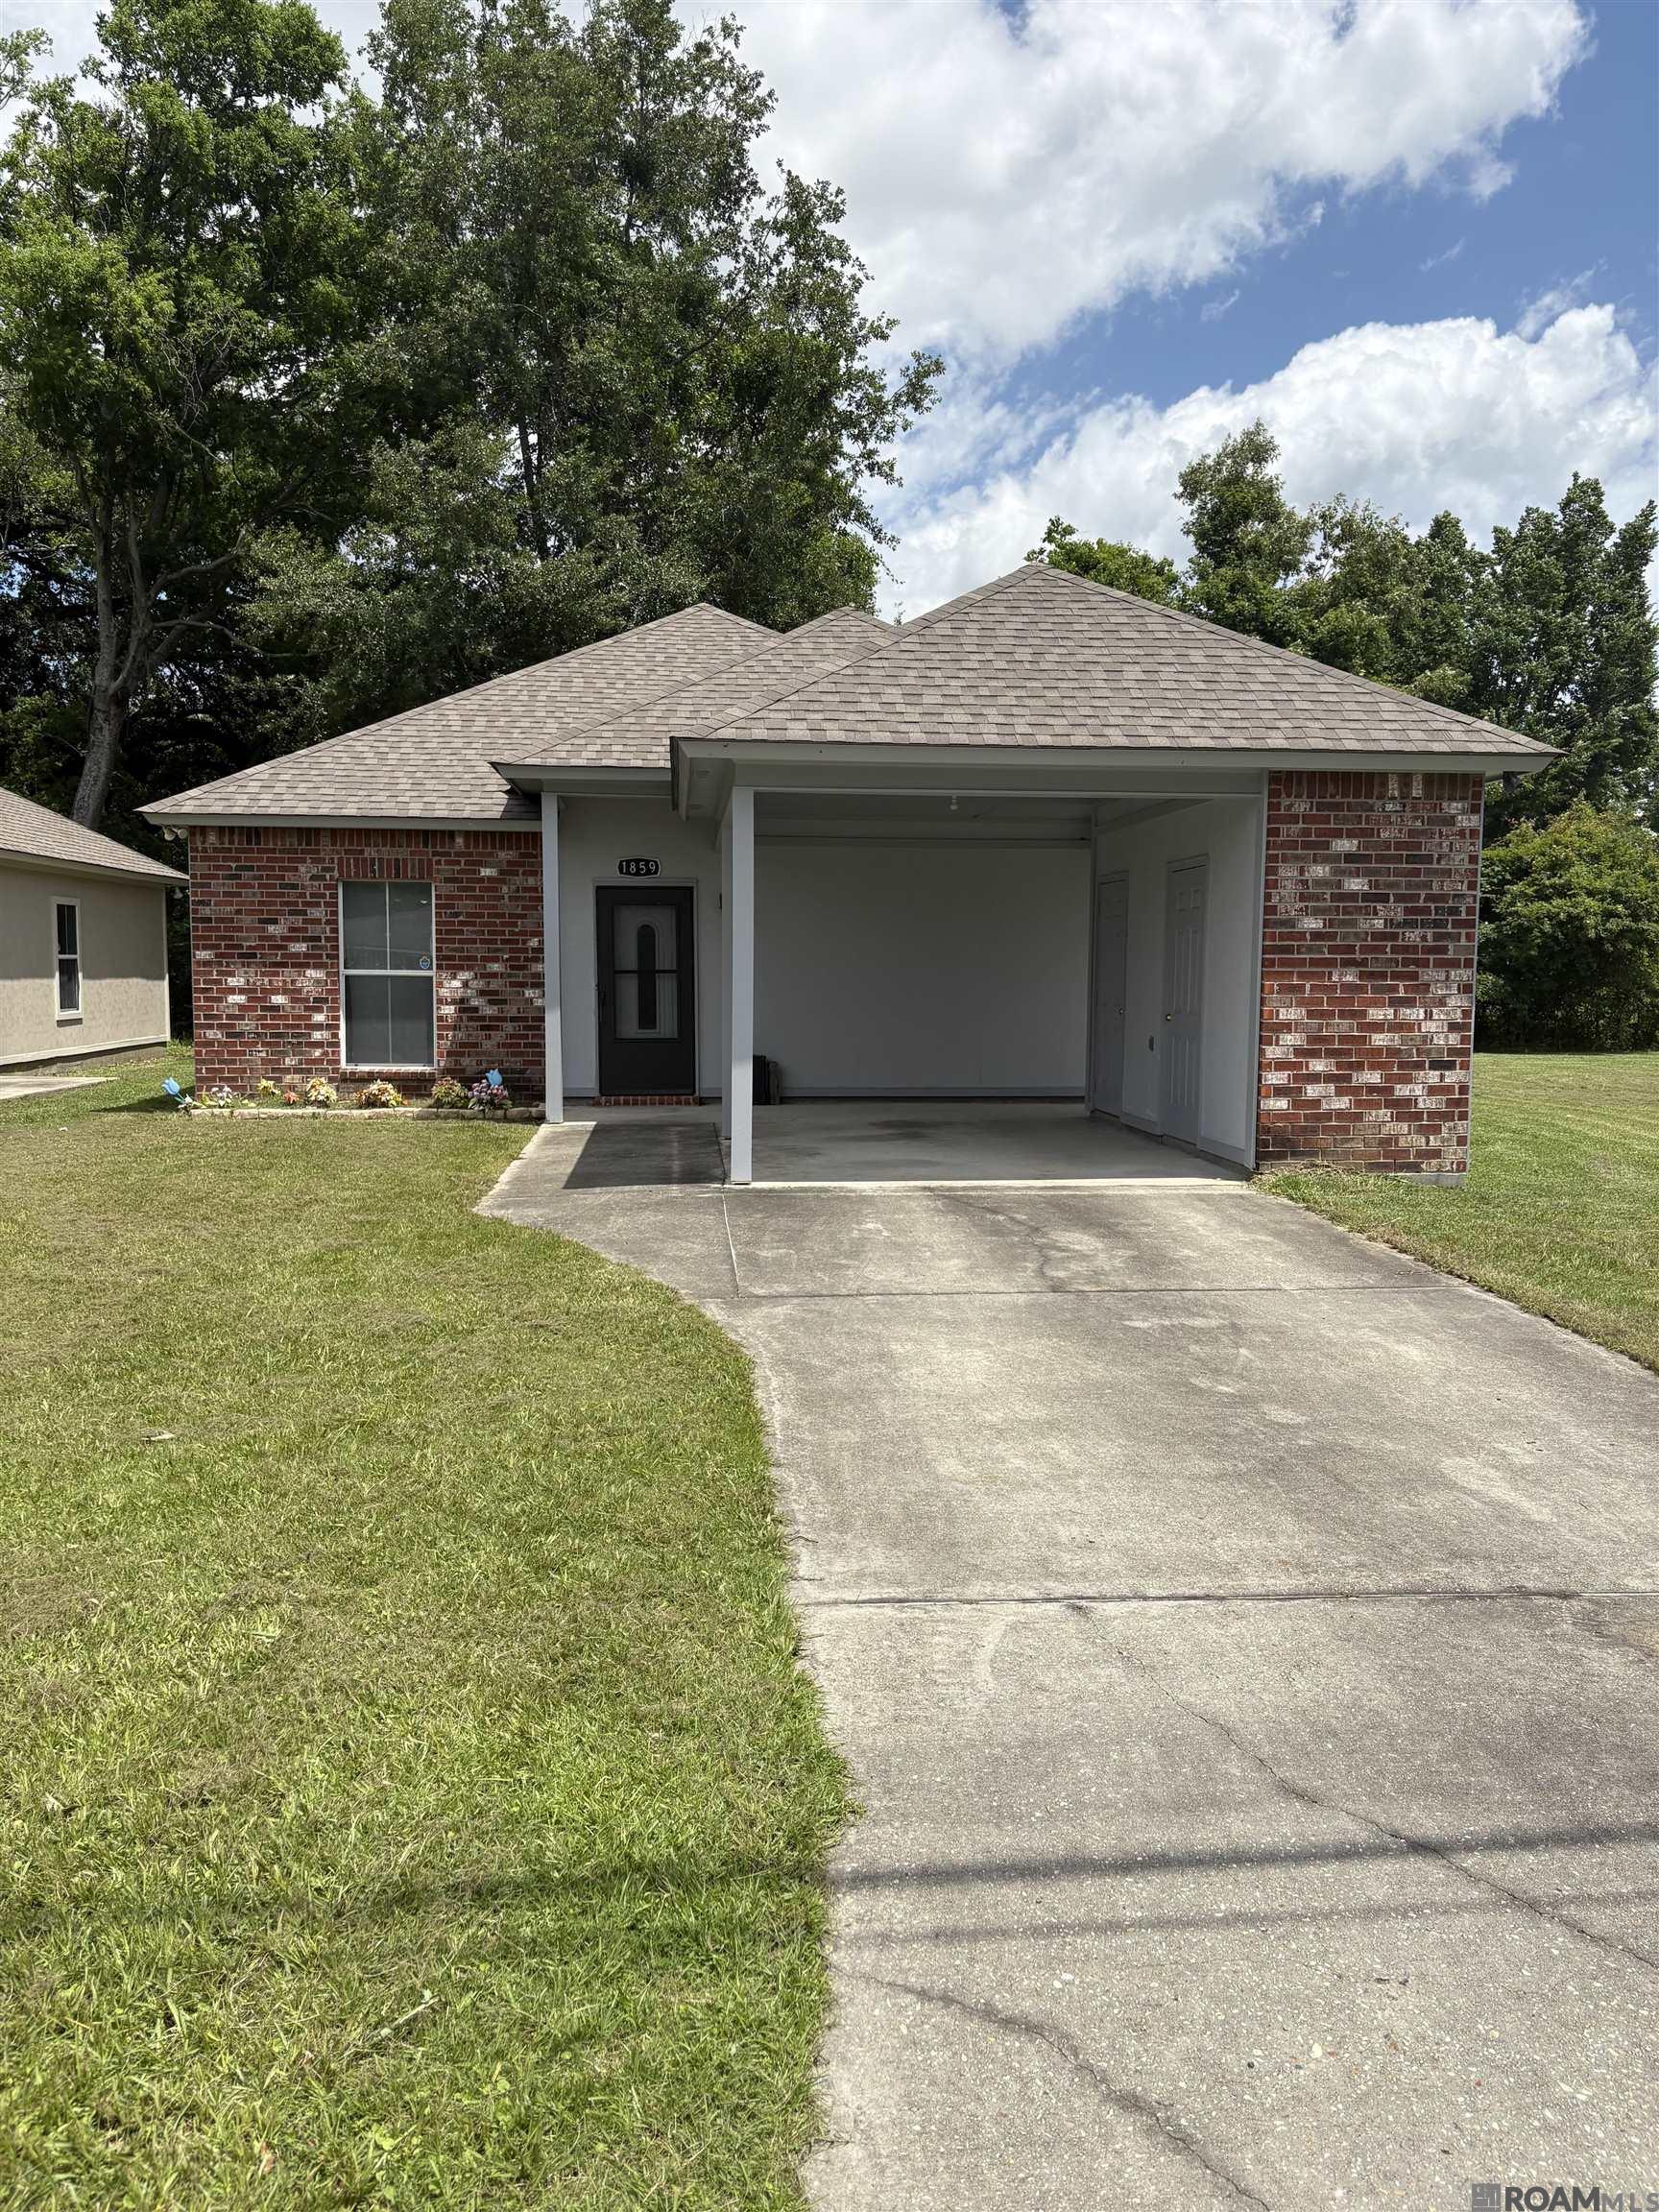
Active
$165,000
3
bds
|
2
ba
|
1,190
sqft
|
built
2010
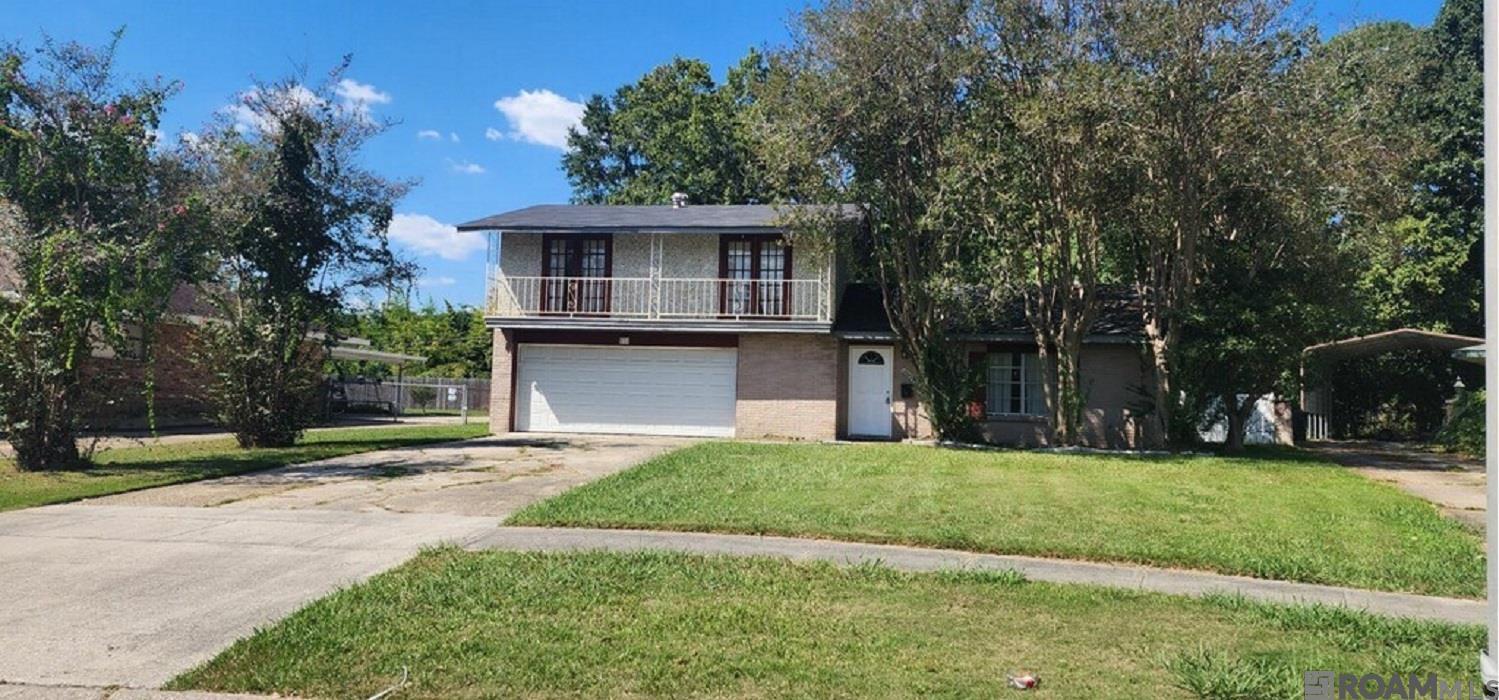
1859 69th Ave, Baton Rouge, LA 70807
$102
Cash flow
3.2%
Cash-on-Cash Return
7.0%
Cap rate
0.8%
Rent to Value Ratio
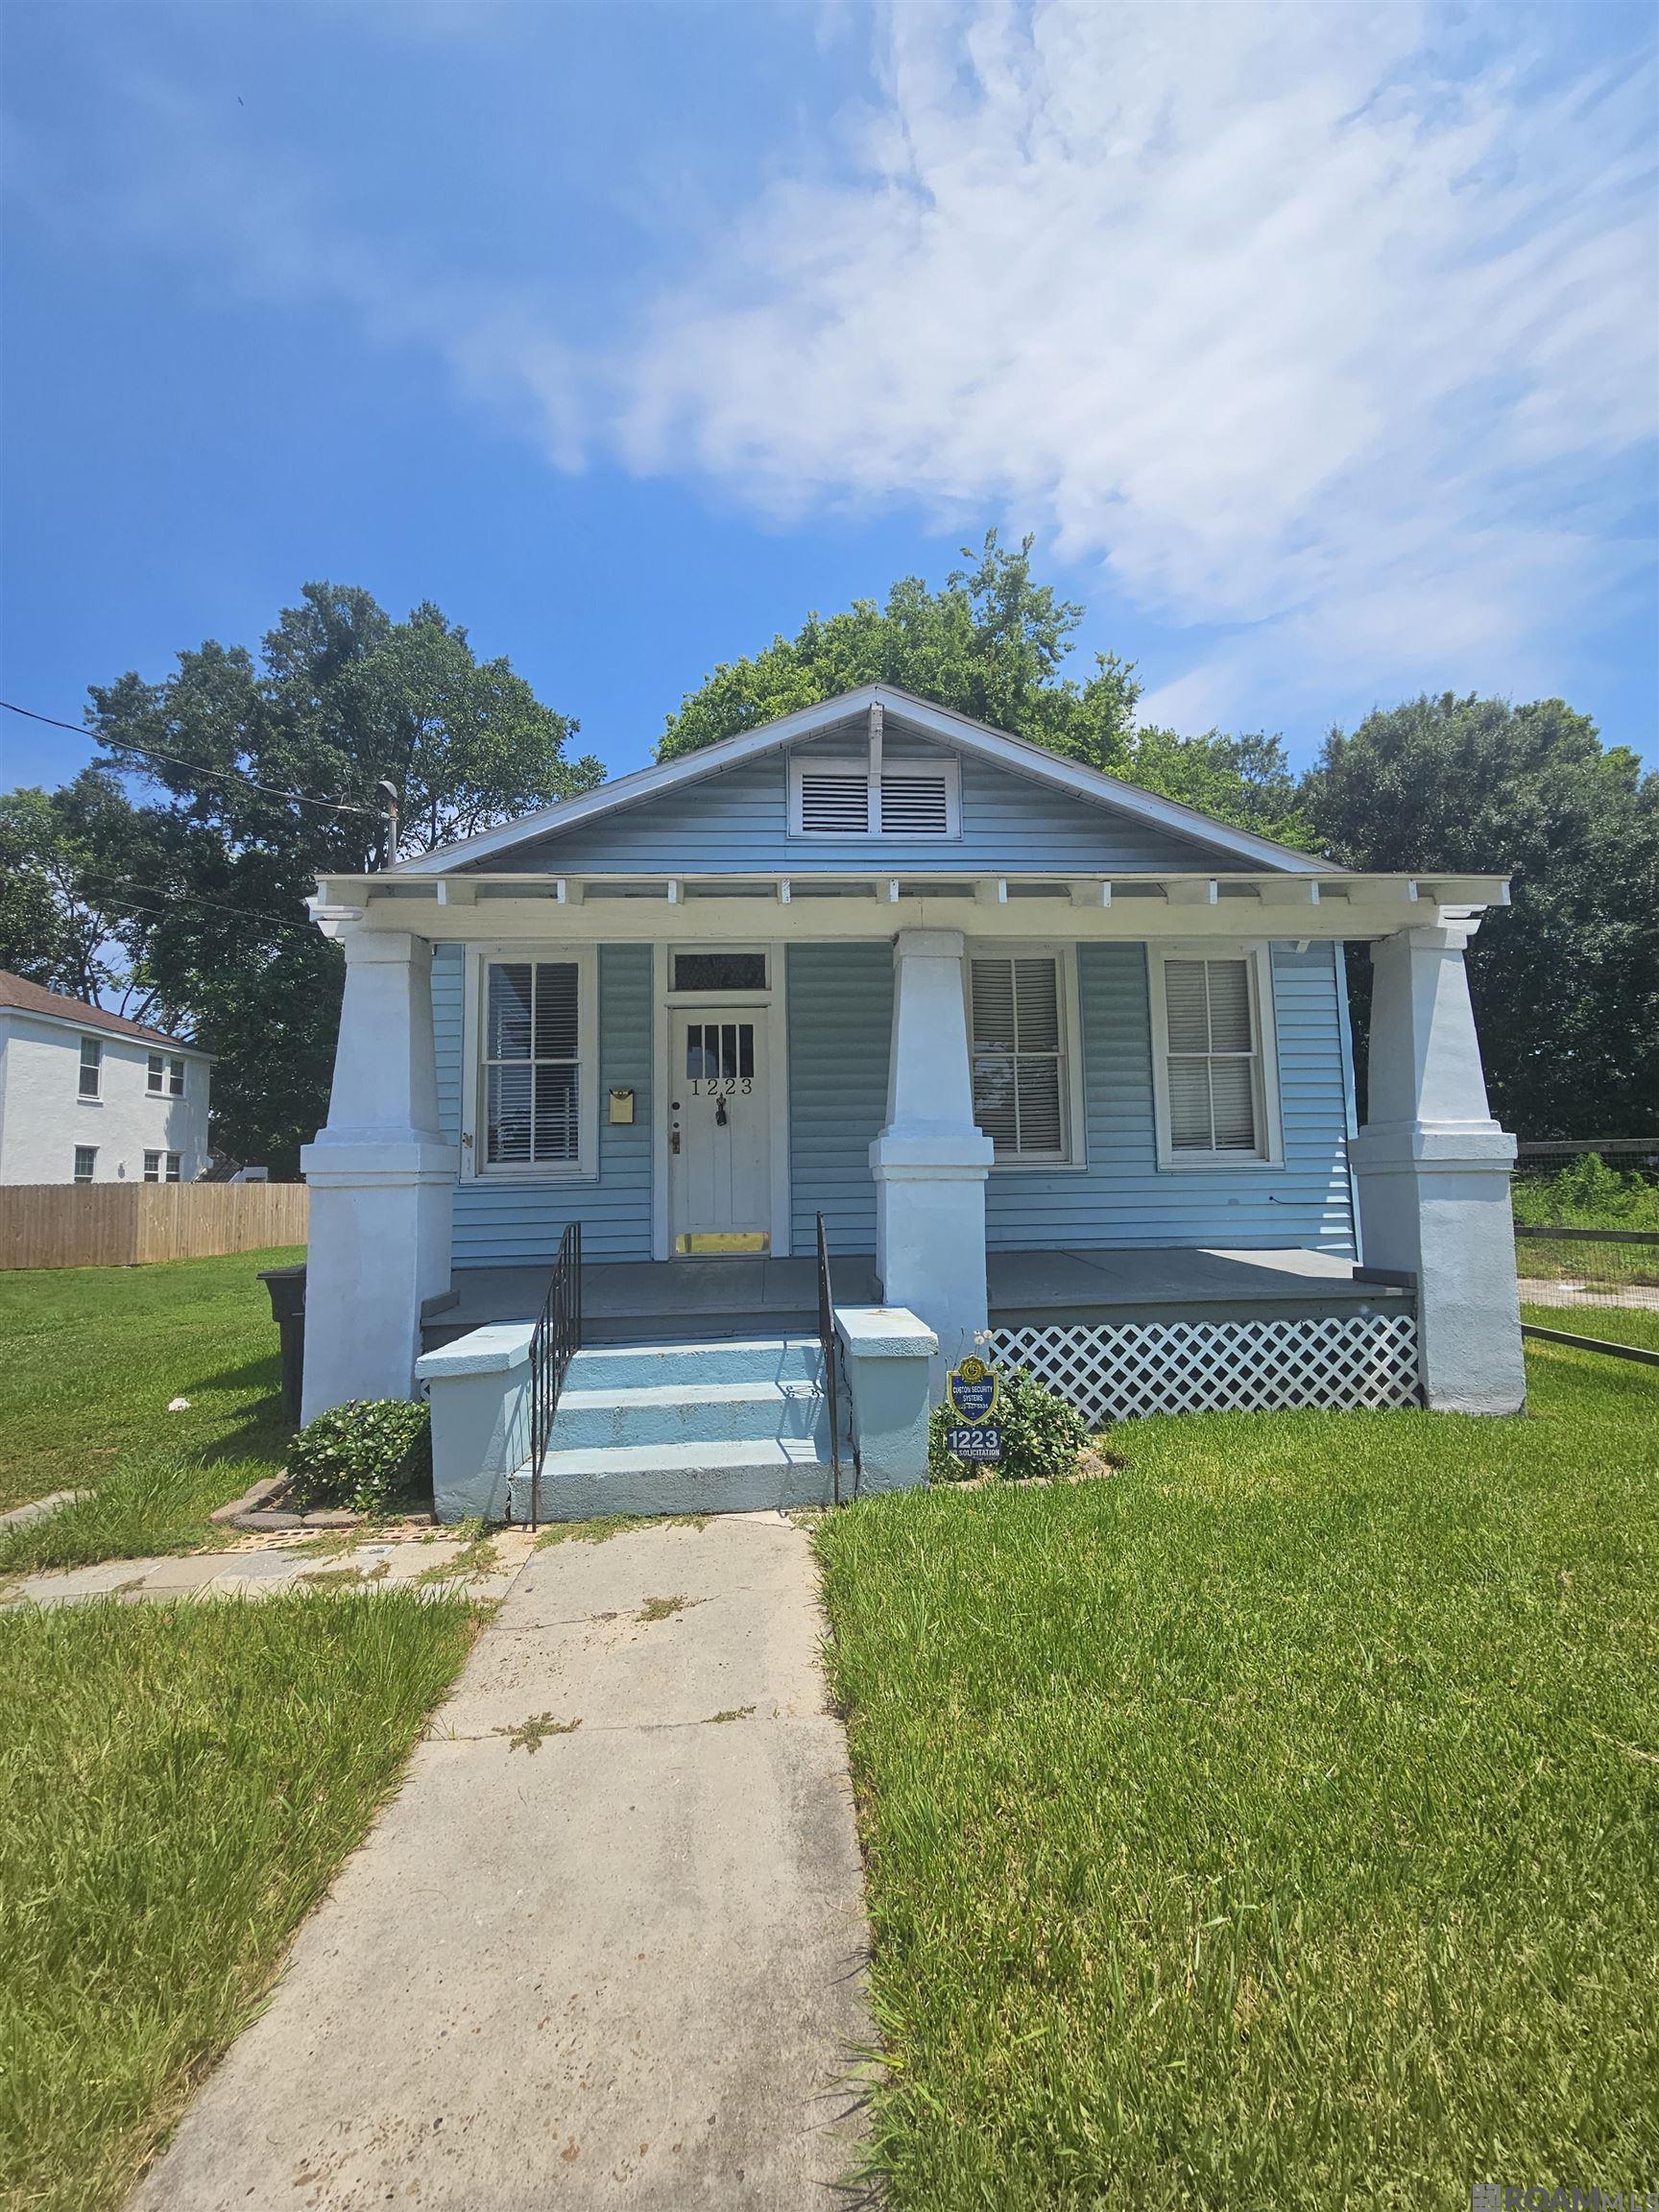
Active
$128,000
3
bds
|
1
ba
|
1,229
sqft
|
built
1923
1223 Convention St, Baton Rouge, LA 70802
$20
Cash flow
0.8%
Cash-on-Cash Return
6.5%
Cap rate
0.8%
Rent to Value Ratio

Active
$345,000
3
bds
|
3
ba
|
2,216
sqft
|
built
1975
245 Rue De Laplace, Baton Rouge, LA 70810
$-86
Cash flow
-1.3%
Cash-on-Cash Return
6.0%
Cap rate
0.7%
Rent to Value Ratio
Active
$280,000
3
bds
|
1
ba
|
1,480
sqft
|
built
1945
2151 Stanford Ave, Baton Rouge, LA 70808
$-86
Cash flow
-1.6%
Cash-on-Cash Return
5.9%
Cap rate
0.7%
Rent to Value Ratio
Active
$255,000
4
bds
|
2
ba
|
1,710
sqft
|
built
1978
10032 Mint Dr, Baton Rouge, LA 70809
$41
Cash flow
0.8%
Cash-on-Cash Return
6.5%
Cap rate
0.8%
Rent to Value Ratio
Active
$279,900
3
bds
|
2
ba
|
1,932
sqft
|
built
1960
437 Cora Dr, Baton Rouge, LA 70815
$-89
Cash flow
-1.7%
Cash-on-Cash Return
5.9%
Cap rate
0.7%
Rent to Value Ratio
Active
$200,000
3
bds
|
1
ba
|
1,640
sqft
|
built
1975
259 W Parkland Dr, Baton Rouge, LA 70806
$57
Cash flow
1.5%
Cash-on-Cash Return
6.6%
Cap rate
0.8%
Rent to Value Ratio
Active
$649,900
3
bds
|
3
ba
|
2,104
sqft
|
built
1980
1035 Claiborne Rd, Baton Rouge, LA 70810
$-1,195
Cash flow
-9.6%
Cash-on-Cash Return
4.1%
Cap rate
0.5%
Rent to Value Ratio
Active
$425,000
4
bds
|
2
ba
|
1,995
sqft
|
built
2022
3006 Creekstone Way, Baton Rouge, LA 70810
$-377
Cash flow
-4.6%
Cash-on-Cash Return
5.2%
Cap rate
0.7%
Rent to Value Ratio
Active
$995,000
5
bds
|
3
ba
|
4,114
sqft
|
built
1997
17230 N Lakeway Ave, Baton Rouge, LA 70810
$-3,002
Cash flow
-15.7%
Cash-on-Cash Return
2.7%
Cap rate
0.4%
Rent to Value Ratio
Active
$789,500
4
bds
|
3
ba
|
2,780
sqft
|
built
2015
11520 Ancestors Dr, Baton Rouge, LA 70810
$-1,158
Cash flow
-7.7%
Cash-on-Cash Return
4.5%
Cap rate
0.6%
Rent to Value Ratio
Active
$319,000
2
bds
|
1
ba
|
1,480
sqft
|
built
1971
1313 S Eugene St, Baton Rouge, LA 70806
$-429
Cash flow
-7.0%
Cash-on-Cash Return
4.7%
Cap rate
0.6%
Rent to Value Ratio
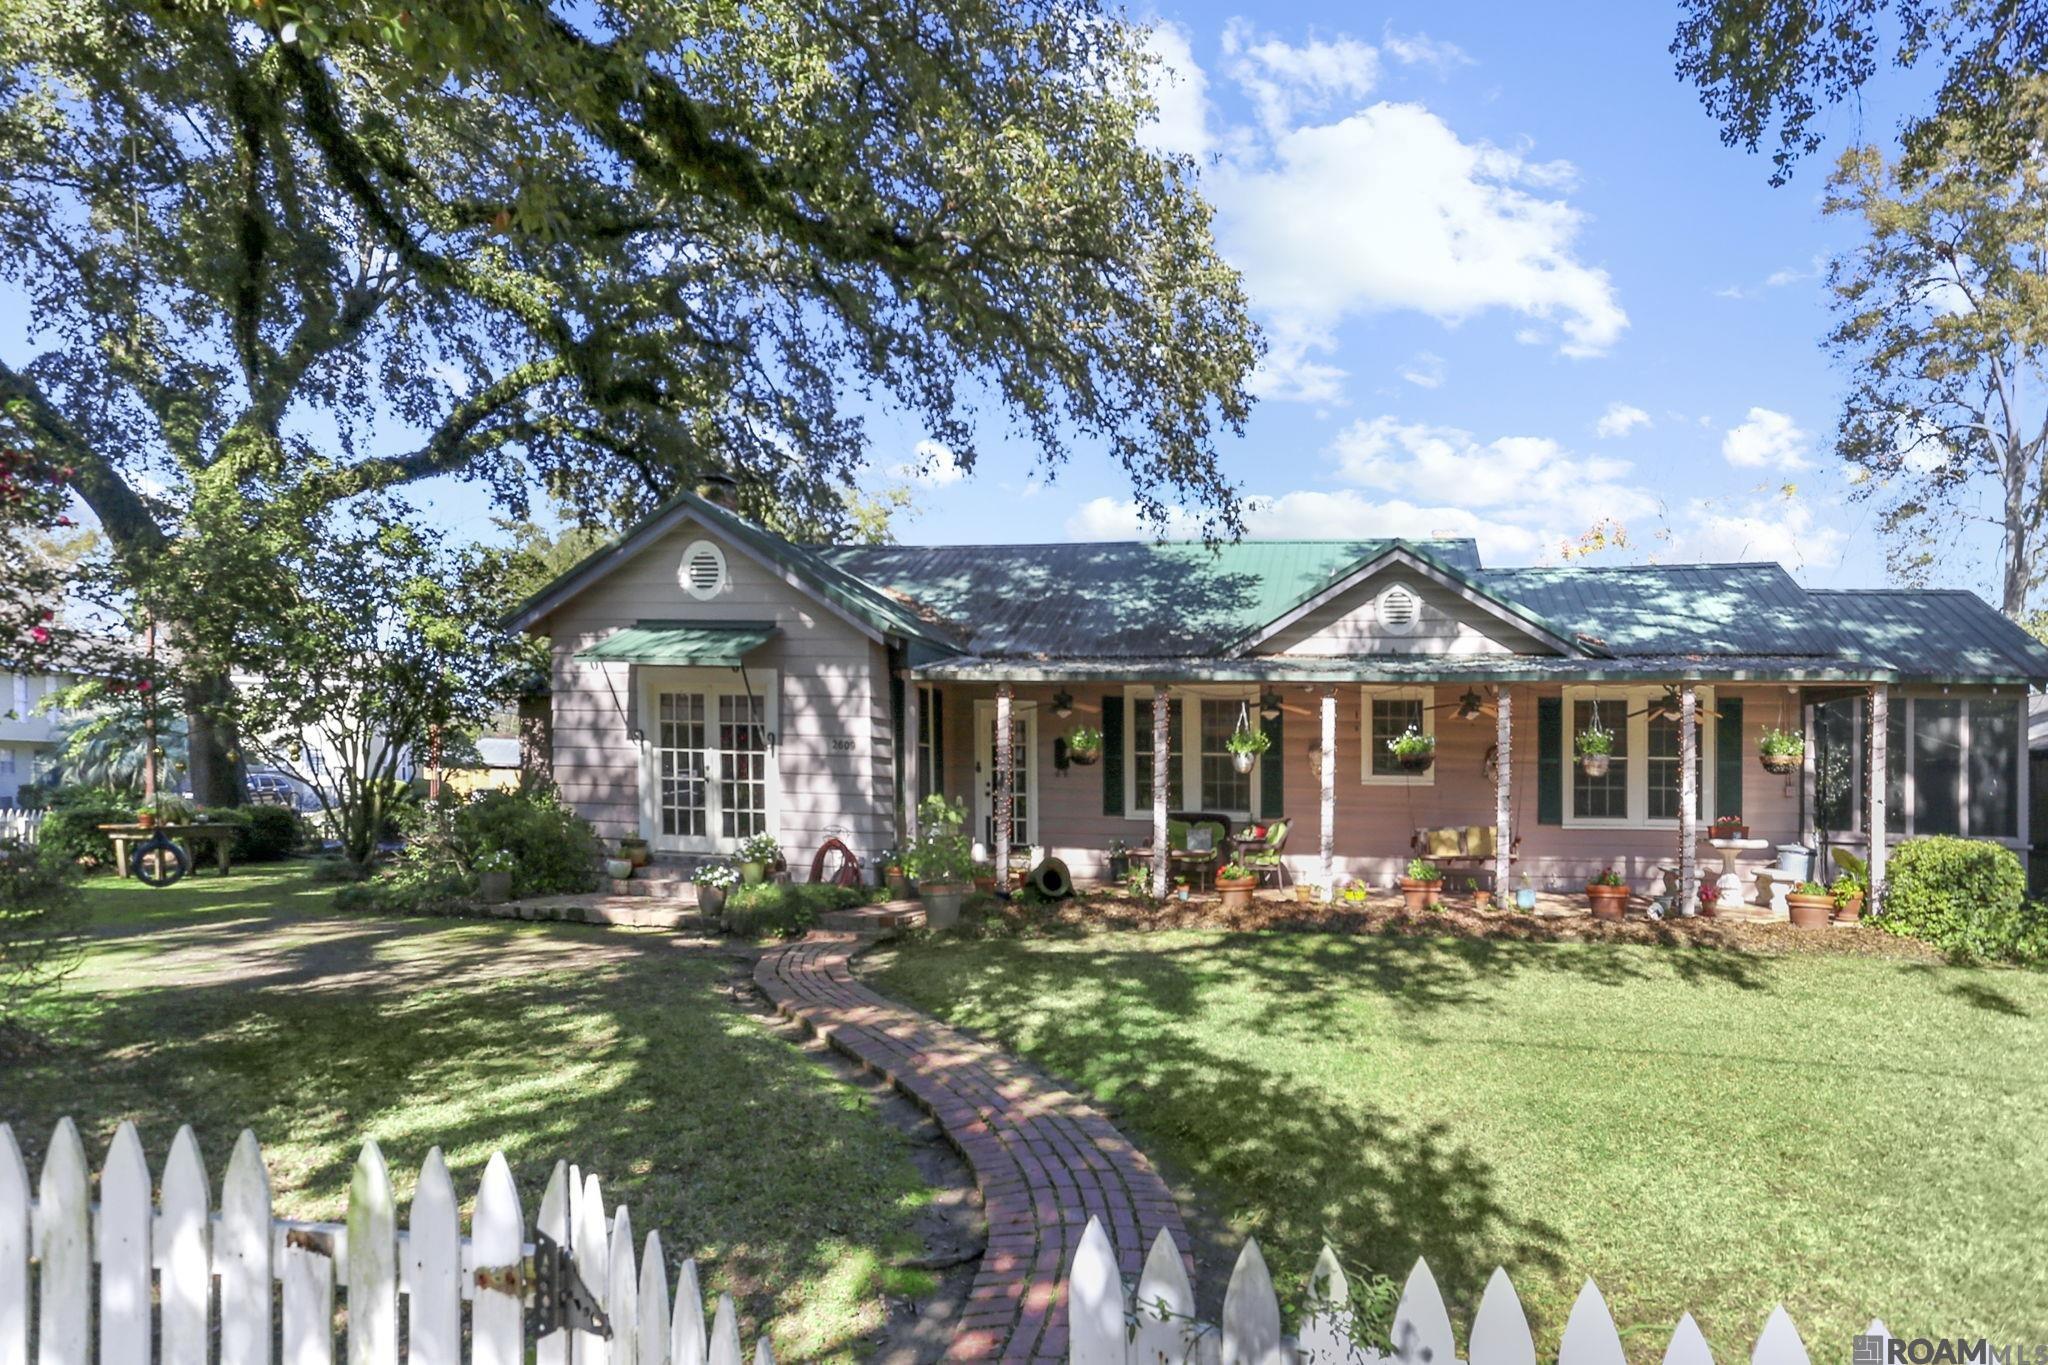
Active
$550,000
4
bds
|
3
ba
|
2,403
sqft
|
built
1970
2609 Reymond Ave, Baton Rouge, LA 70808
$-672
Cash flow
-6.4%
Cash-on-Cash Return
4.8%
Cap rate
0.6%
Rent to Value Ratio
Active
$1,195,000
4
bds
|
3
ba
|
3,256
sqft
|
built
1956
7375 Boyce Dr, Baton Rouge, LA 70809
$-1,982
Cash flow
-8.7%
Cash-on-Cash Return
4.3%
Cap rate
0.5%
Rent to Value Ratio
Active under contract
$555,000
4
bds
|
4
ba
|
2,820
sqft
|
built
2000
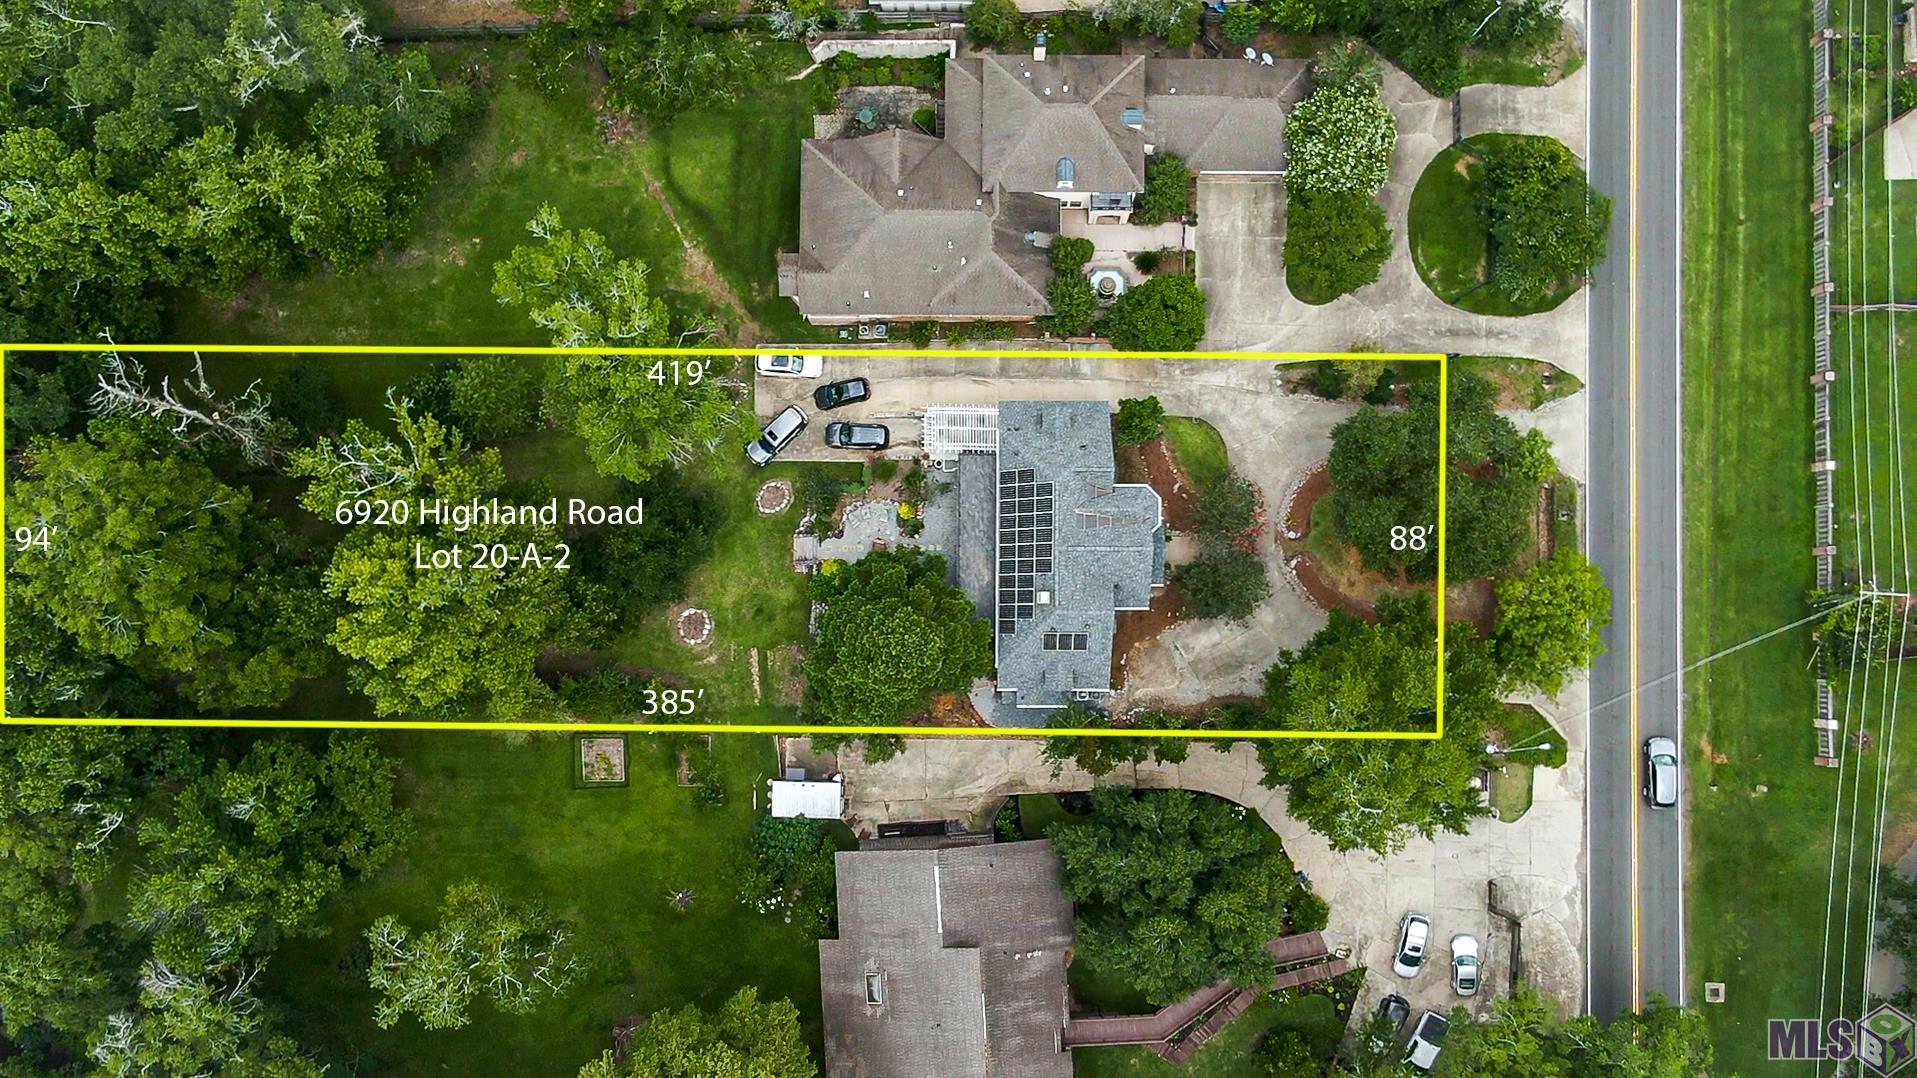
6920 Highland Rd, Baton Rouge, LA 70808
$-491
Cash flow
-4.6%
Cash-on-Cash Return
5.2%
Cap rate
0.6%
Rent to Value Ratio
Active
$583,000
3
bds
|
3
ba
|
2,205
sqft
|
built
2015
7037 Etage Ct, Baton Rouge, LA 70806
$-1,020
Cash flow
-9.1%
Cash-on-Cash Return
4.2%
Cap rate
0.5%
Rent to Value Ratio

Active
$325,000
5
bds
|
4
ba
|
3,028
sqft
|
built
1972
10588 Goodwood Blvd, Baton Rouge, LA 70815
$23
Cash flow
0.4%
Cash-on-Cash Return
6.4%
Cap rate
0.8%
Rent to Value Ratio
Active
$279,900
4
bds
|
3
ba
|
2,163
sqft
|
built
1990
12223 Astolat Ave, Baton Rouge, LA 70816
$-86
Cash flow
-1.6%
Cash-on-Cash Return
5.9%
Cap rate
0.7%
Rent to Value Ratio

Active
$314,900
2
bds
|
3
ba
|
1,573
sqft
|
built
2018
5066 Myrtle Trail Dr, Baton Rouge, LA 70820
$-670
Cash flow
-11.1%
Cash-on-Cash Return
3.7%
Cap rate
0.5%
Rent to Value Ratio
Active
$424,900
4
bds
|
3
ba
|
2,265
sqft
|
built
2023
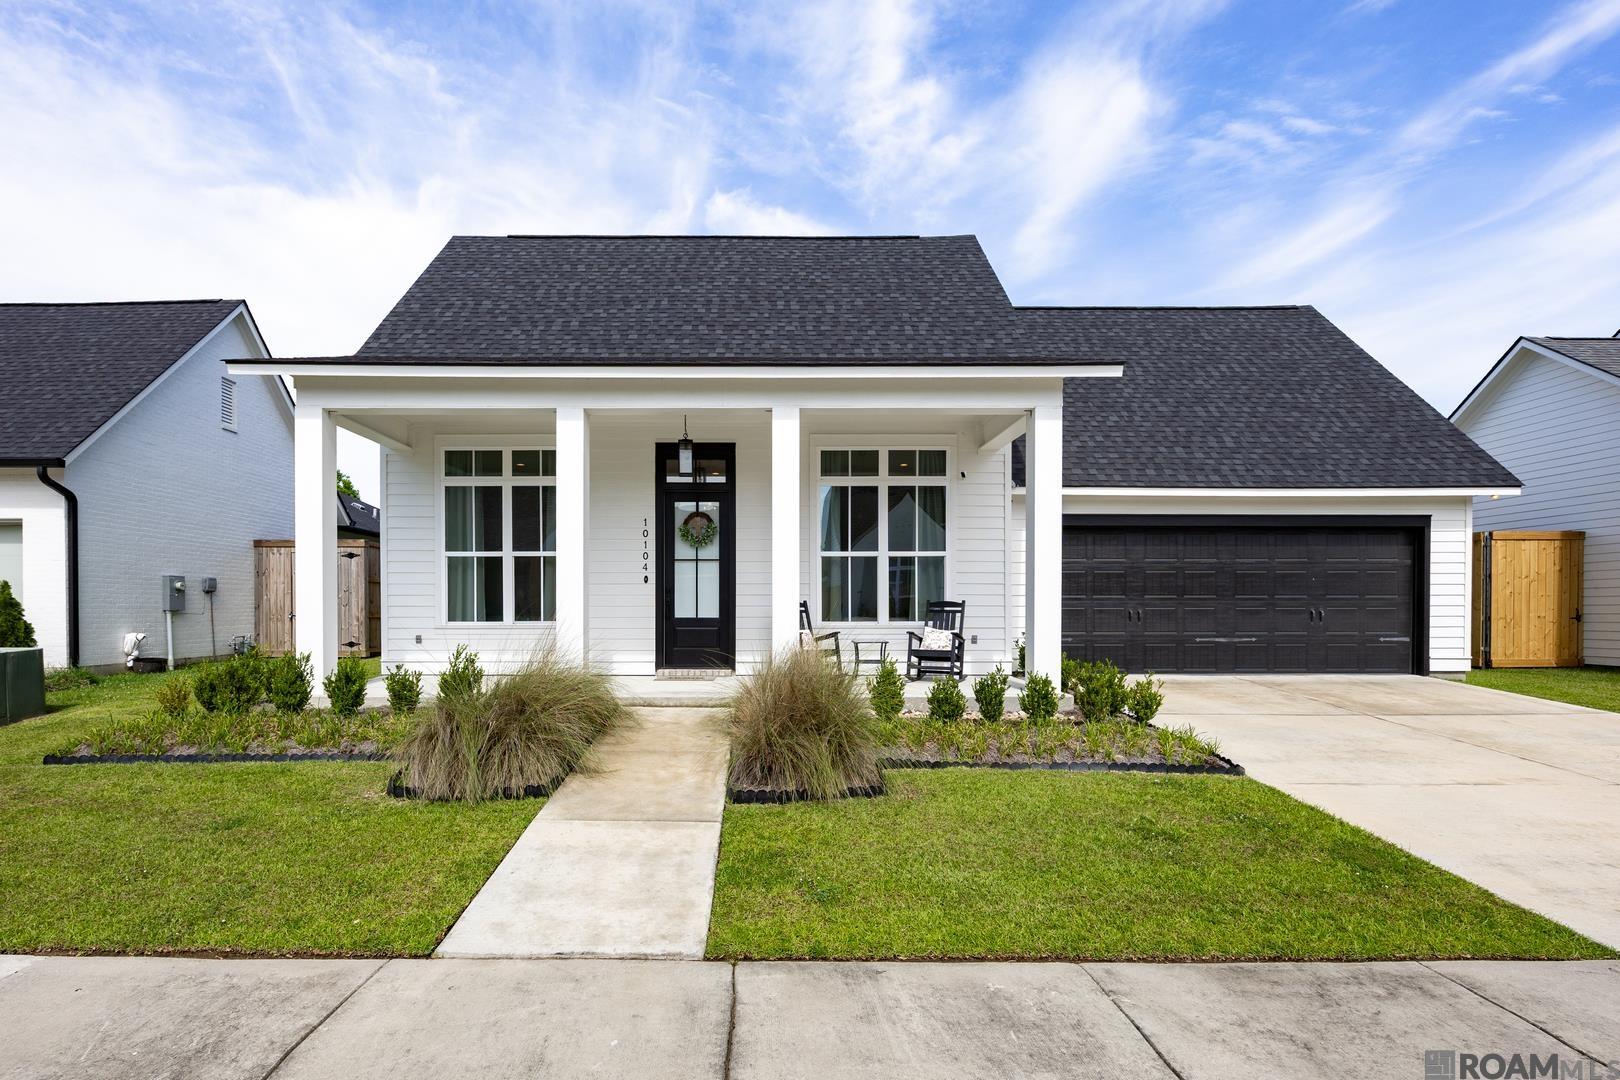
10104 Clarks Ferry Dr, Baton Rouge, LA 70817
$-360
Cash flow
-4.4%
Cash-on-Cash Return
5.3%
Cap rate
0.7%
Rent to Value Ratio
Active
$685,000
4
bds
|
3
ba
|
2,900
sqft
|
built
1960
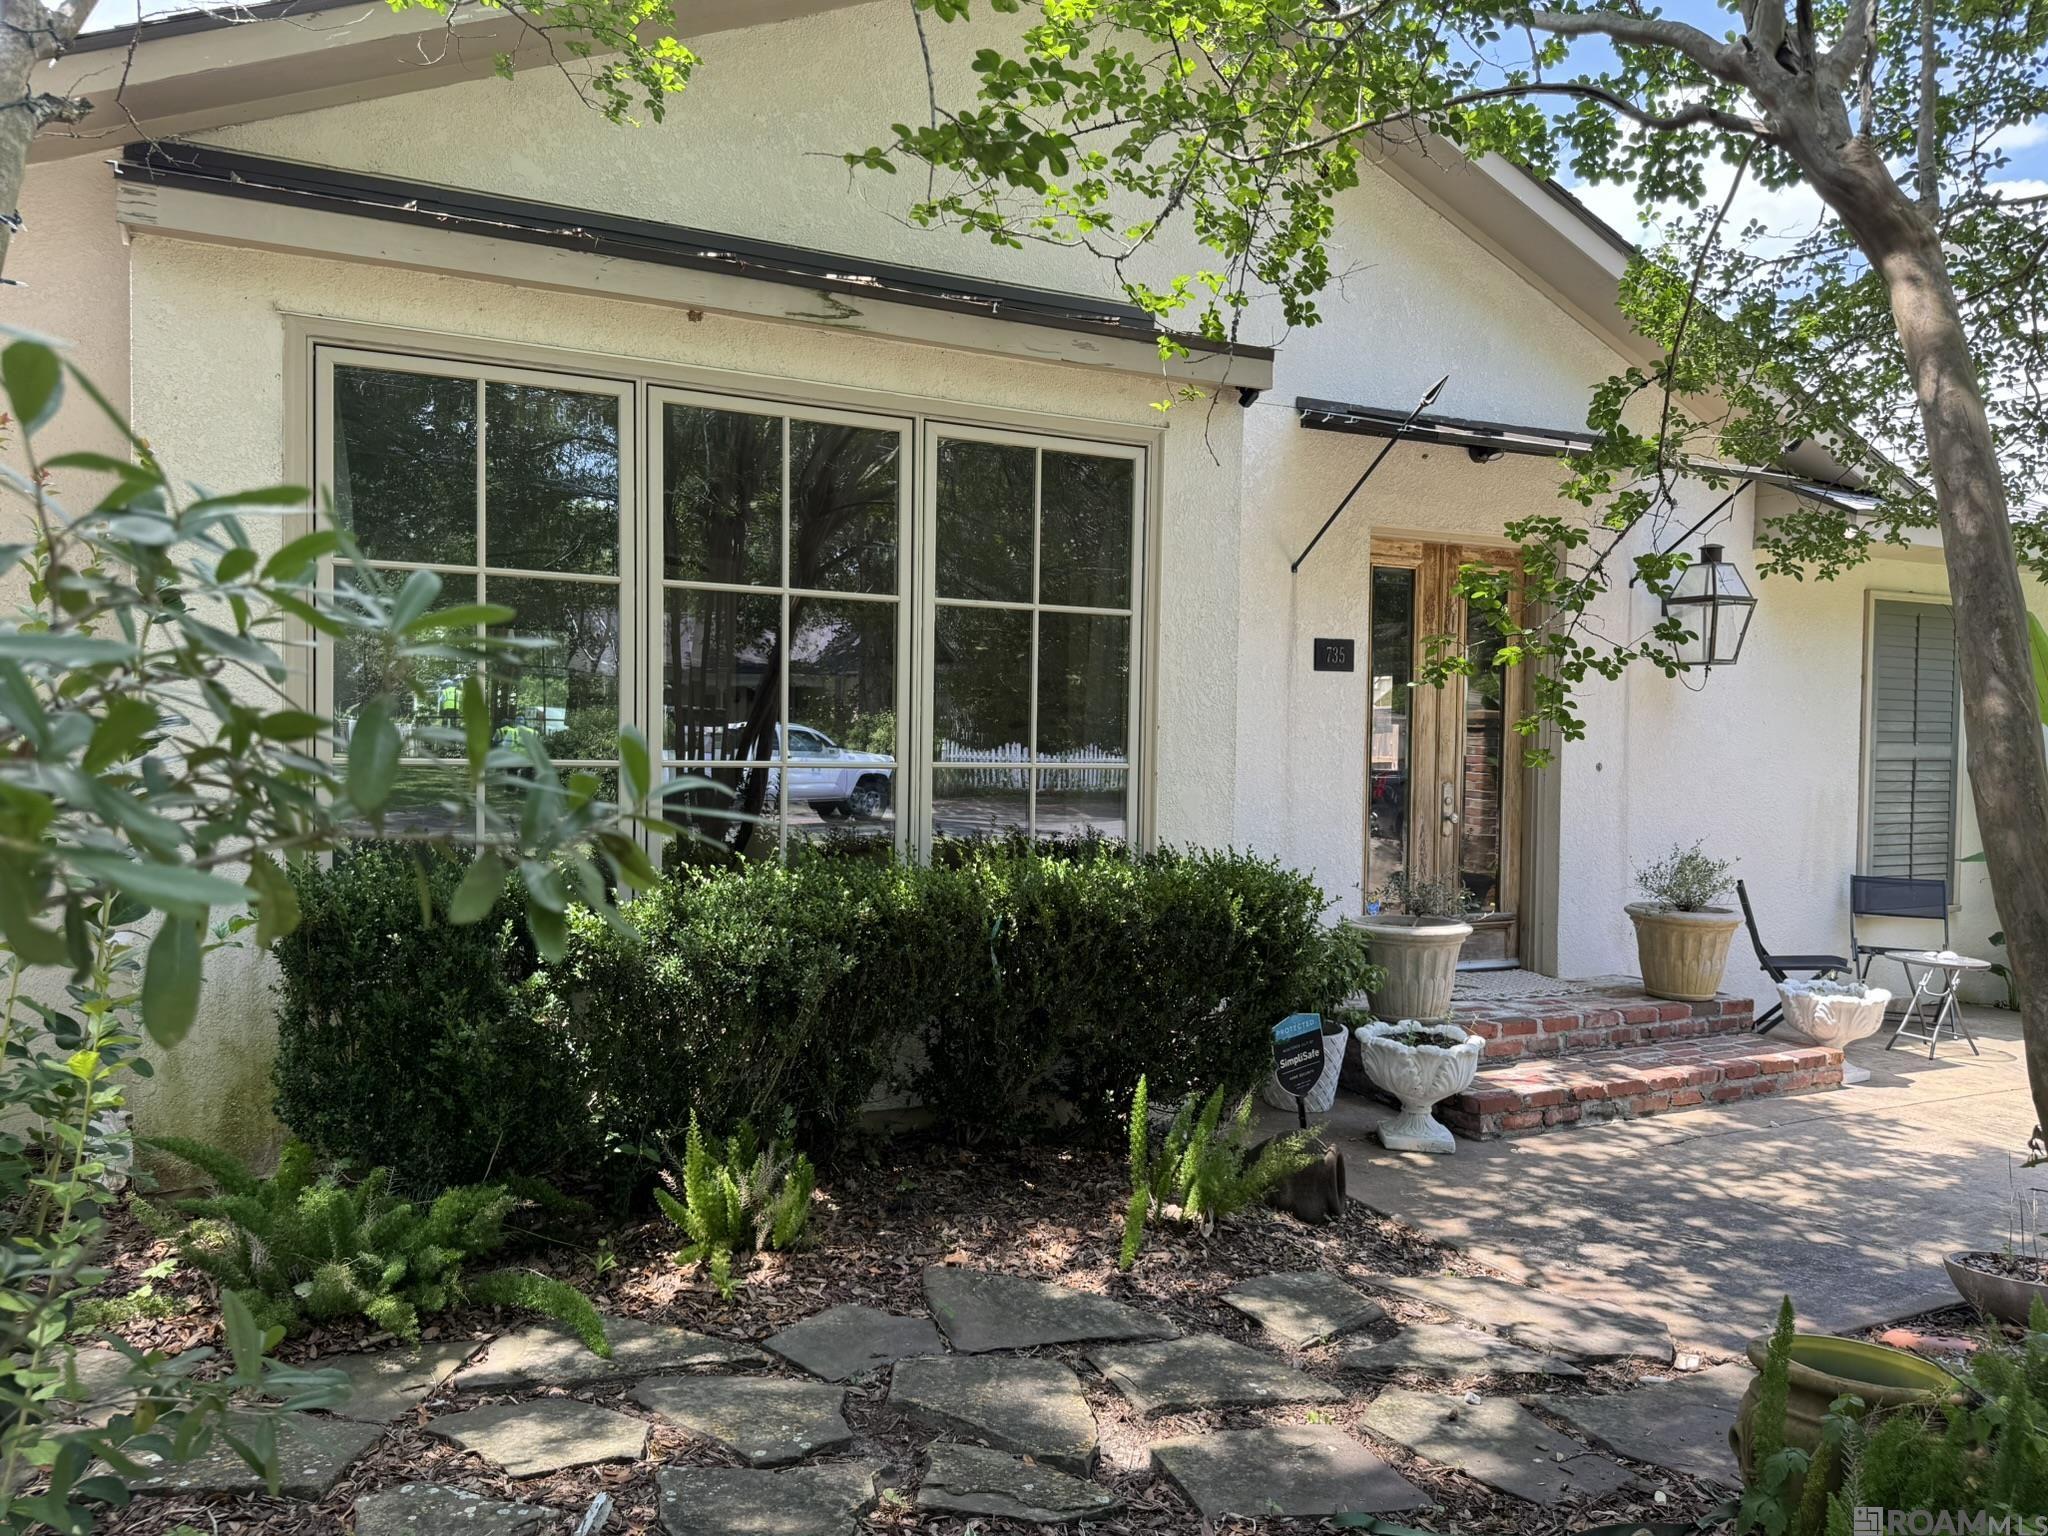
735 Dubois Dr, Baton Rouge, LA 70808
$-1,103
Cash flow
-8.4%
Cash-on-Cash Return
4.4%
Cap rate
0.5%
Rent to Value Ratio
Active
$199,000
4
bds
|
4
ba
|
2,450
sqft
|
built
1961
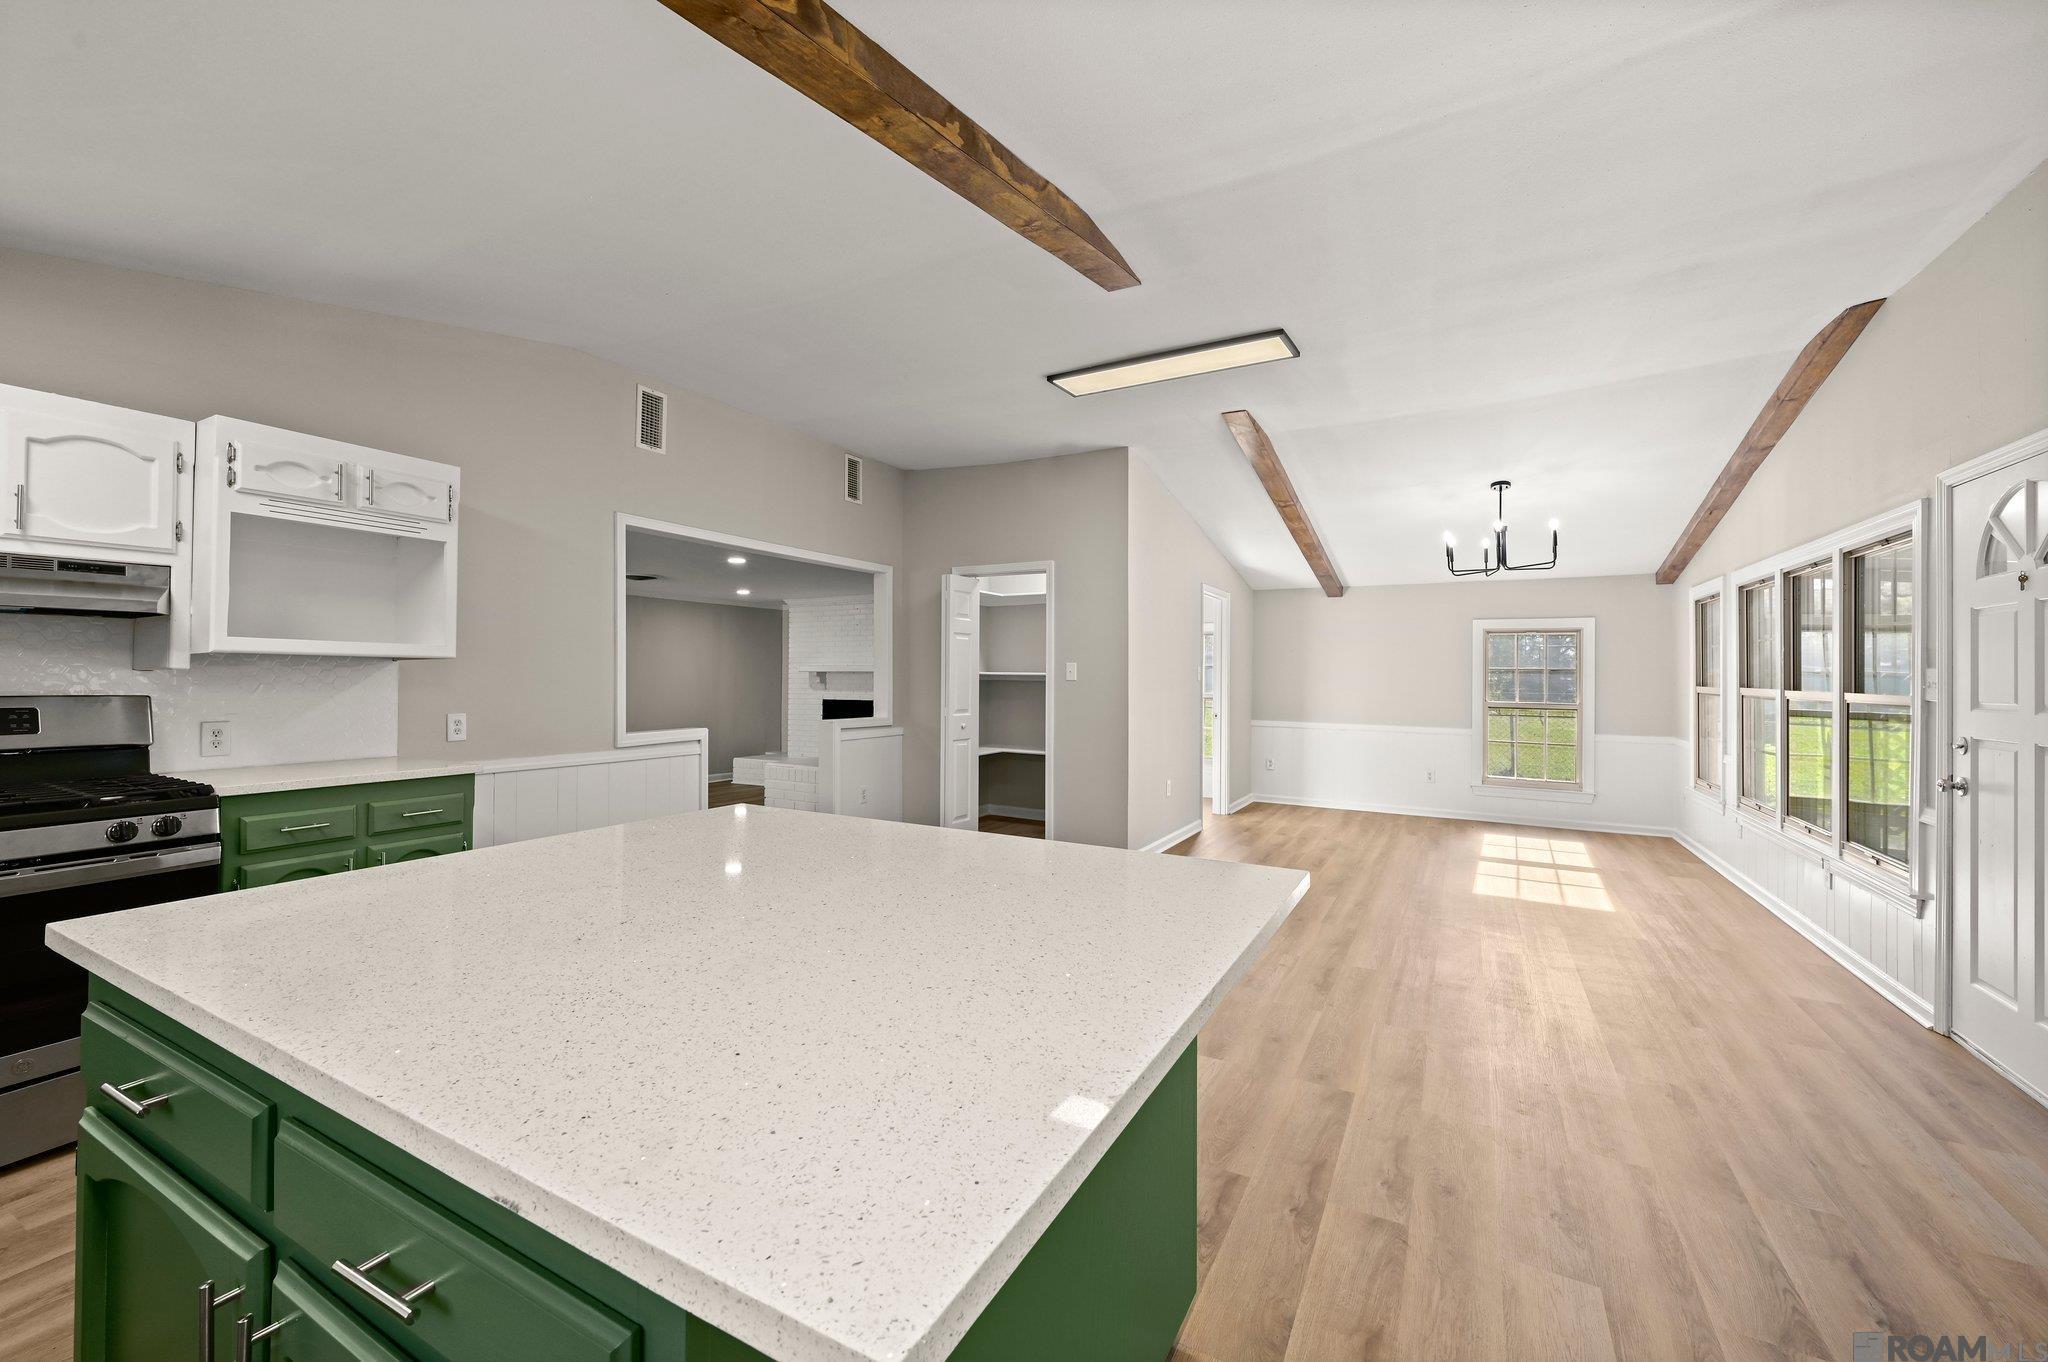
824 Princewood Ct, Baton Rouge, LA 70806
$200
Cash flow
5.2%
Cash-on-Cash Return
7.5%
Cap rate
0.9%
Rent to Value Ratio
Active
$252,000
4
bds
|
3
ba
|
2,669
sqft
|
built
1974
6580 Brownfields Dr, Baton Rouge, LA 70811
$60
Cash flow
1.2%
Cash-on-Cash Return
6.6%
Cap rate
0.8%
Rent to Value Ratio
Active
$189,995
3
bds
|
2
ba
|
2,090
sqft
|
built
1967
1133 Flora Ln, Baton Rouge, LA 70810
$247
Cash flow
6.8%
Cash-on-Cash Return
7.8%
Cap rate
0.9%
Rent to Value Ratio
Pending
$370,000
4
bds
|
3
ba
|
2,433
sqft
|
built
1980
1537 Oakdale Dr, Baton Rouge, LA 70810
$-213
Cash flow
-3.0%
Cash-on-Cash Return
5.6%
Cap rate
0.7%
Rent to Value Ratio
Active
$349,900
3
bds
|
2
ba
|
1,781
sqft
|
built
1998
5140 Summa Ct, Baton Rouge, LA 70809
$-149
Cash flow
-2.2%
Cash-on-Cash Return
5.8%
Cap rate
0.7%
Rent to Value Ratio
Pending
$218,000
4
bds
|
2
ba
|
1,356
sqft
|
built
1986
17531 Brookfield Ave, Baton Rouge, LA 70817
$100
Cash flow
2.4%
Cash-on-Cash Return
6.8%
Cap rate
0.8%
Rent to Value Ratio
Active
$259,900
3
bds
|
3
ba
|
2,140
sqft
|
built
2010
14031 Windwood Dr, Baton Rouge, LA 70816
$-14
Cash flow
-0.3%
Cash-on-Cash Return
6.2%
Cap rate
0.8%
Rent to Value Ratio
Pending
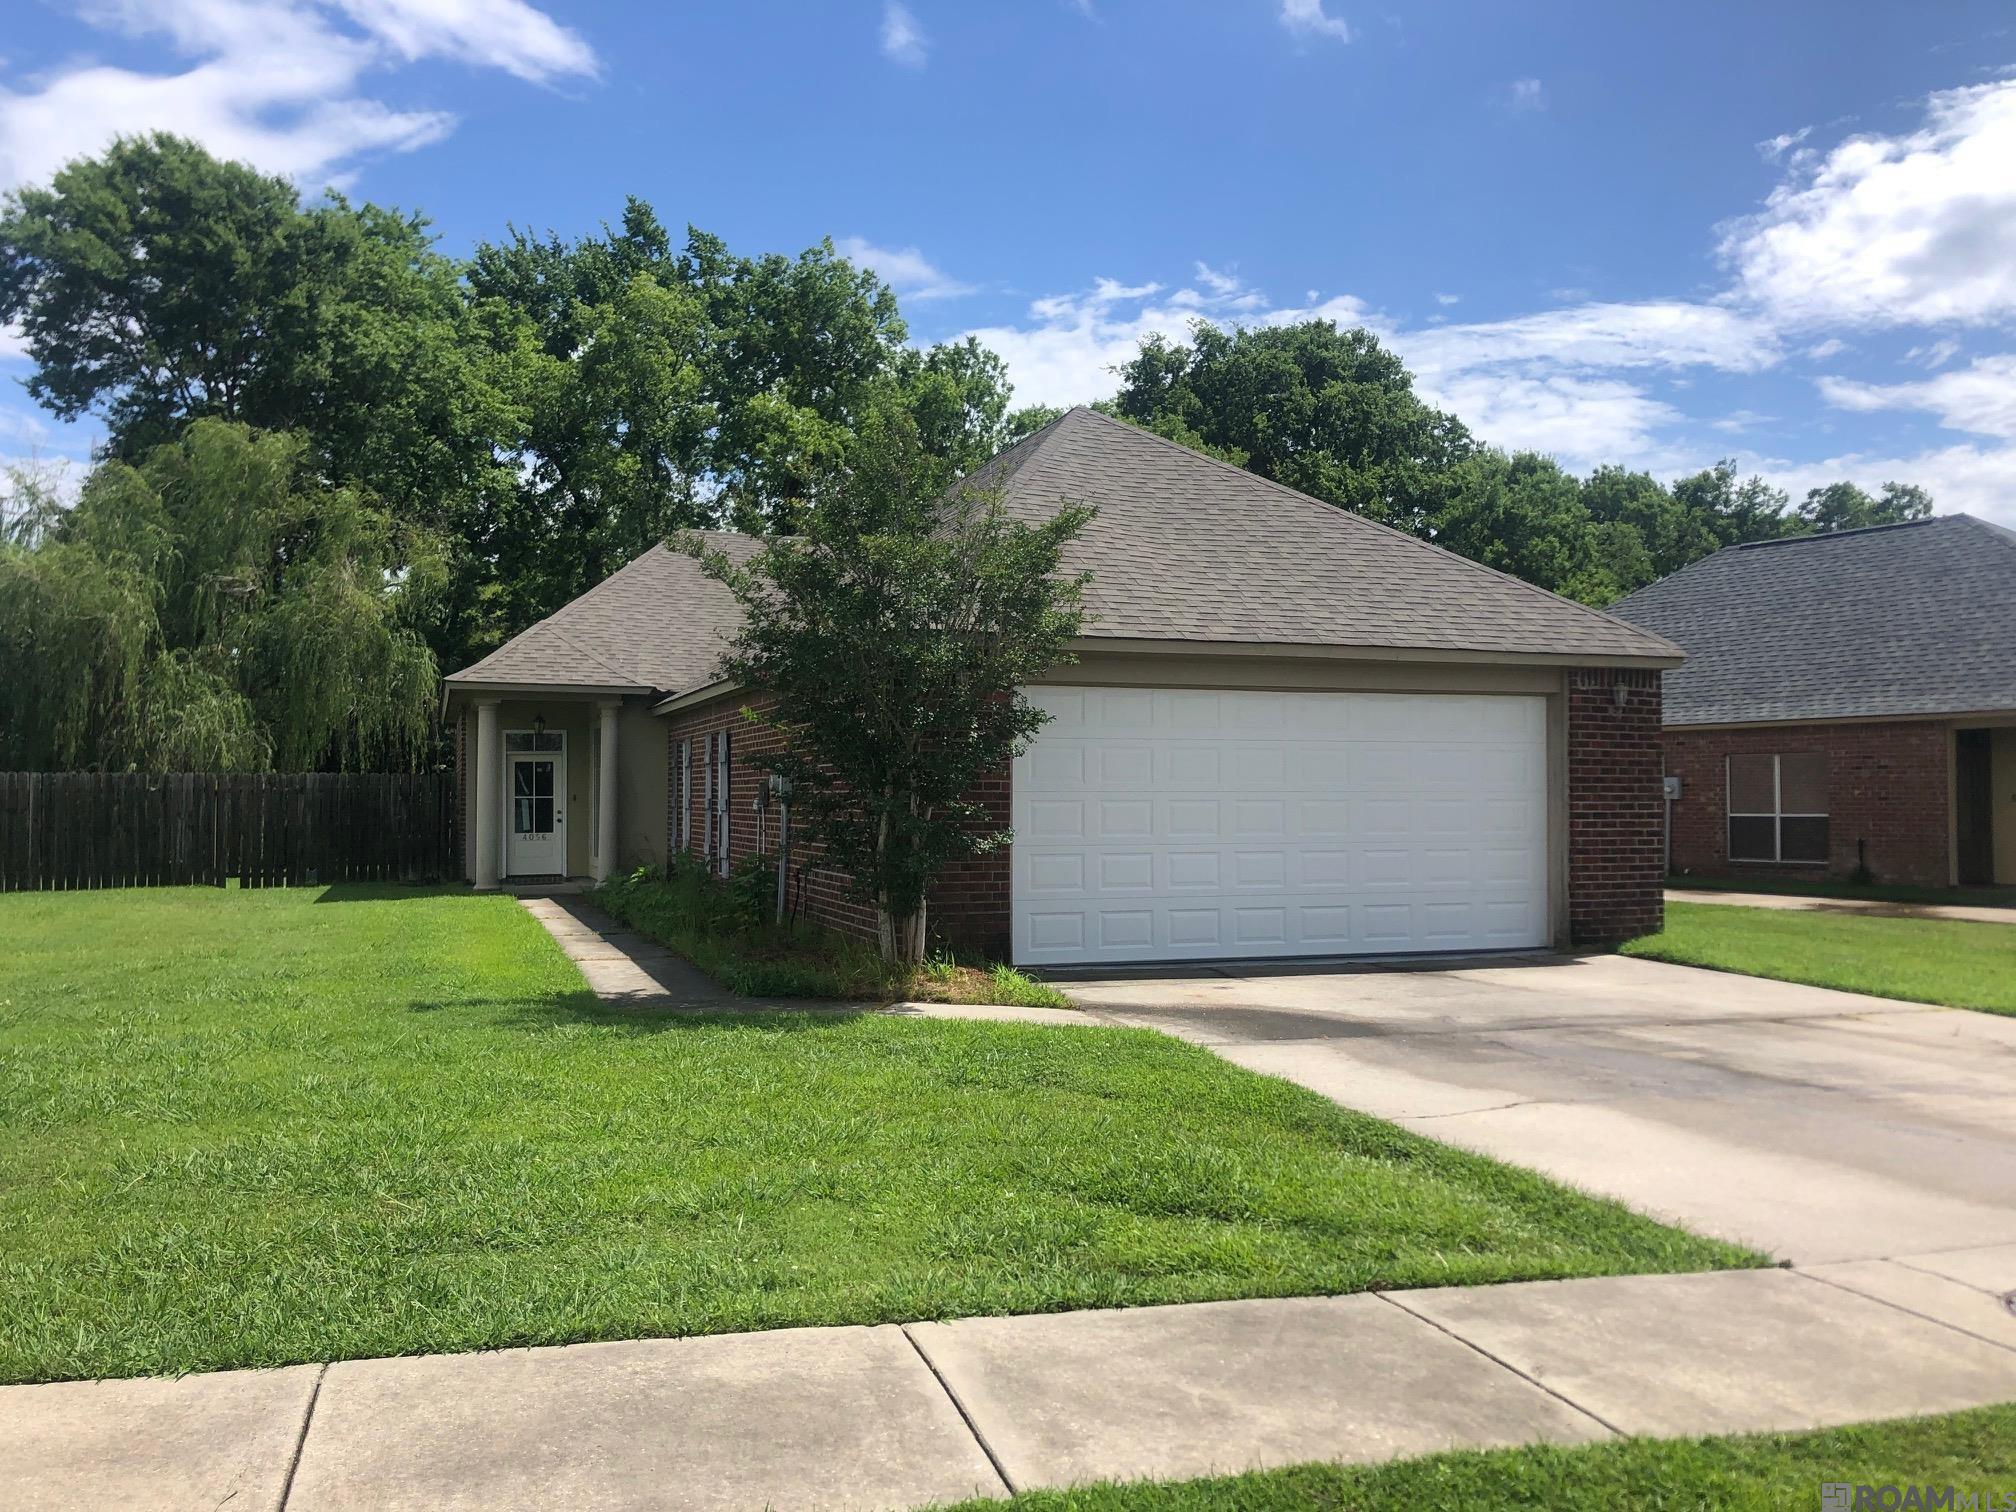
$240,000
3
bds
|
2
ba
|
1,520
sqft
|
built
2003
4056 Northshore Ave, Baton Rouge, LA 70820
$66
Cash flow
1.4%
Cash-on-Cash Return
6.6%
Cap rate
0.8%
Rent to Value Ratio
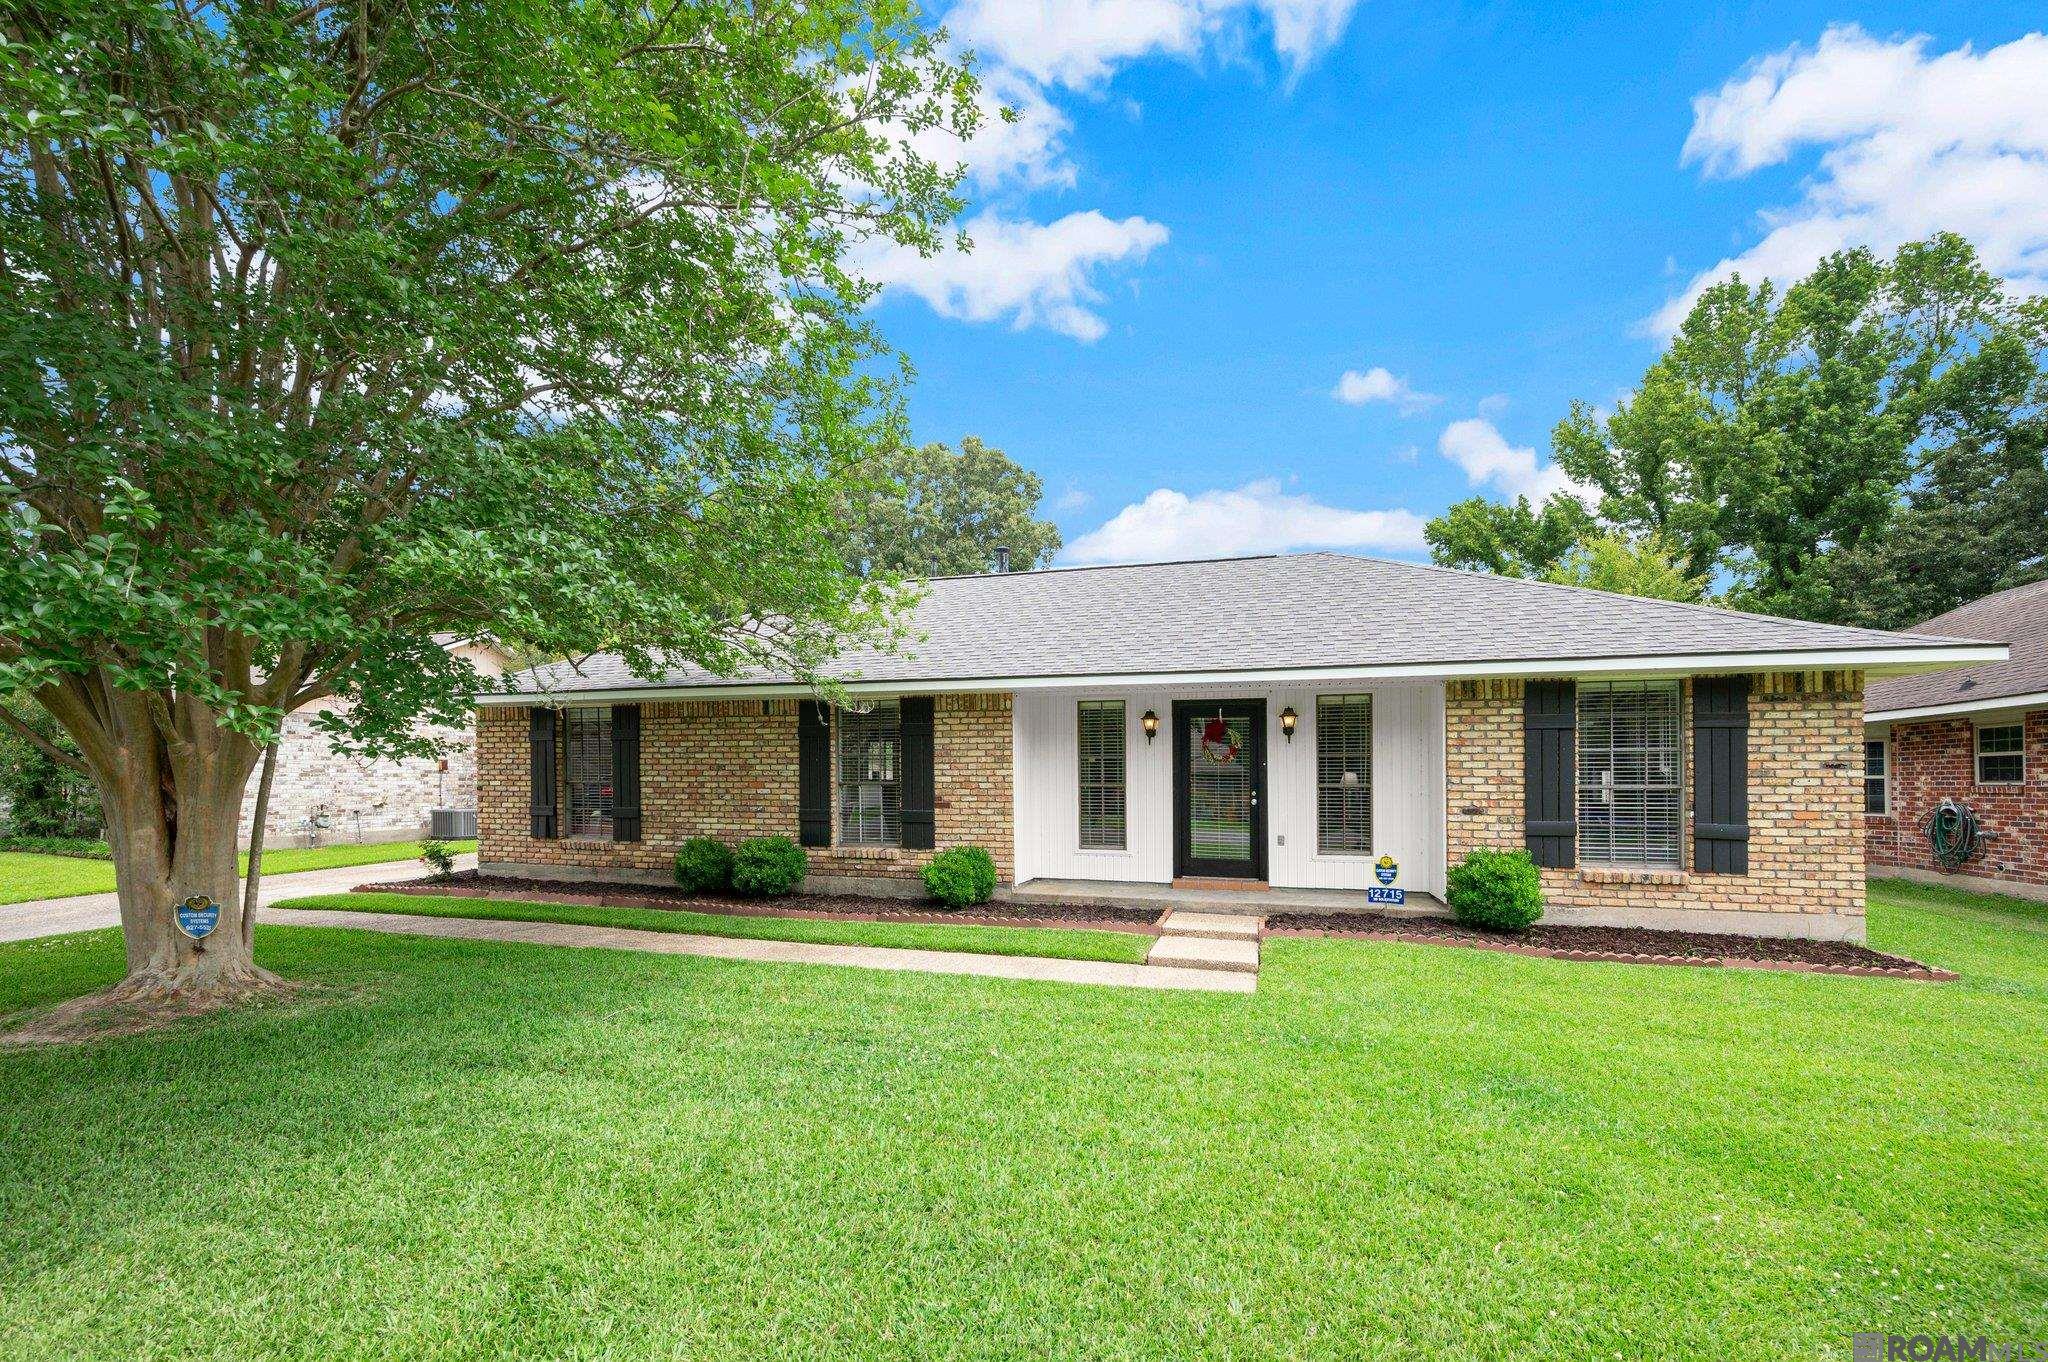
Active
$274,900
3
bds
|
2
ba
|
2,095
sqft
|
built
1979
12715 Mustang Ave, Baton Rouge, LA 70818
$-60
Cash flow
-1.1%
Cash-on-Cash Return
6.0%
Cap rate
0.7%
Rent to Value Ratio
Active
$600,000
3
bds
|
4
ba
|
2,272
sqft
|
built
1945
606 Leeward Dr, Baton Rouge, LA 70808
$-1,765
Cash flow
-15.3%
Cash-on-Cash Return
2.8%
Cap rate
0.3%
Rent to Value Ratio
Active
$89,000
2
bds
|
2
ba
|
1,135
sqft
|
built
1975
4364 Gurney St, Baton Rouge, LA 70805
$431
Cash flow
25.3%
Cash-on-Cash Return
12.1%
Cap rate
1.5%
Rent to Value Ratio