Baton Rouge, LA Investment Properties for Sale
Browse homes for sale and investment properties in Baton Rouge, LA. Refine your search by price, property type, or more.
Best cash flowing properties in Baton Rouge, LA
Active
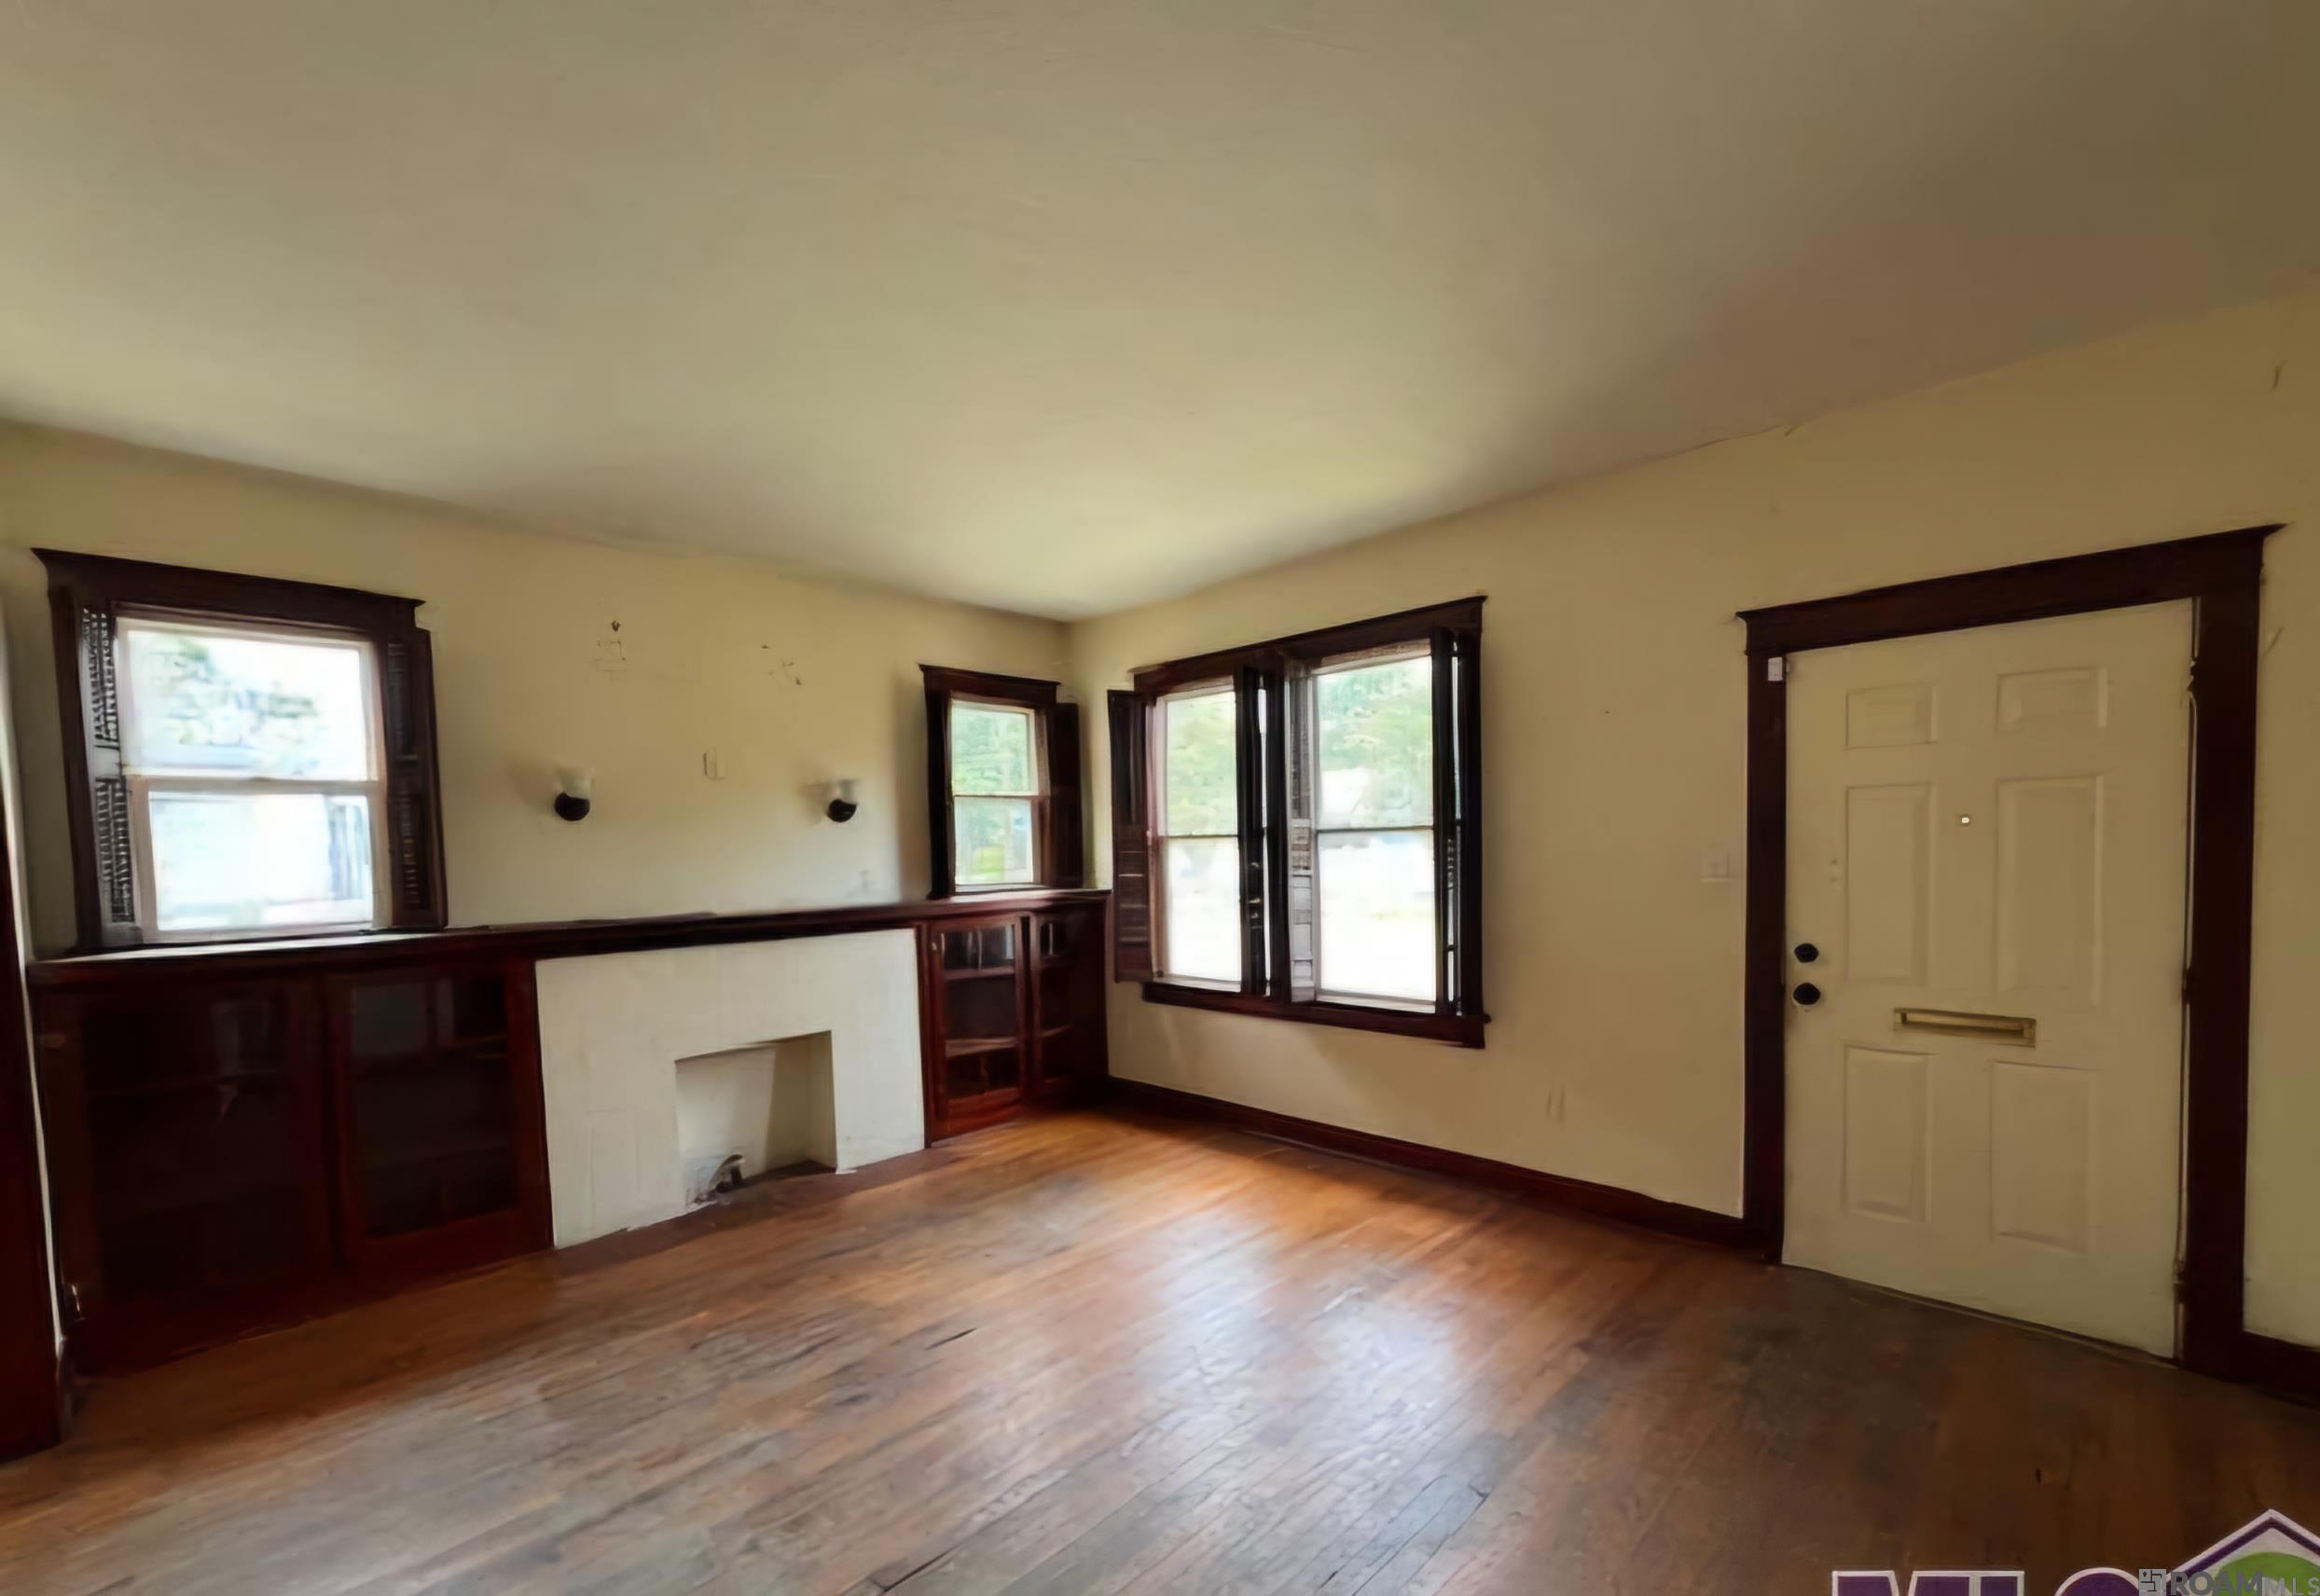
$69,900
3
bds
|
1
ba
|
2,160
sqft
|
built
1980
3004 Fairfields Ave, Baton Rouge, LA 70802
$828
Cash flow
13.8%
Cash-on-Cash Return
14.2%
Cap rate
1.7%
Rent to Value Ratio
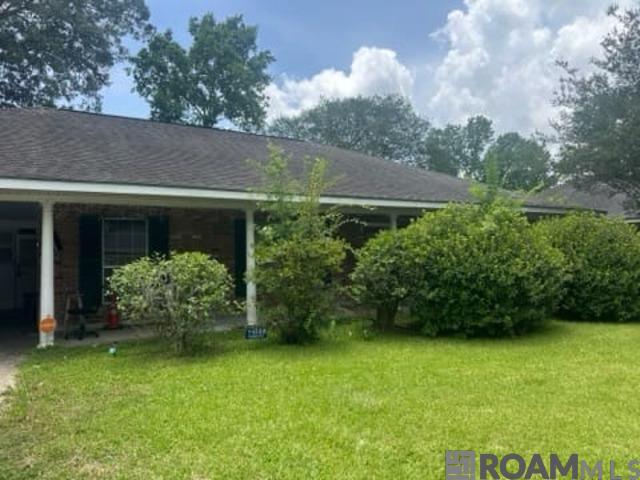
Pending
$190,000
4
bds
|
2
ba
|
2,004
sqft
|
built
1974
11088 Mollylea Dr, Baton Rouge, LA 70815
$481
Cash flow
13.2%
Cash-on-Cash Return
8.7%
Cap rate
1.1%
Rent to Value Ratio
986 out of 1,271 properties for sale in Baton Rouge, LA
Limited Results Shown
Create a free account, or log in to reveal all property listings and enjoy the complete experience.
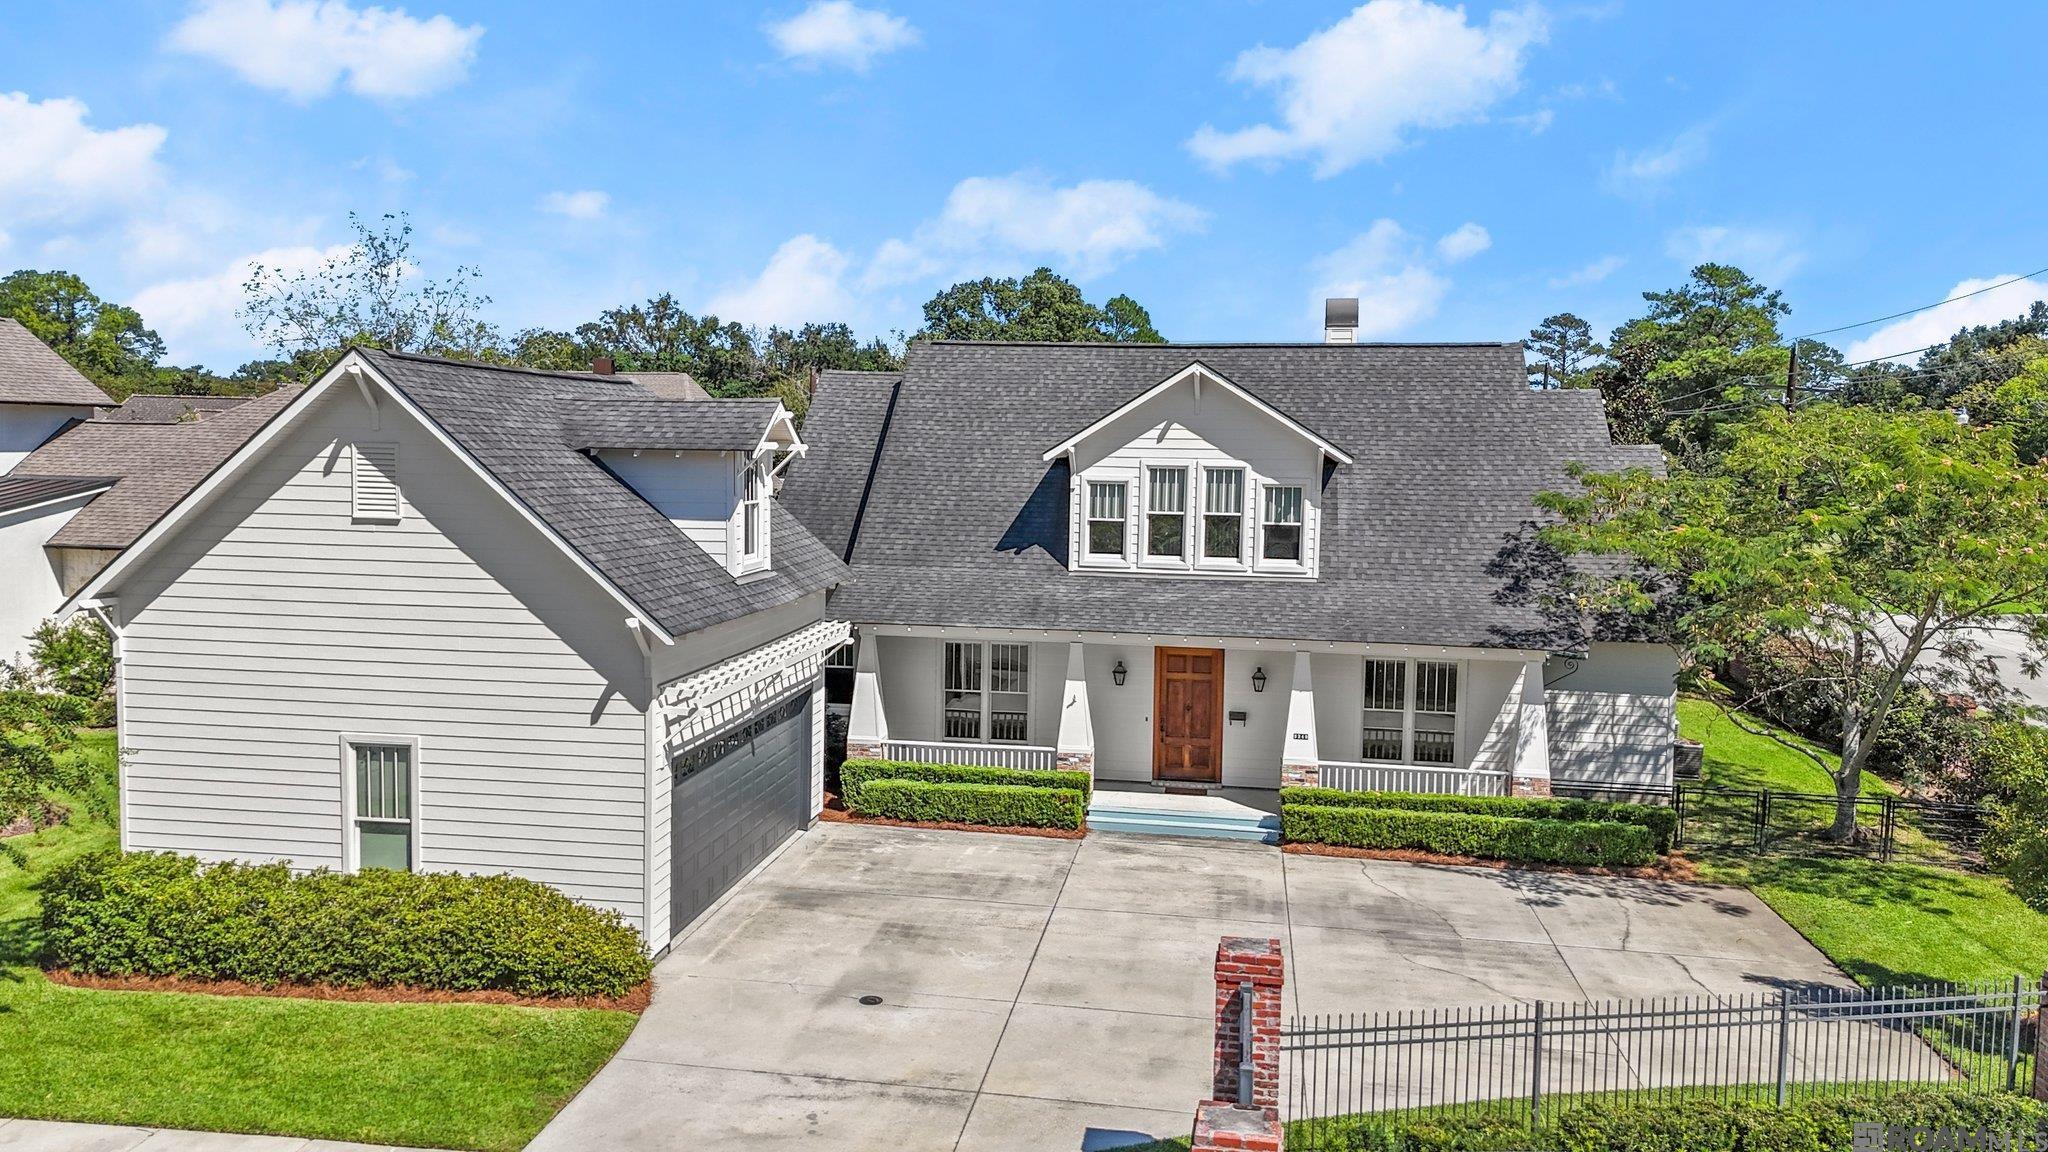
Active
$759,999
4
bds
|
3
ba
|
3,265
sqft
|
built
2014
9349 Pieta Ln, Baton Rouge, LA 70809
$-550
Cash flow
-3.8%
Cash-on-Cash Return
4.8%
Cap rate
0.6%
Rent to Value Ratio
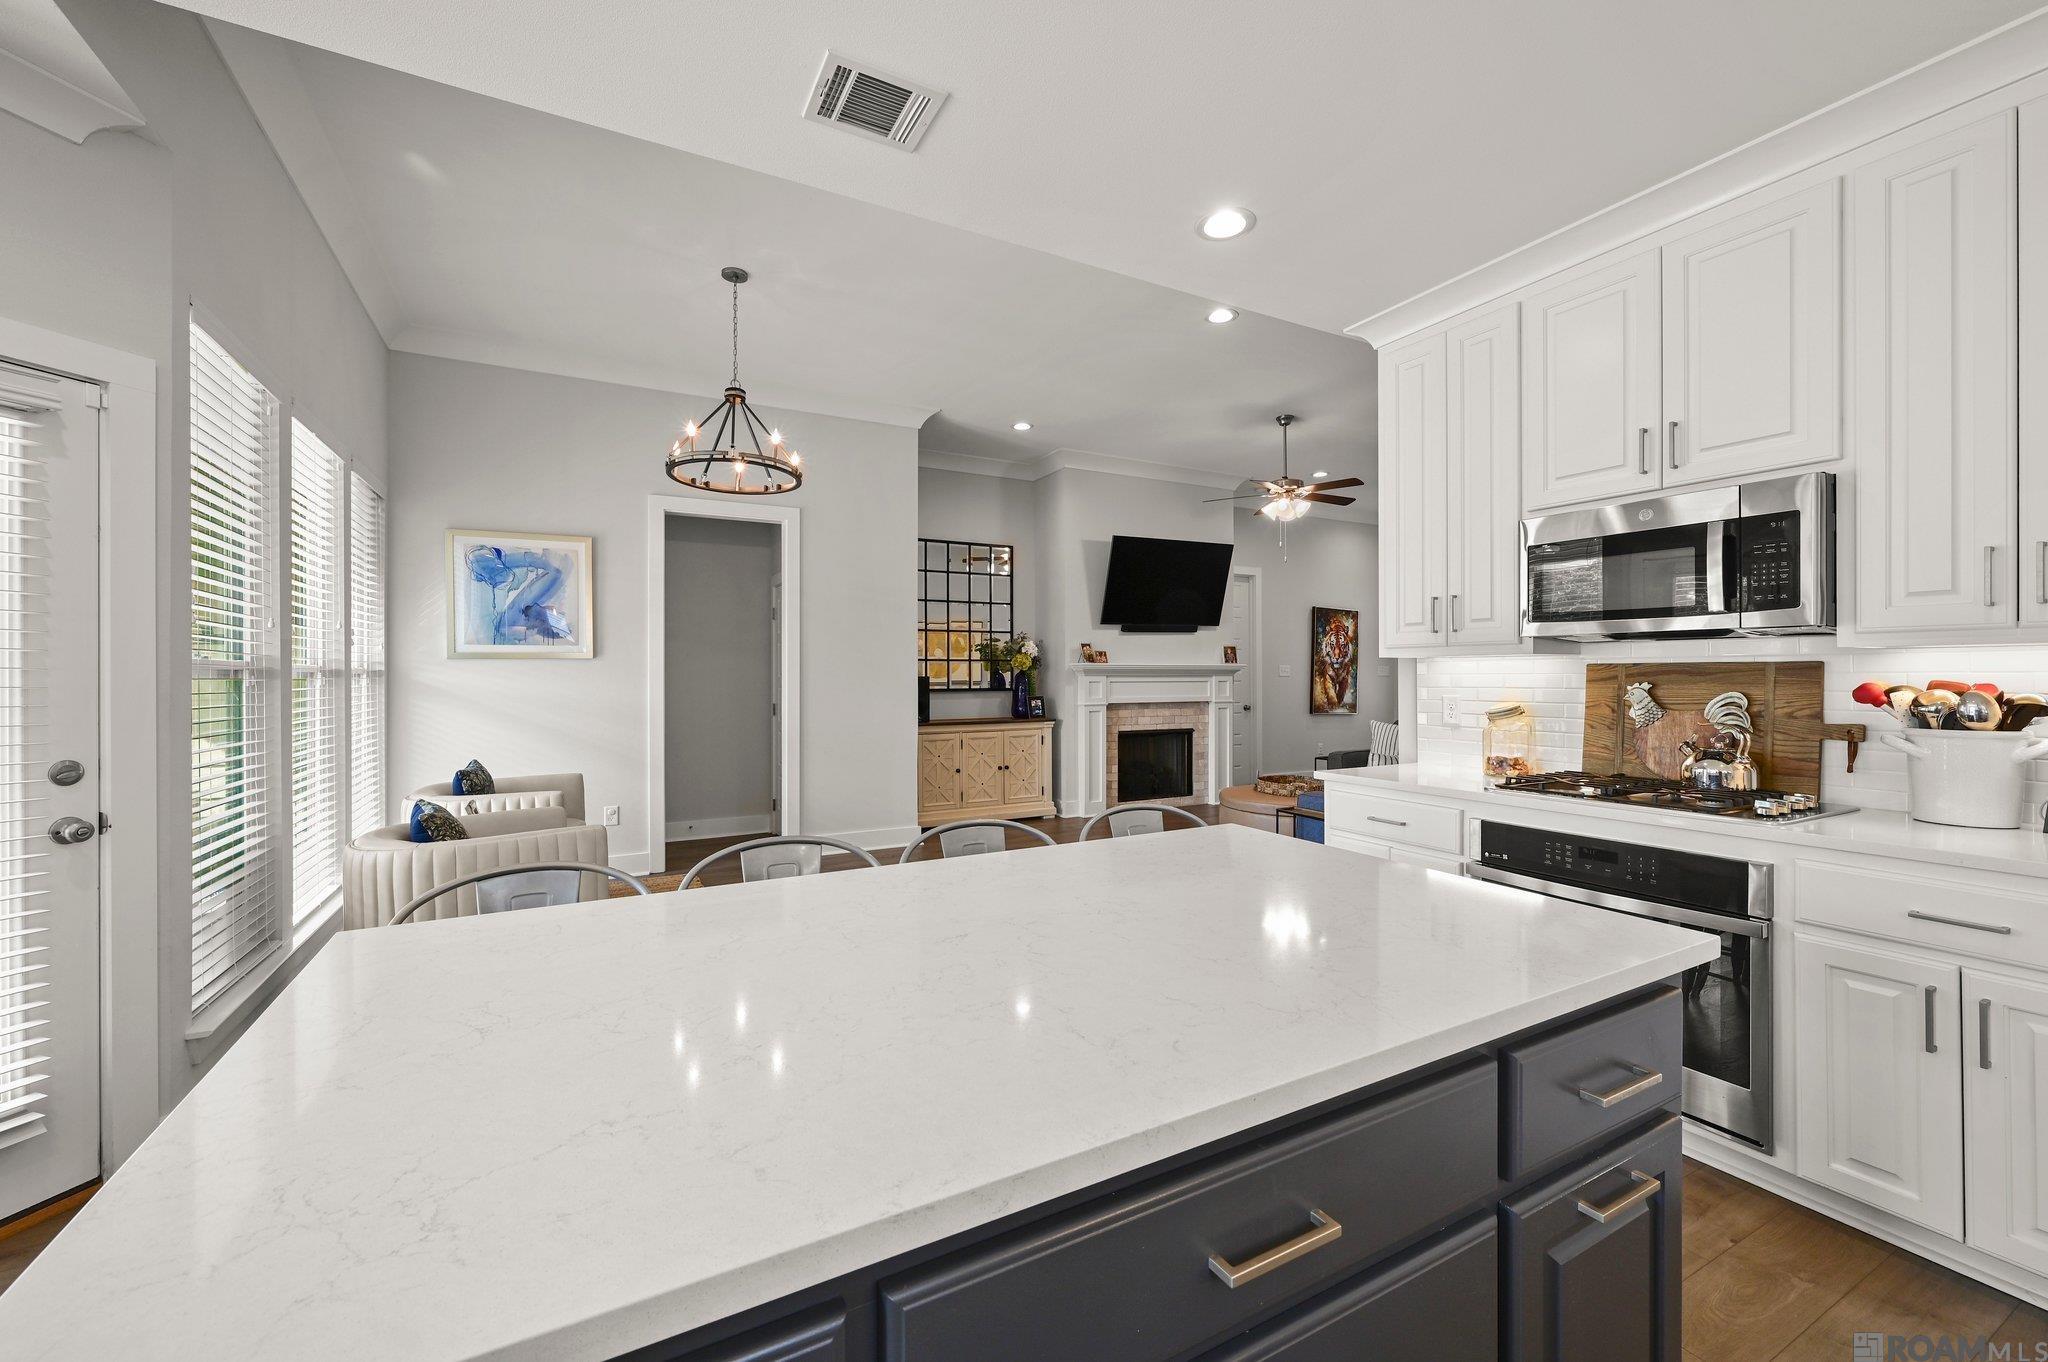
Active
$395,000
4
bds
|
2
ba
|
1,844
sqft
|
built
2022
14435 Wally Way, Baton Rouge, LA 70810
$-227
Cash flow
-3.0%
Cash-on-Cash Return
5.0%
Cap rate
0.6%
Rent to Value Ratio
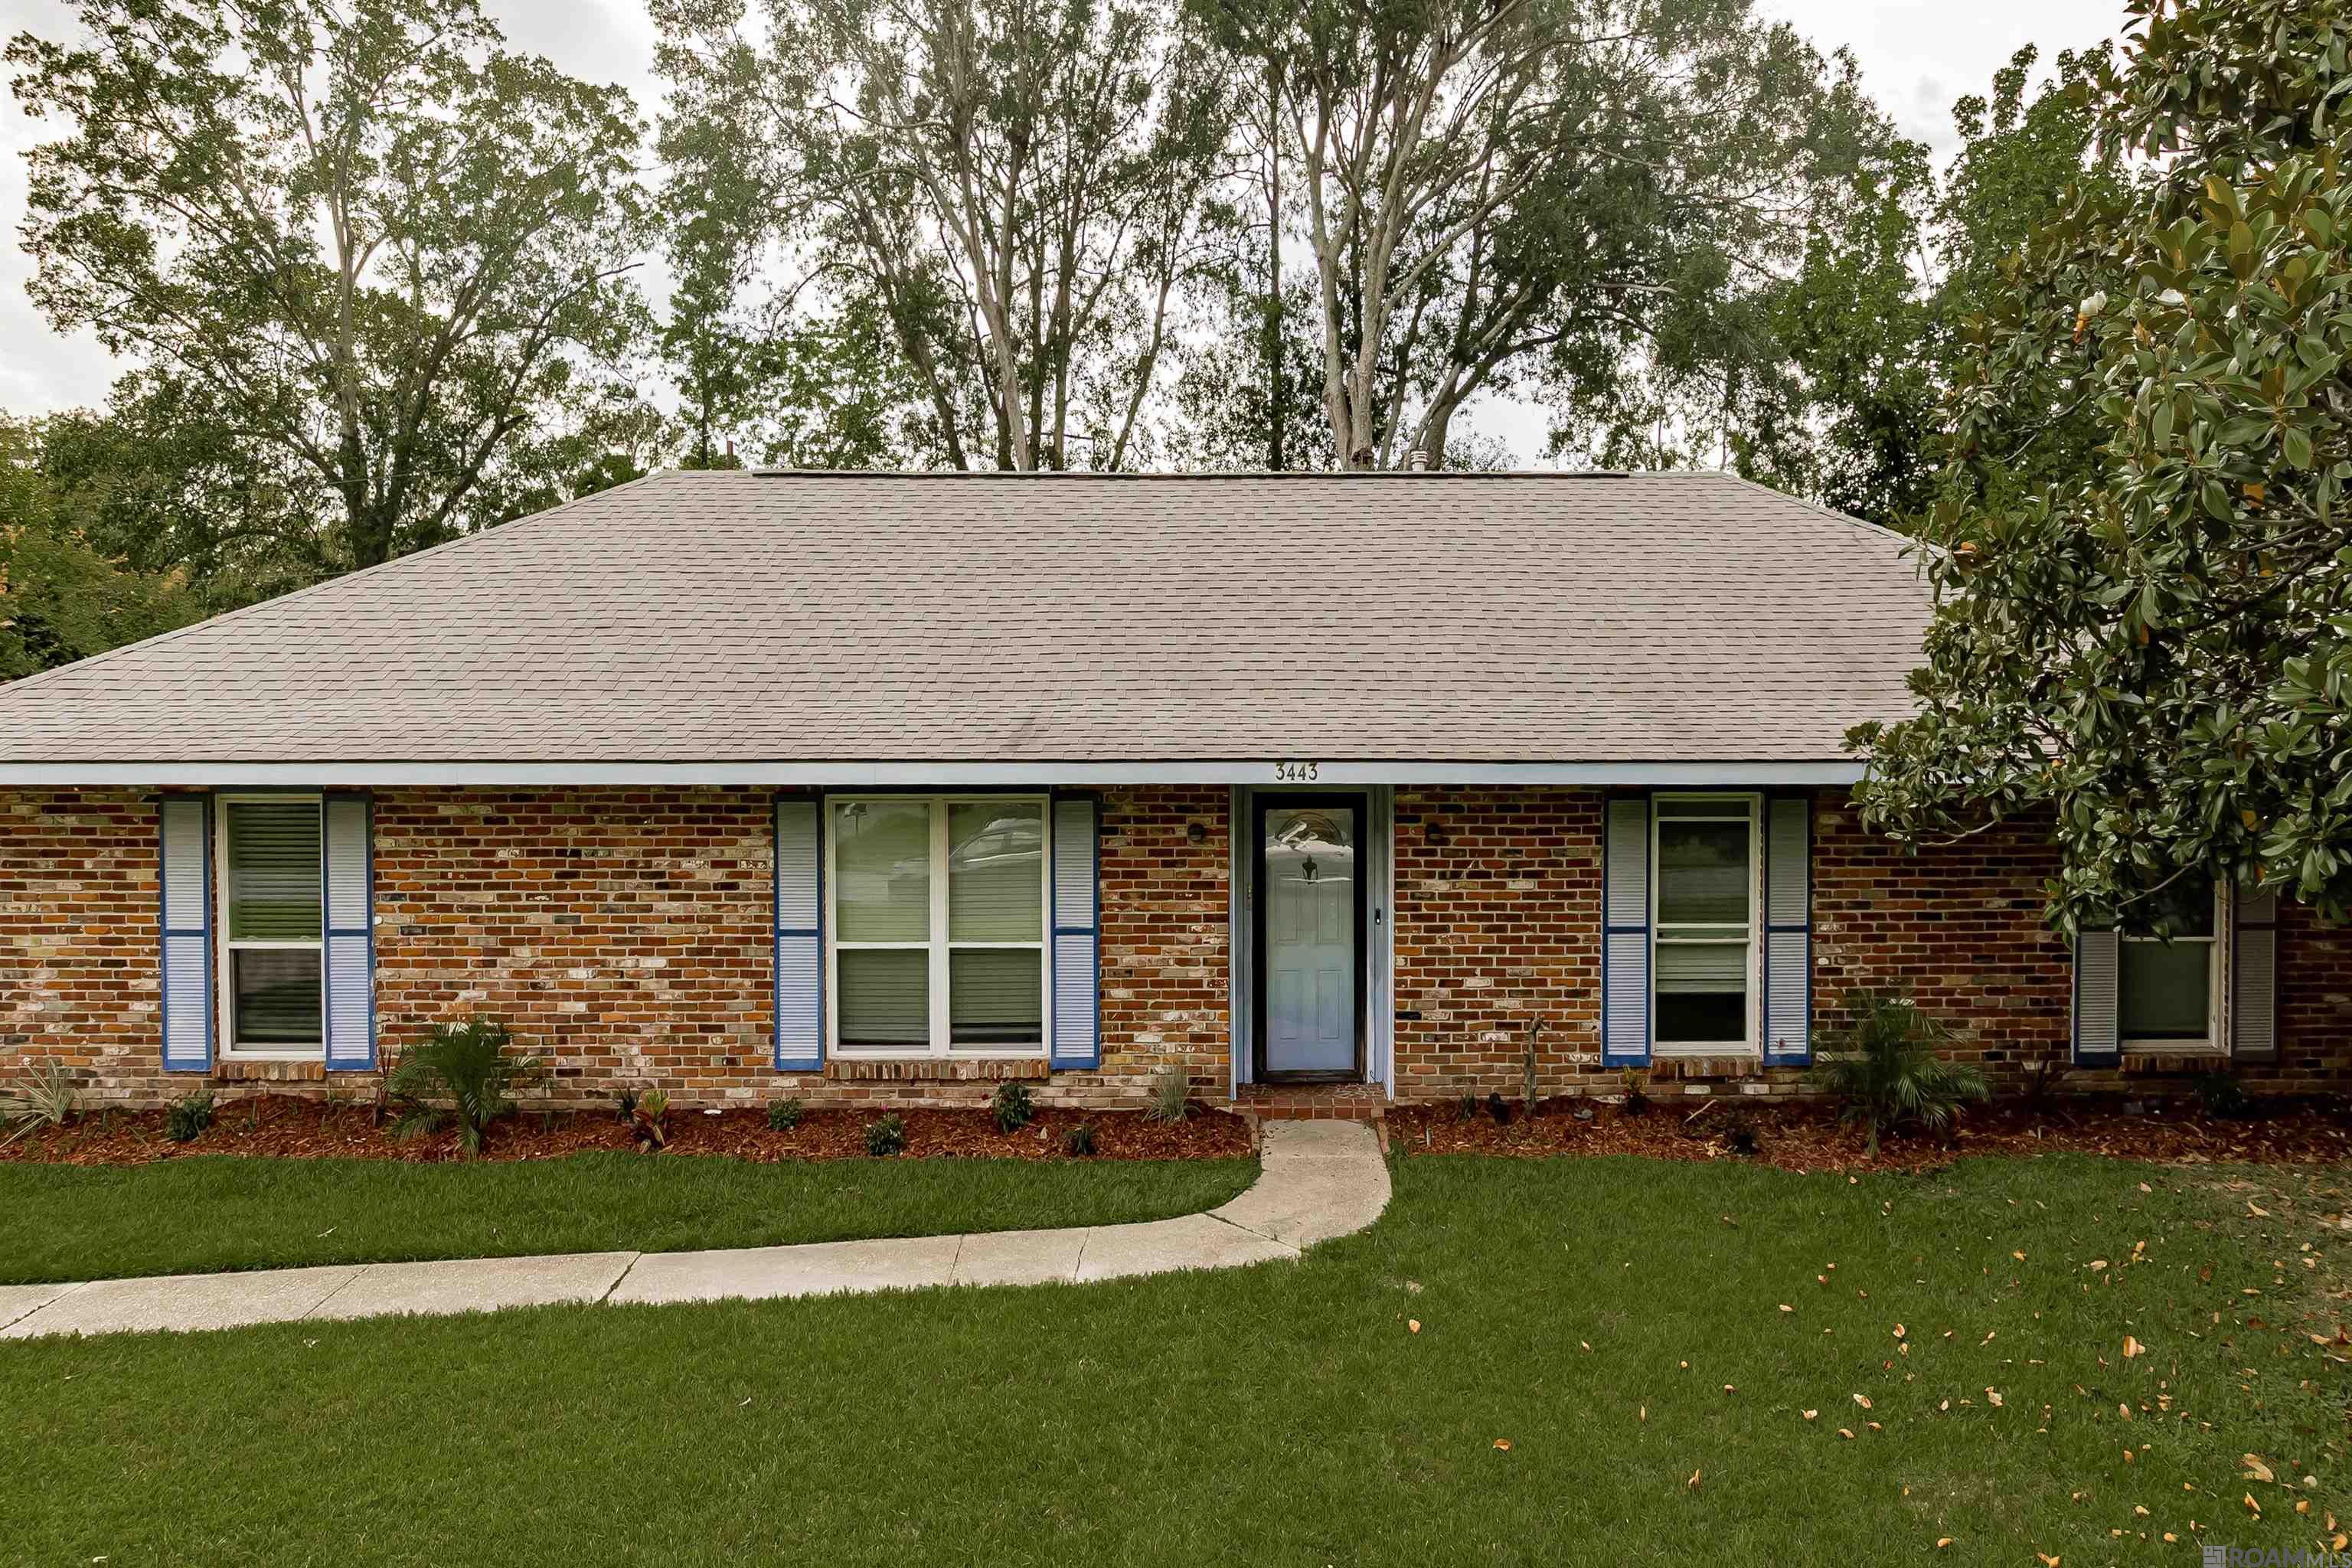
Active
$243,000
4
bds
|
3
ba
|
1,910
sqft
|
built
1960
3443 Warren Dr, Baton Rouge, LA 70814
$230
Cash flow
4.9%
Cash-on-Cash Return
6.8%
Cap rate
0.8%
Rent to Value Ratio
Active
$539,000
4
bds
|
3
ba
|
2,704
sqft
|
built
2021
13152 Elissa Ln, Baton Rouge, LA 70818
$-1,505
Cash flow
-14.6%
Cash-on-Cash Return
2.3%
Cap rate
0.3%
Rent to Value Ratio
Active
$210,000
3
bds
|
2
ba
|
1,688
sqft
|
built
1980
14761 Brightview Ct, Baton Rouge, LA 70819
$248
Cash flow
6.2%
Cash-on-Cash Return
7.1%
Cap rate
0.9%
Rent to Value Ratio
Active
$550,000
3
bds
|
2
ba
|
2,166
sqft
|
built
1950
635 L S U Ave, Baton Rouge, LA 70808
$-1,223
Cash flow
-11.6%
Cash-on-Cash Return
3.0%
Cap rate
0.4%
Rent to Value Ratio
Active
$125,000
2
bds
|
3
ba
|
1,250
sqft
|
built
1984
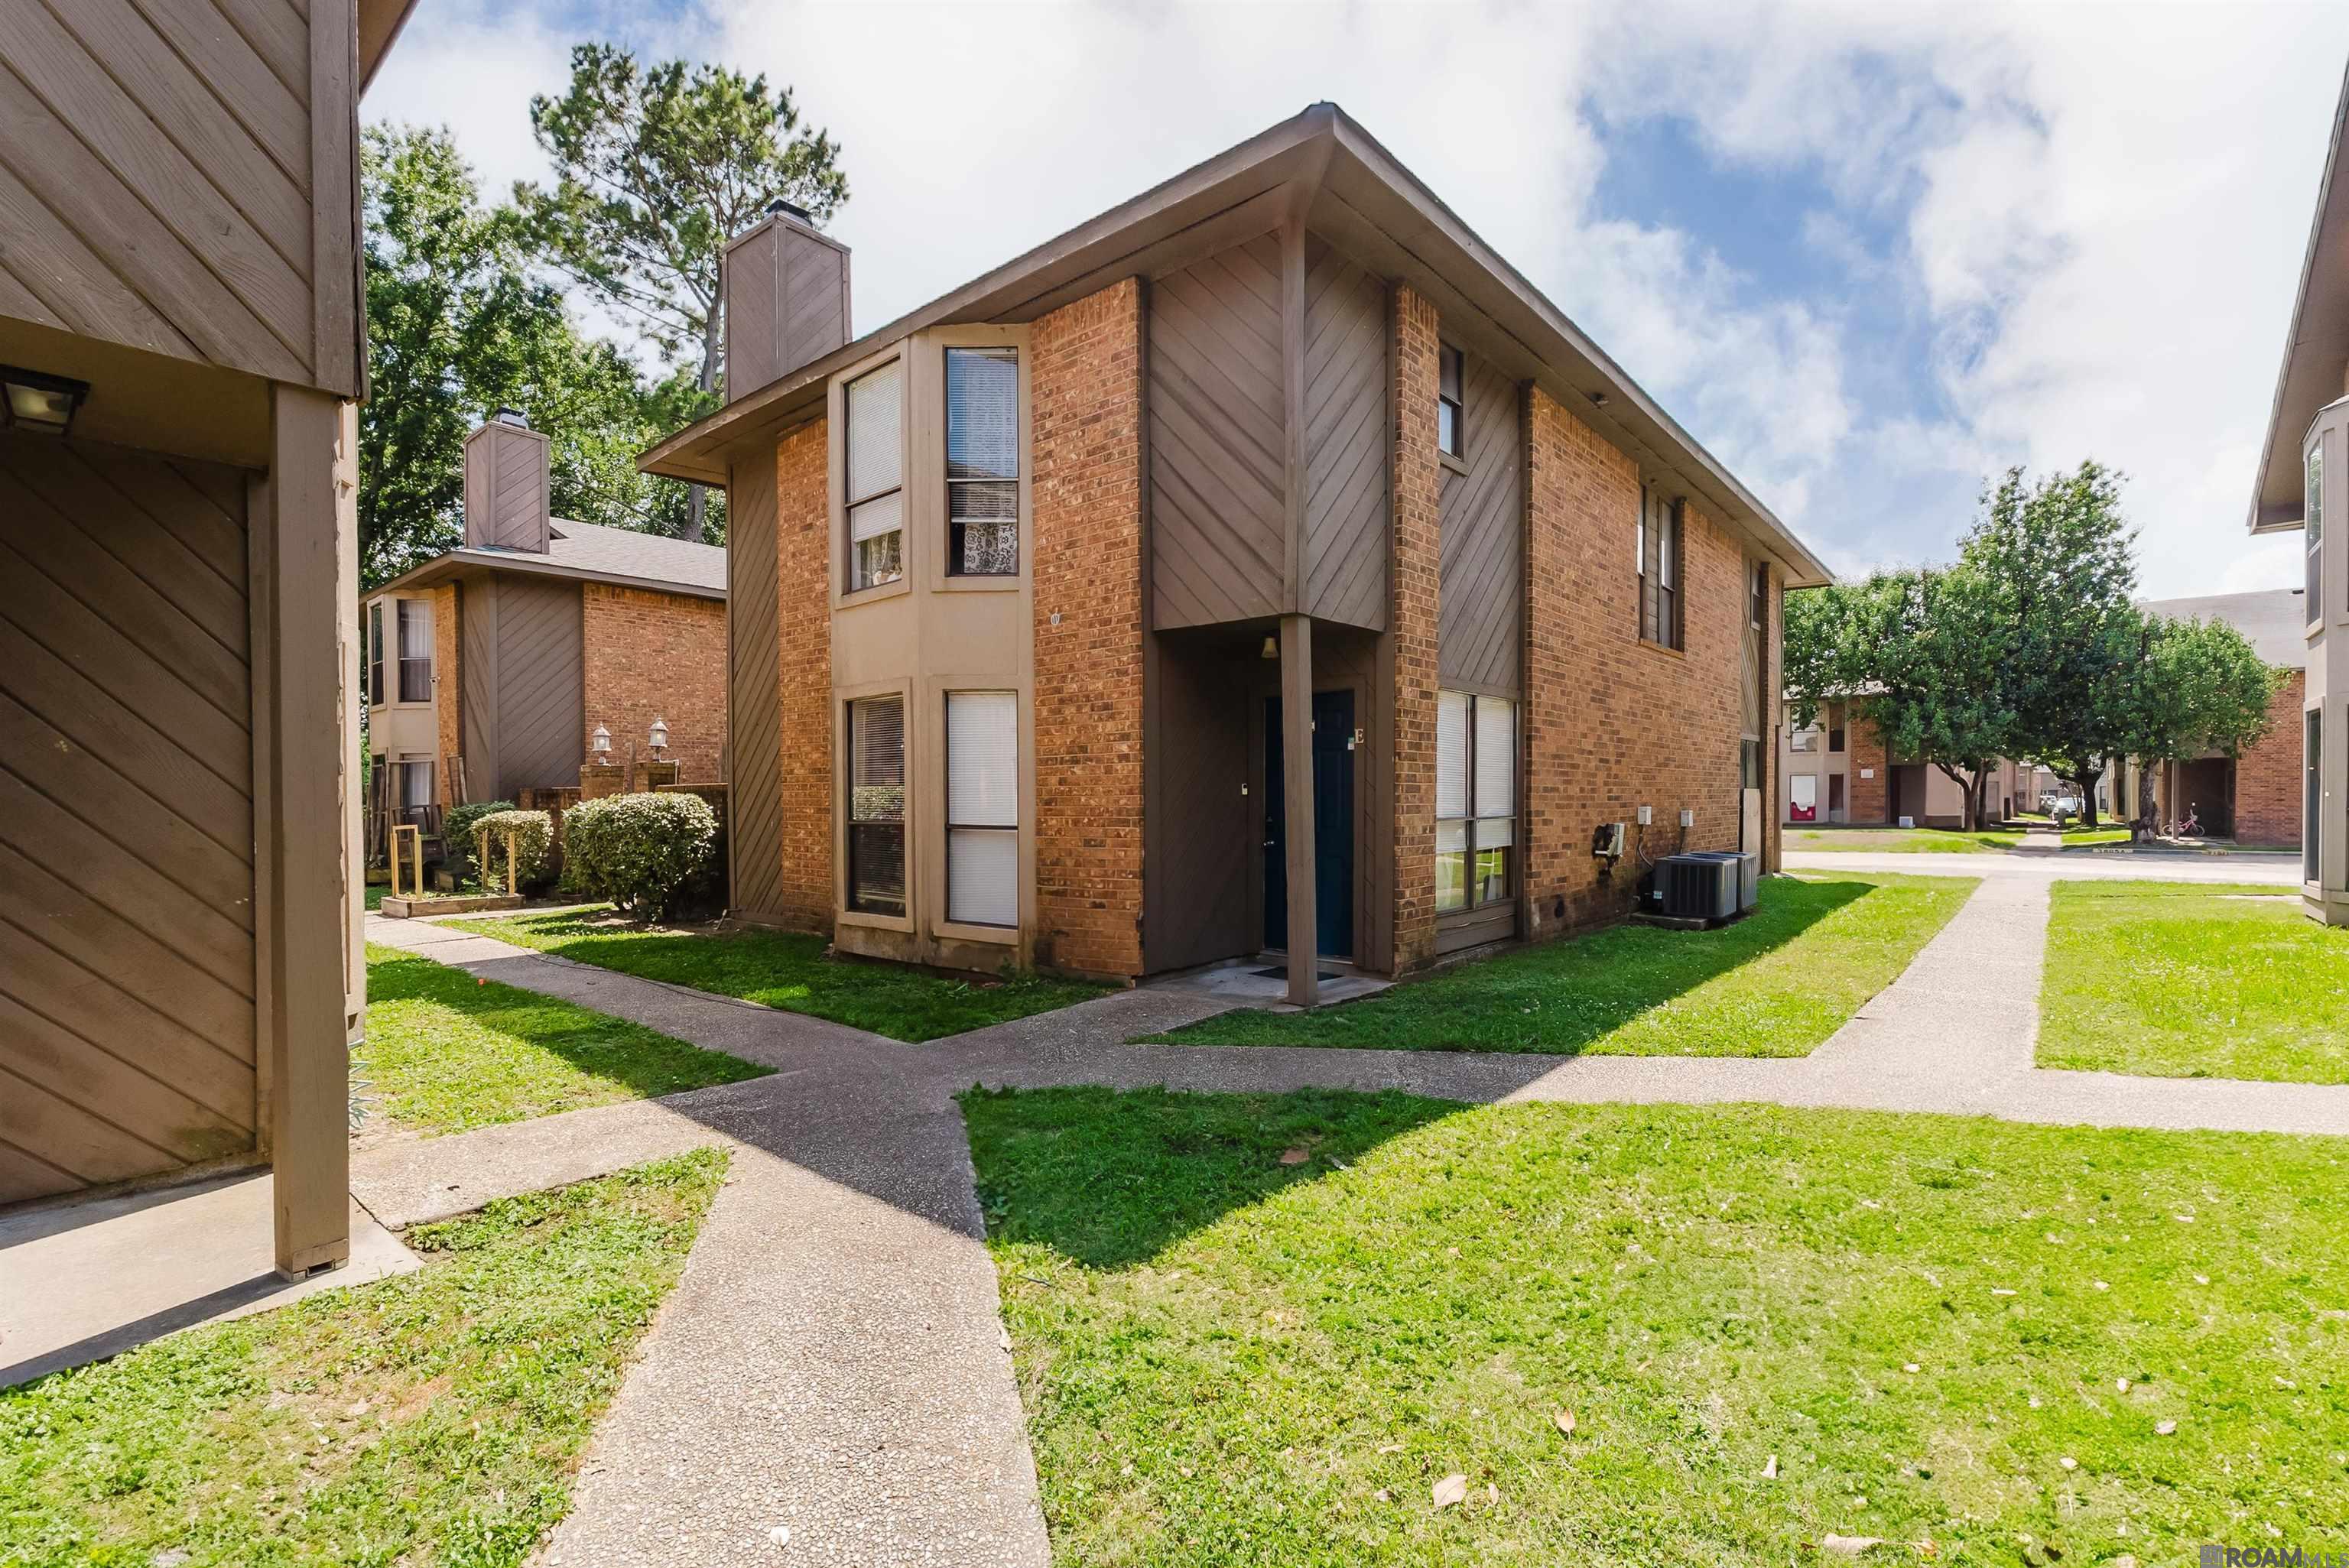
1757 S Brightside View Dr, Baton Rouge, LA 70820
$352
Cash flow
14.7%
Cash-on-Cash Return
9.1%
Cap rate
1.1%
Rent to Value Ratio

Pending
$189,900
3
bds
|
2
ba
|
1,738
sqft
|
built
1968
14321 Lilac St, Baton Rouge, LA 70819
$343
Cash flow
9.4%
Cash-on-Cash Return
7.8%
Cap rate
0.9%
Rent to Value Ratio
Active
$222,000
3
bds
|
3
ba
|
1,569
sqft
|
built
1995
9827 E Groner Ave, Baton Rouge, LA 70809
$-128
Cash flow
-3.0%
Cash-on-Cash Return
5.0%
Cap rate
0.8%
Rent to Value Ratio

Active
$420,000
4
bds
|
3
ba
|
2,397
sqft
|
built
2020
1220 Shadow Bluff Dr, Baton Rouge, LA 70820
$-779
Cash flow
-9.7%
Cash-on-Cash Return
3.5%
Cap rate
0.4%
Rent to Value Ratio
Active
$4,695,000
5
bds
|
6
ba
|
7,323
sqft
|
built
1992
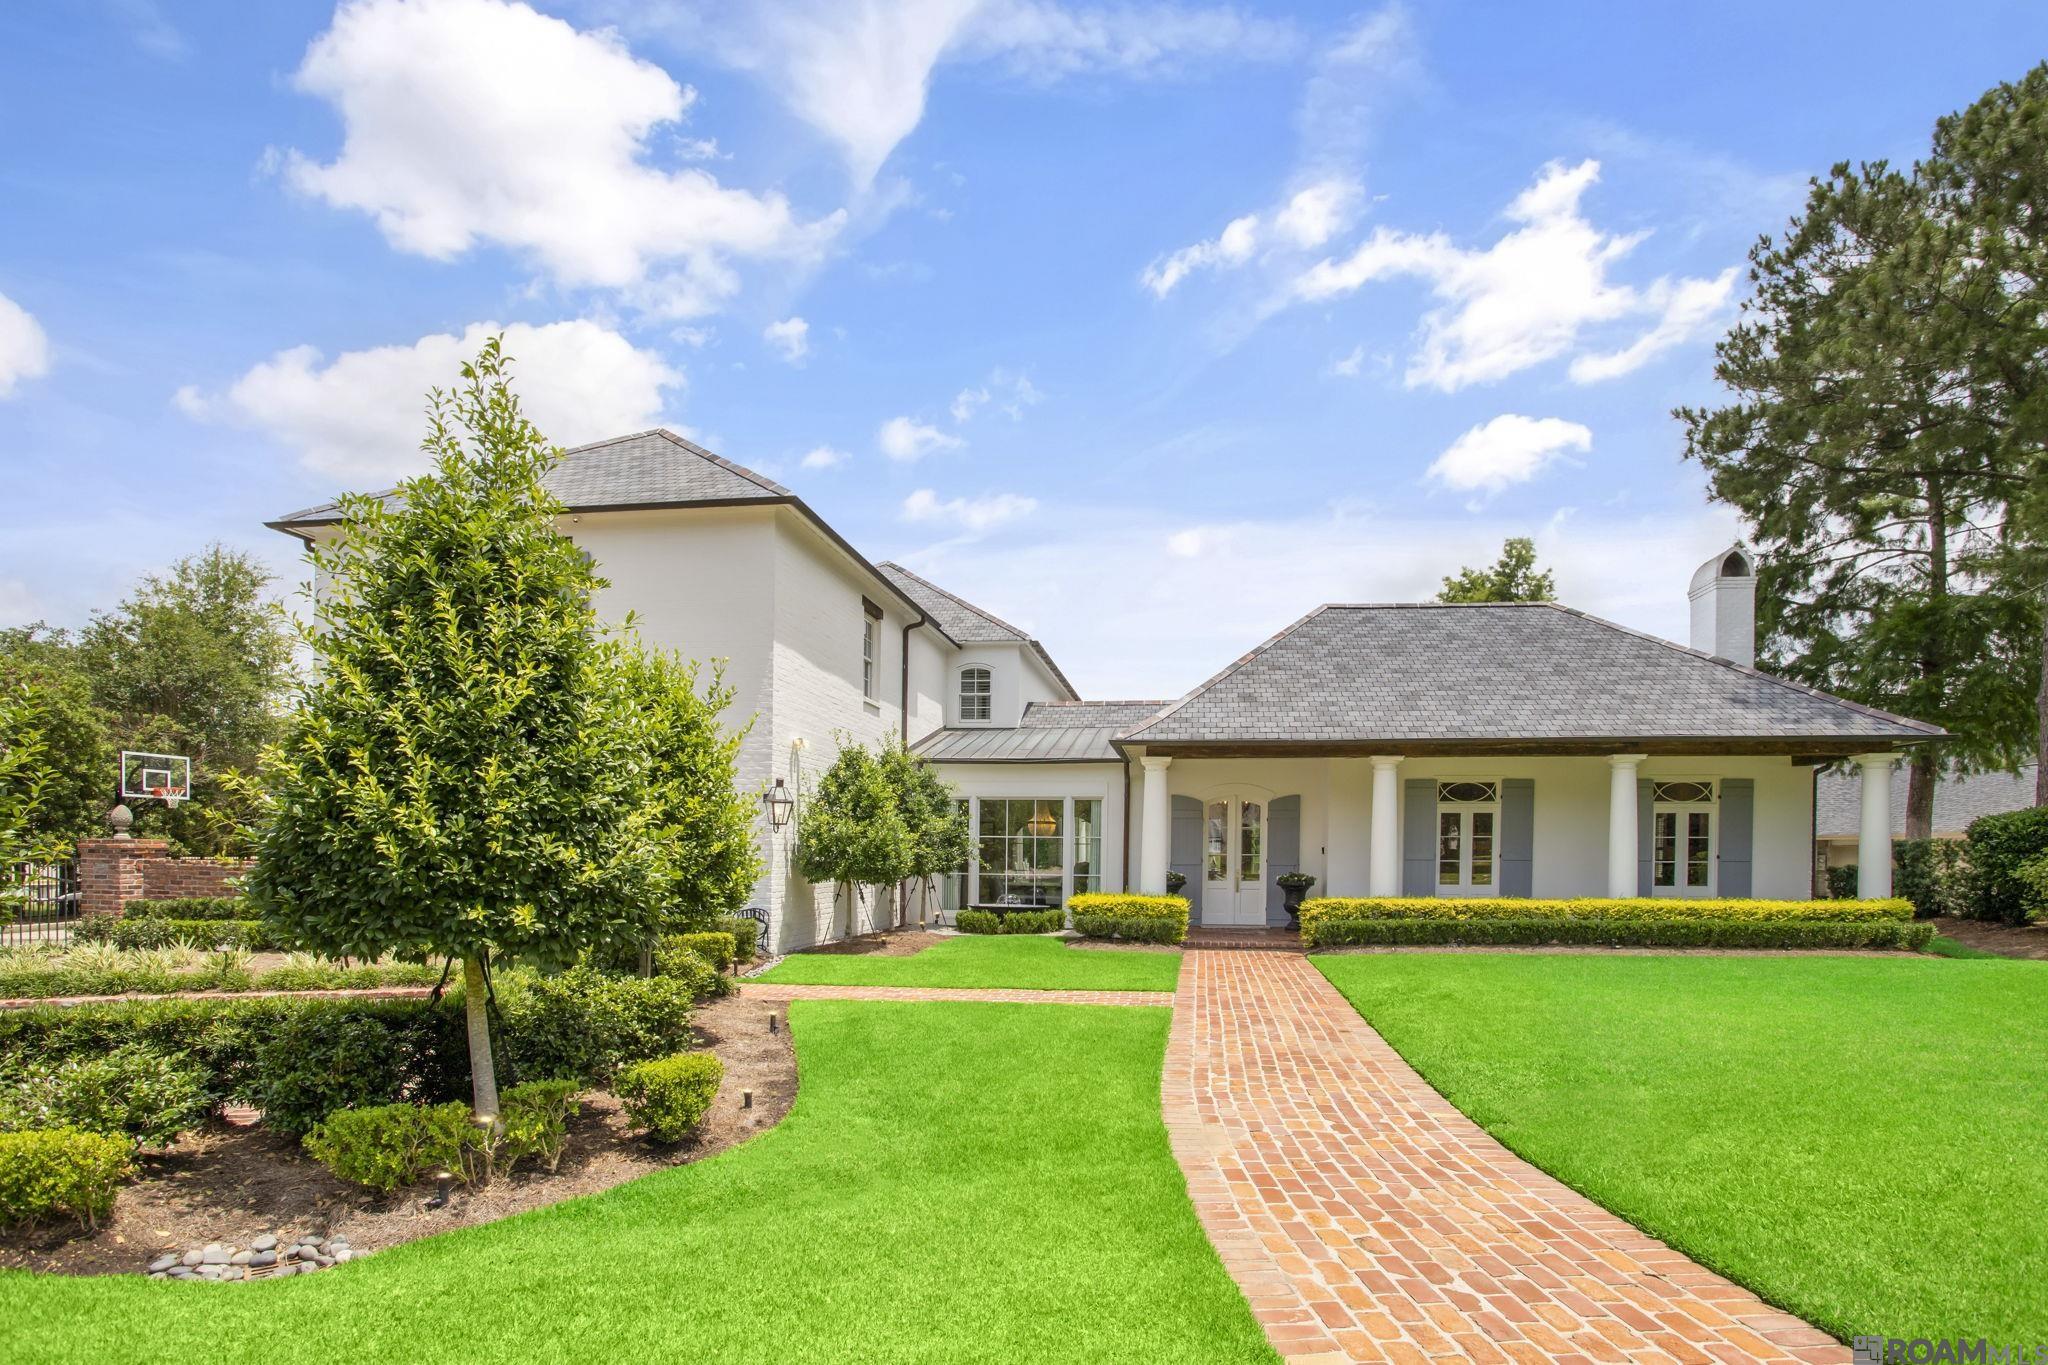
19421 N Muirfield Cir, Baton Rouge, LA 70810
$-17,525
Cash flow
-19.5%
Cash-on-Cash Return
1.2%
Cap rate
0.2%
Rent to Value Ratio
Active
$300,000
4
bds
|
3
ba
|
2,367
sqft
|
built
1979
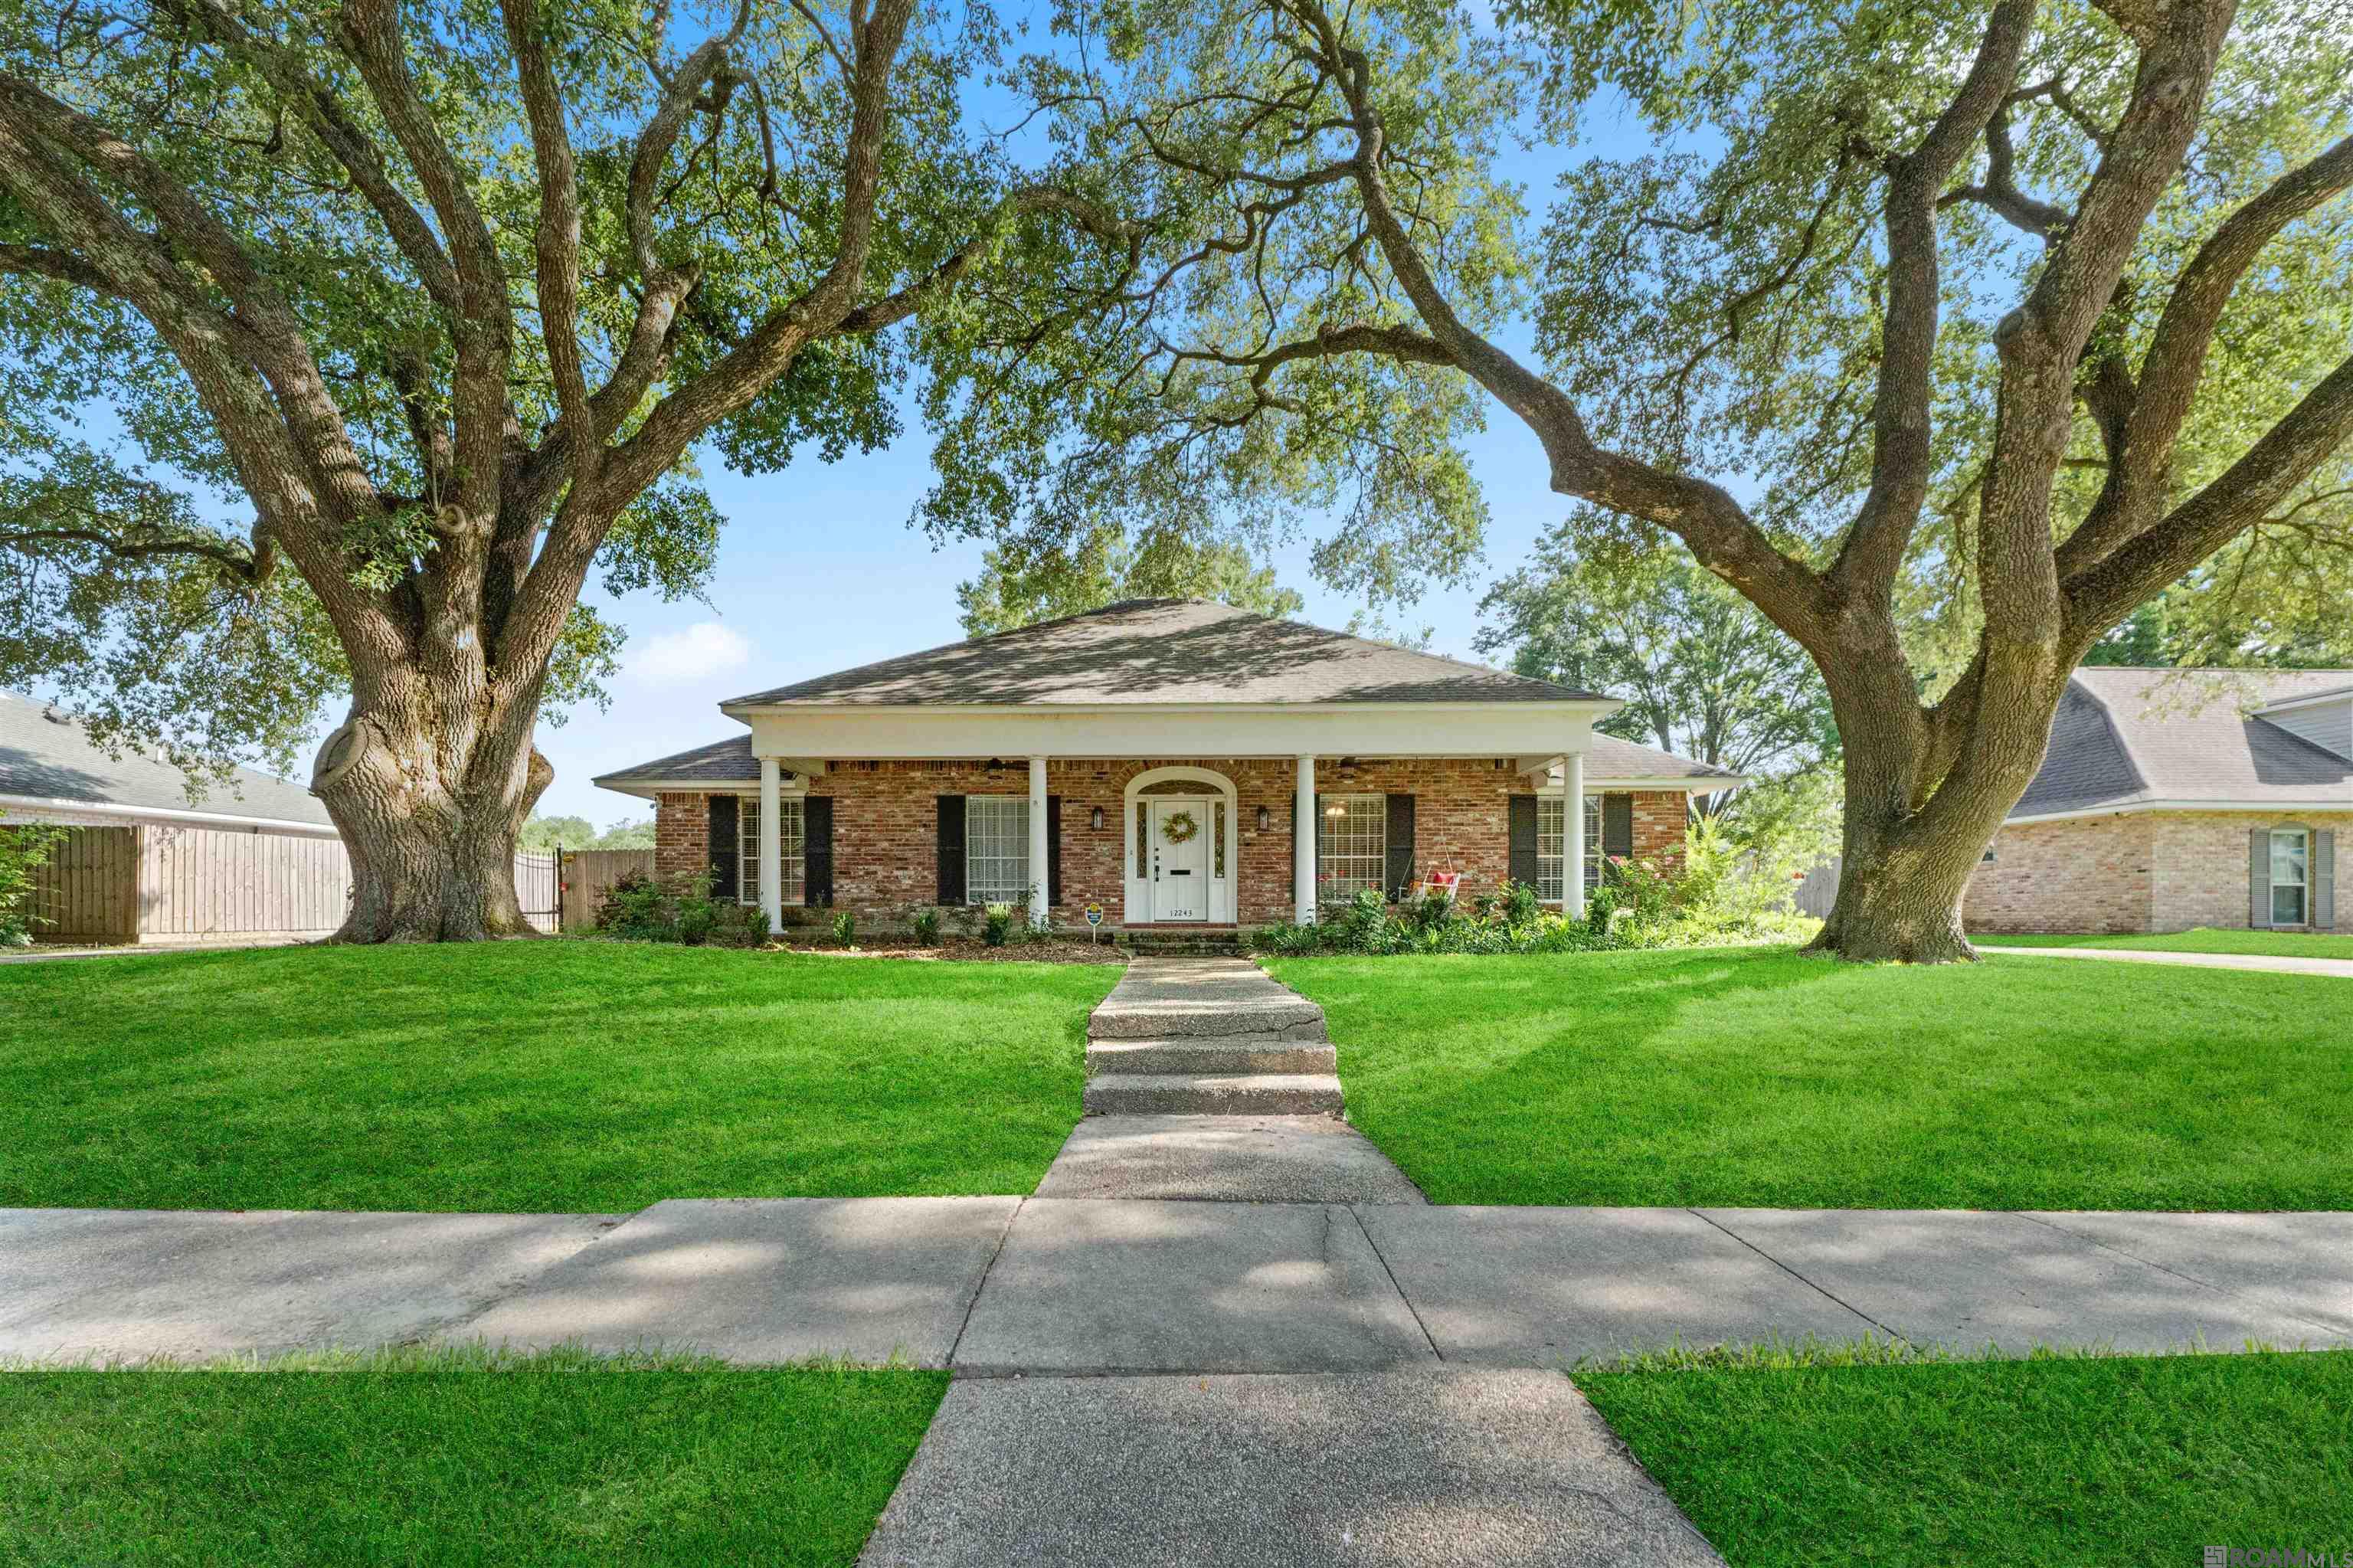
12243 Brookshire Ave, Baton Rouge, LA 70815
$236
Cash flow
4.1%
Cash-on-Cash Return
6.6%
Cap rate
0.8%
Rent to Value Ratio

Active under contract
$255,000
4
bds
|
3
ba
|
2,567
sqft
|
built
1970
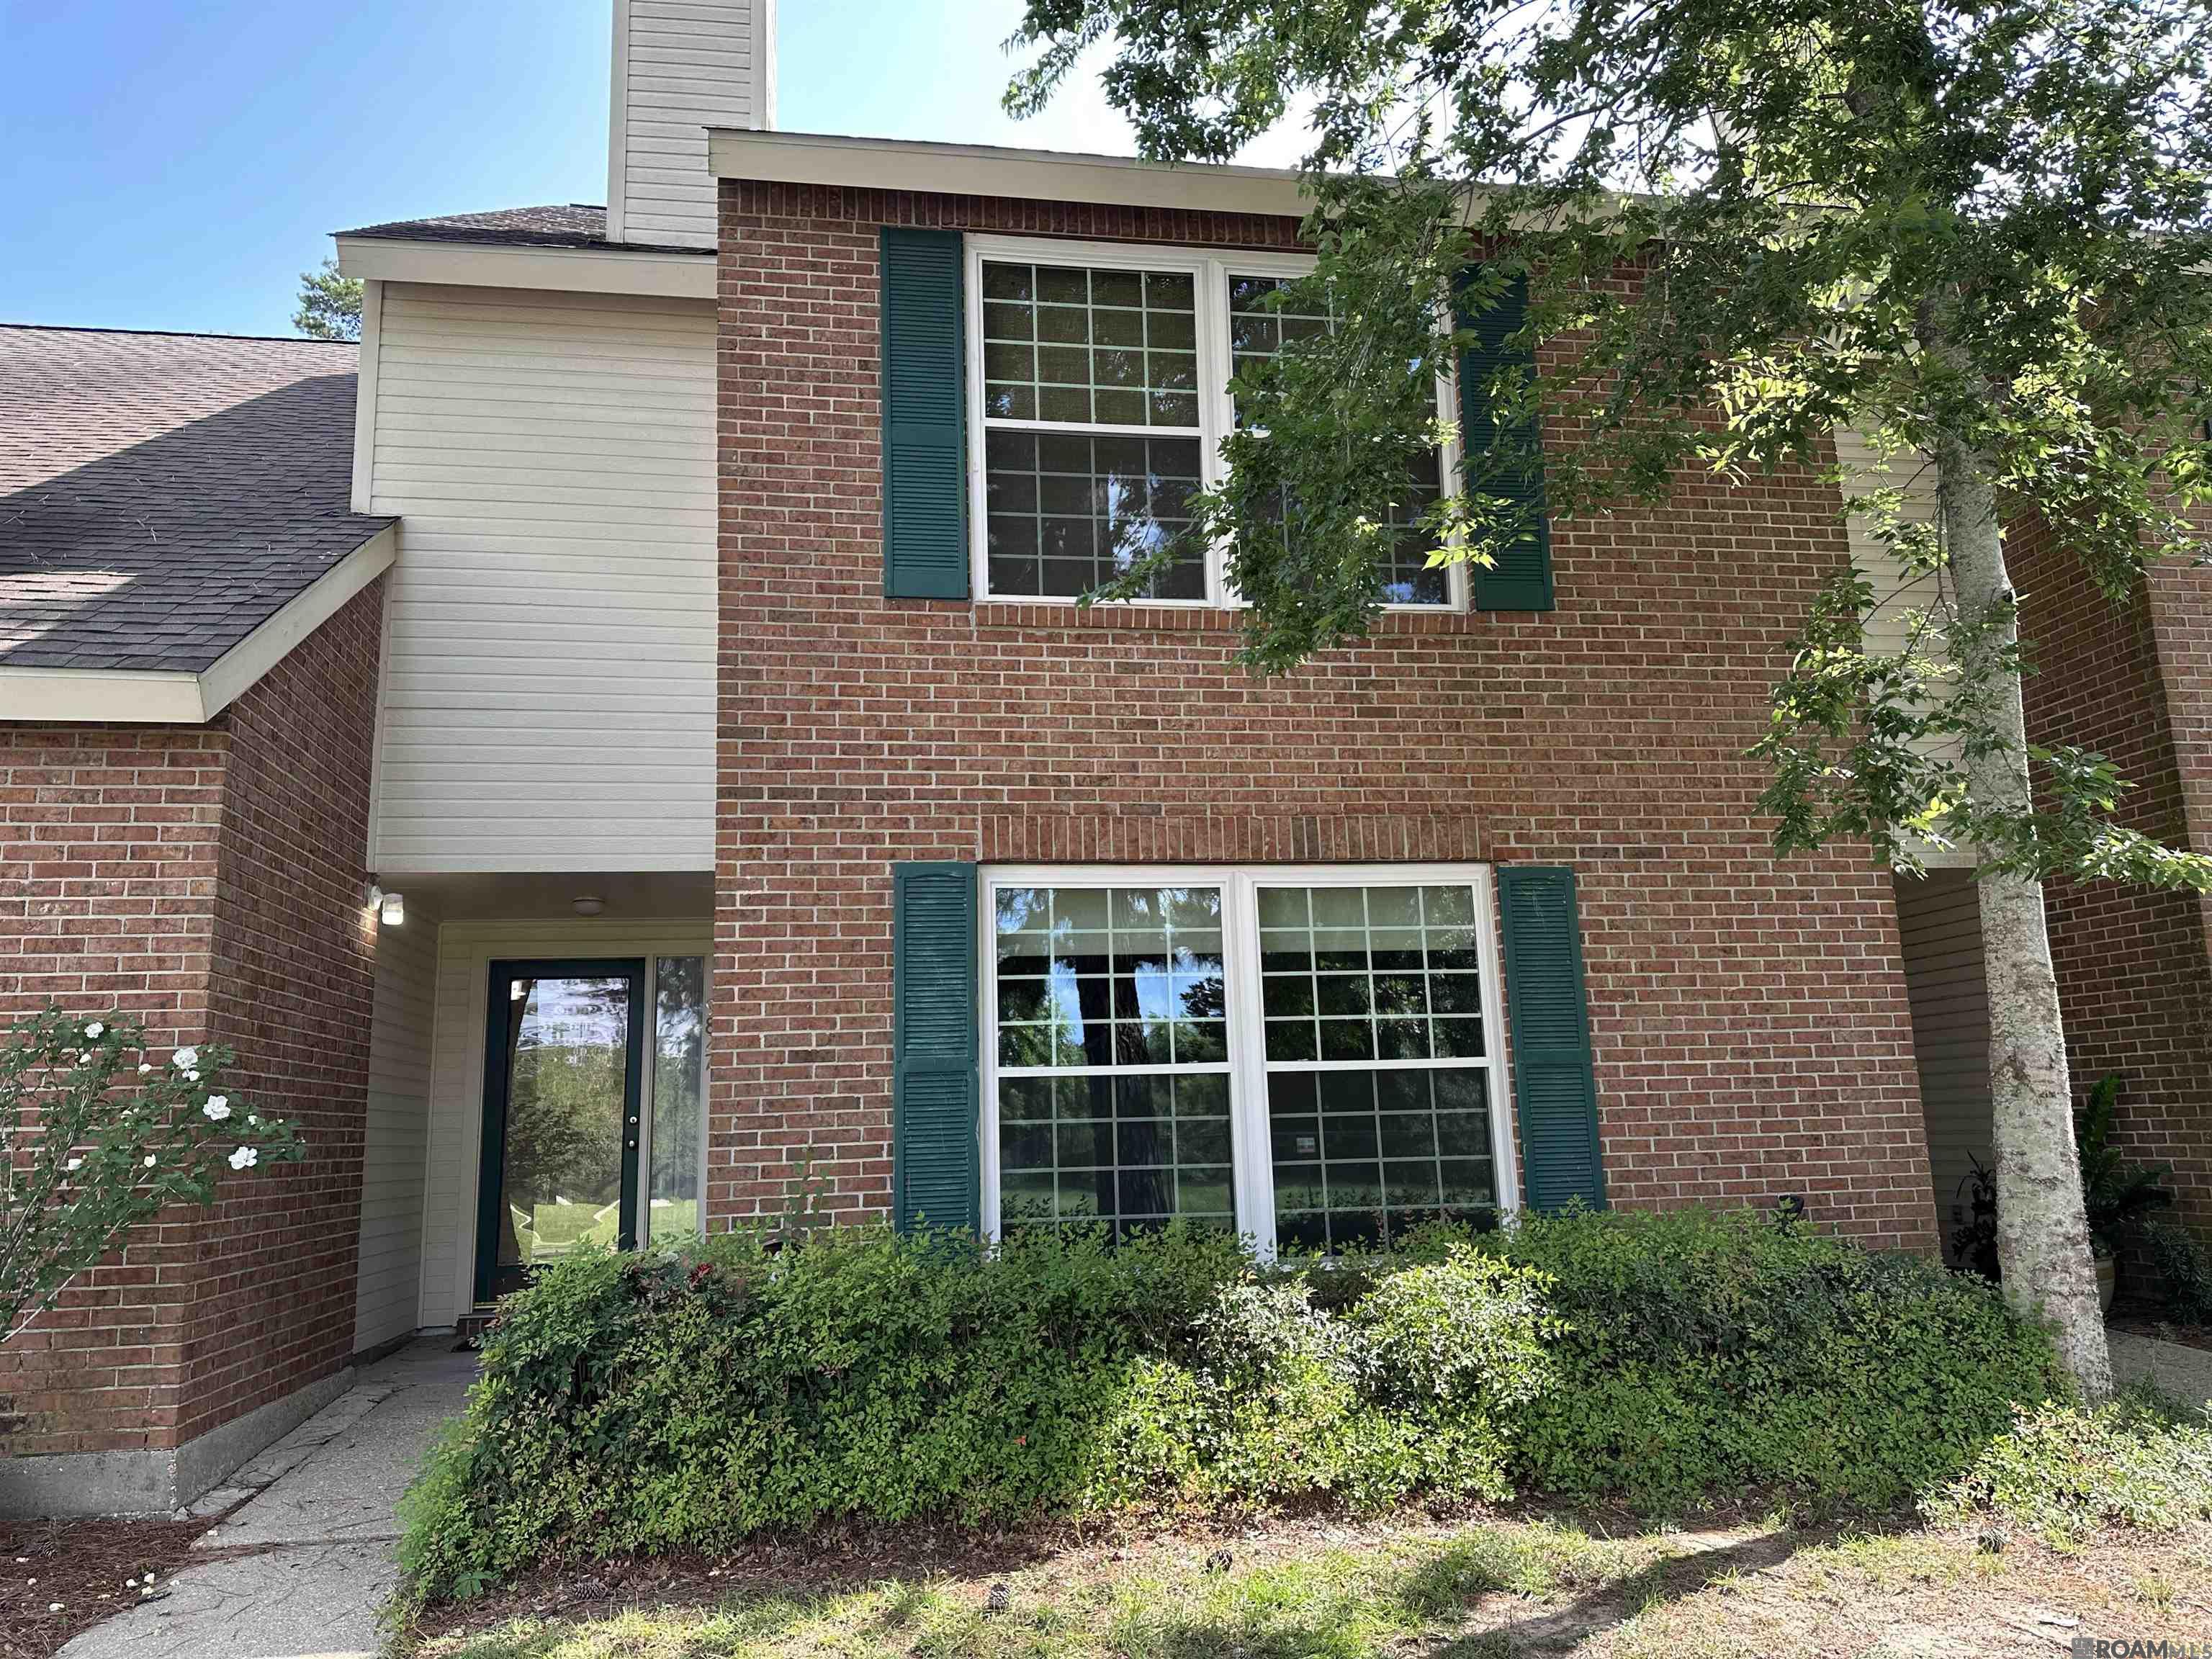
2741 Westerwood Dr, Baton Rouge, LA 70816
$298
Cash flow
6.1%
Cash-on-Cash Return
7.1%
Cap rate
0.9%
Rent to Value Ratio
Active
$480,000
4
bds
|
3
ba
|
3,459
sqft
|
built
1970
1338 Oakley Dr, Baton Rouge, LA 70806
$-271
Cash flow
-2.9%
Cash-on-Cash Return
5.0%
Cap rate
0.6%
Rent to Value Ratio
Active
$69,900
3
bds
|
1
ba
|
2,160
sqft
|
built
1980
3004 Fairfields Ave, Baton Rouge, LA 70802
$828
Cash flow
13.8%
Cash-on-Cash Return
14.2%
Cap rate
1.7%
Rent to Value Ratio
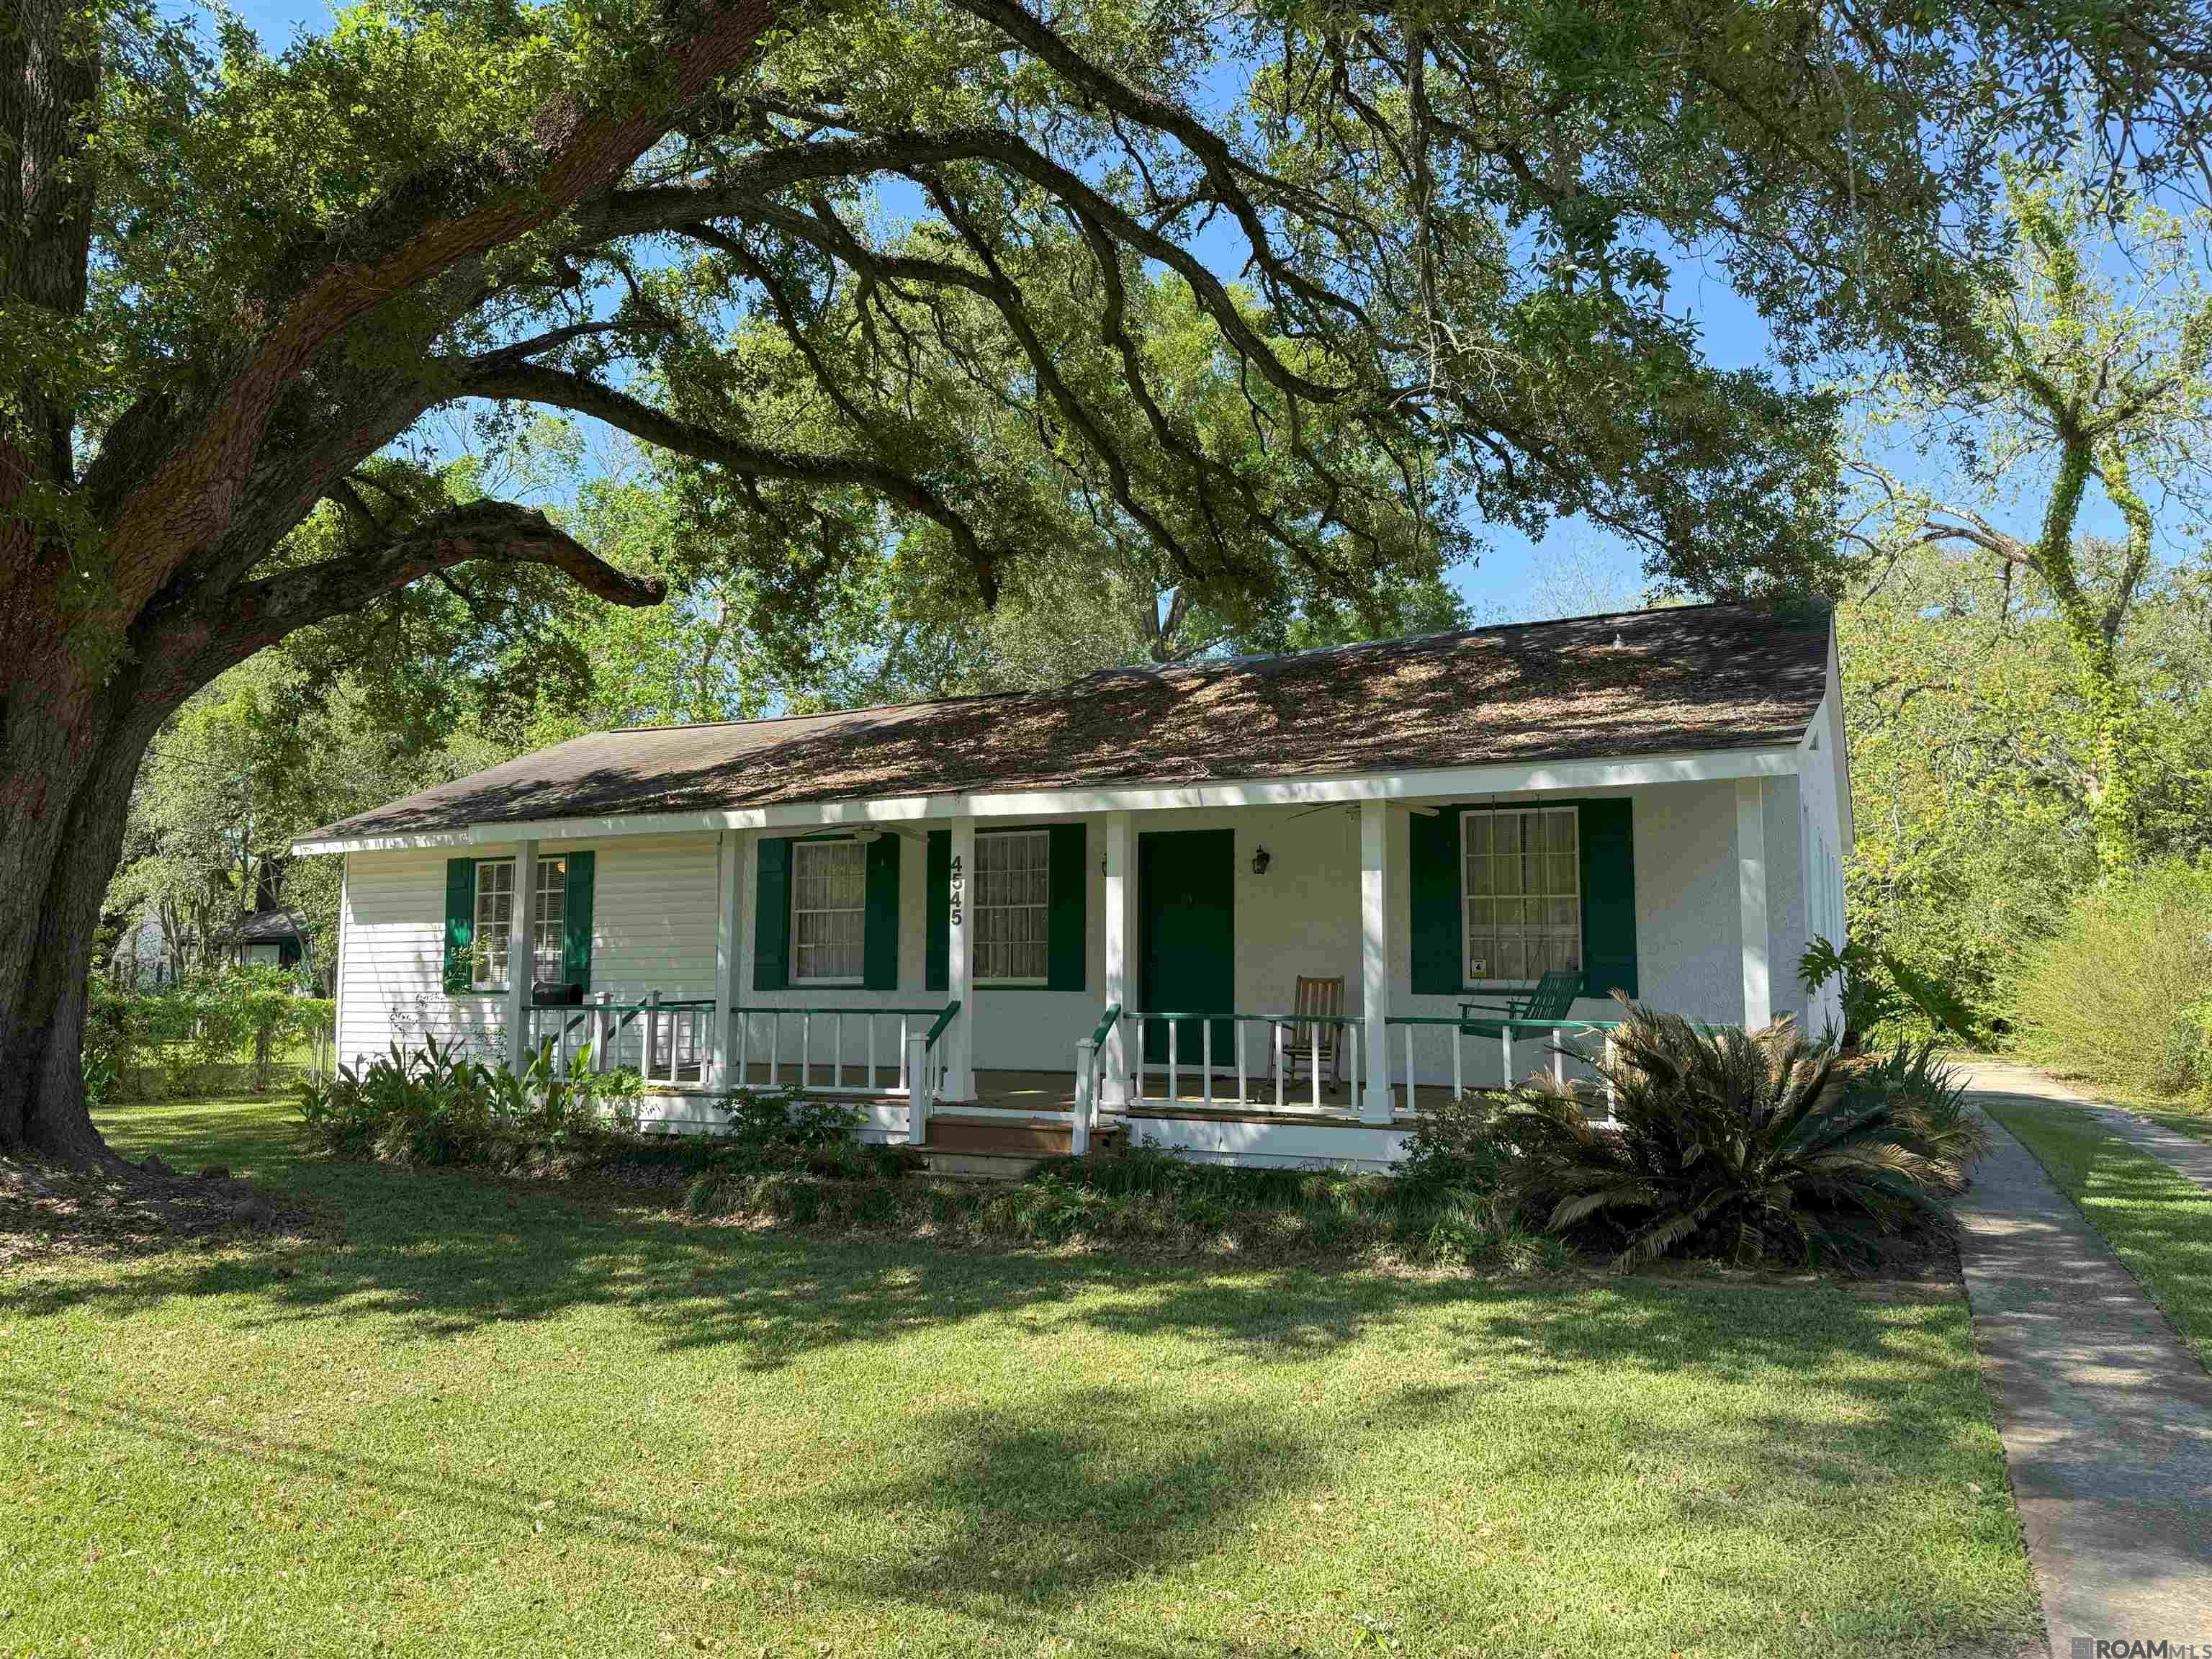
Active
$310,000
3
bds
|
2
ba
|
1,961
sqft
|
built
1960
4545 Orchid St, Baton Rouge, LA 70808
$51
Cash flow
0.9%
Cash-on-Cash Return
5.9%
Cap rate
0.7%
Rent to Value Ratio
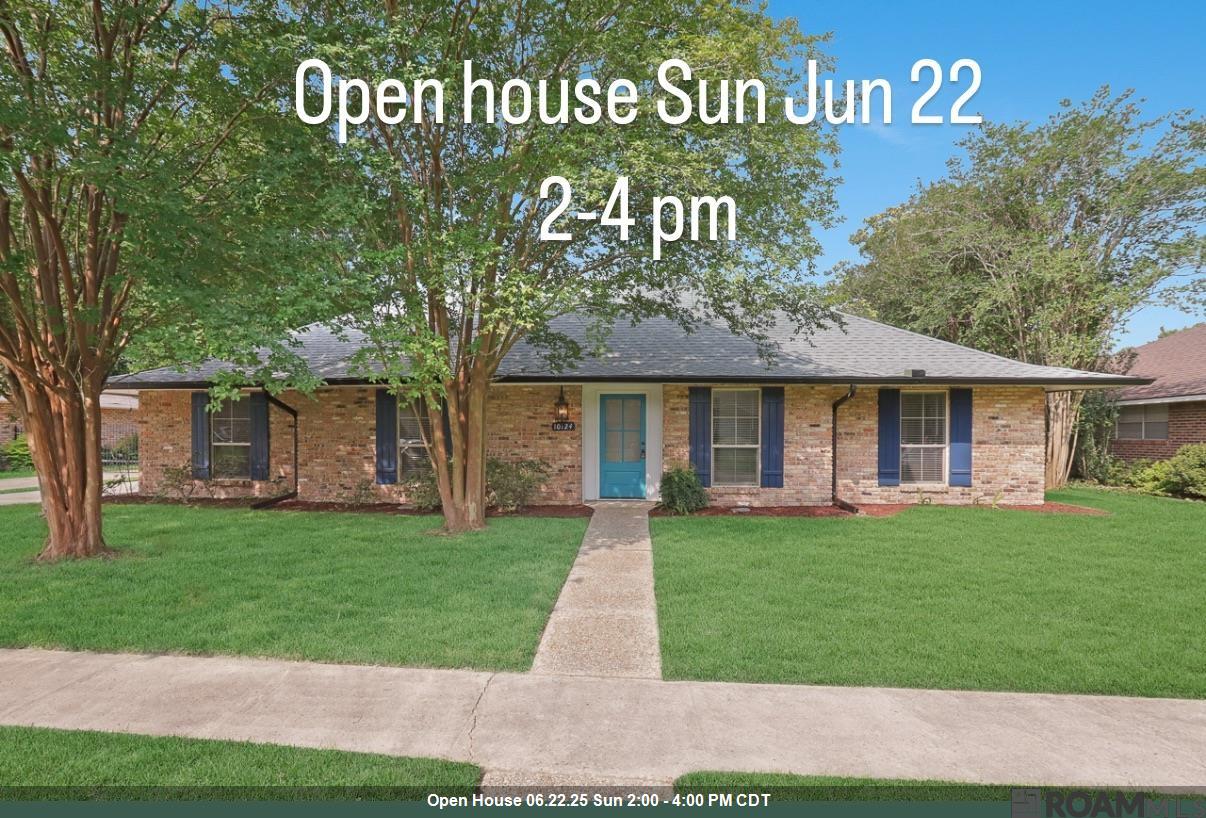
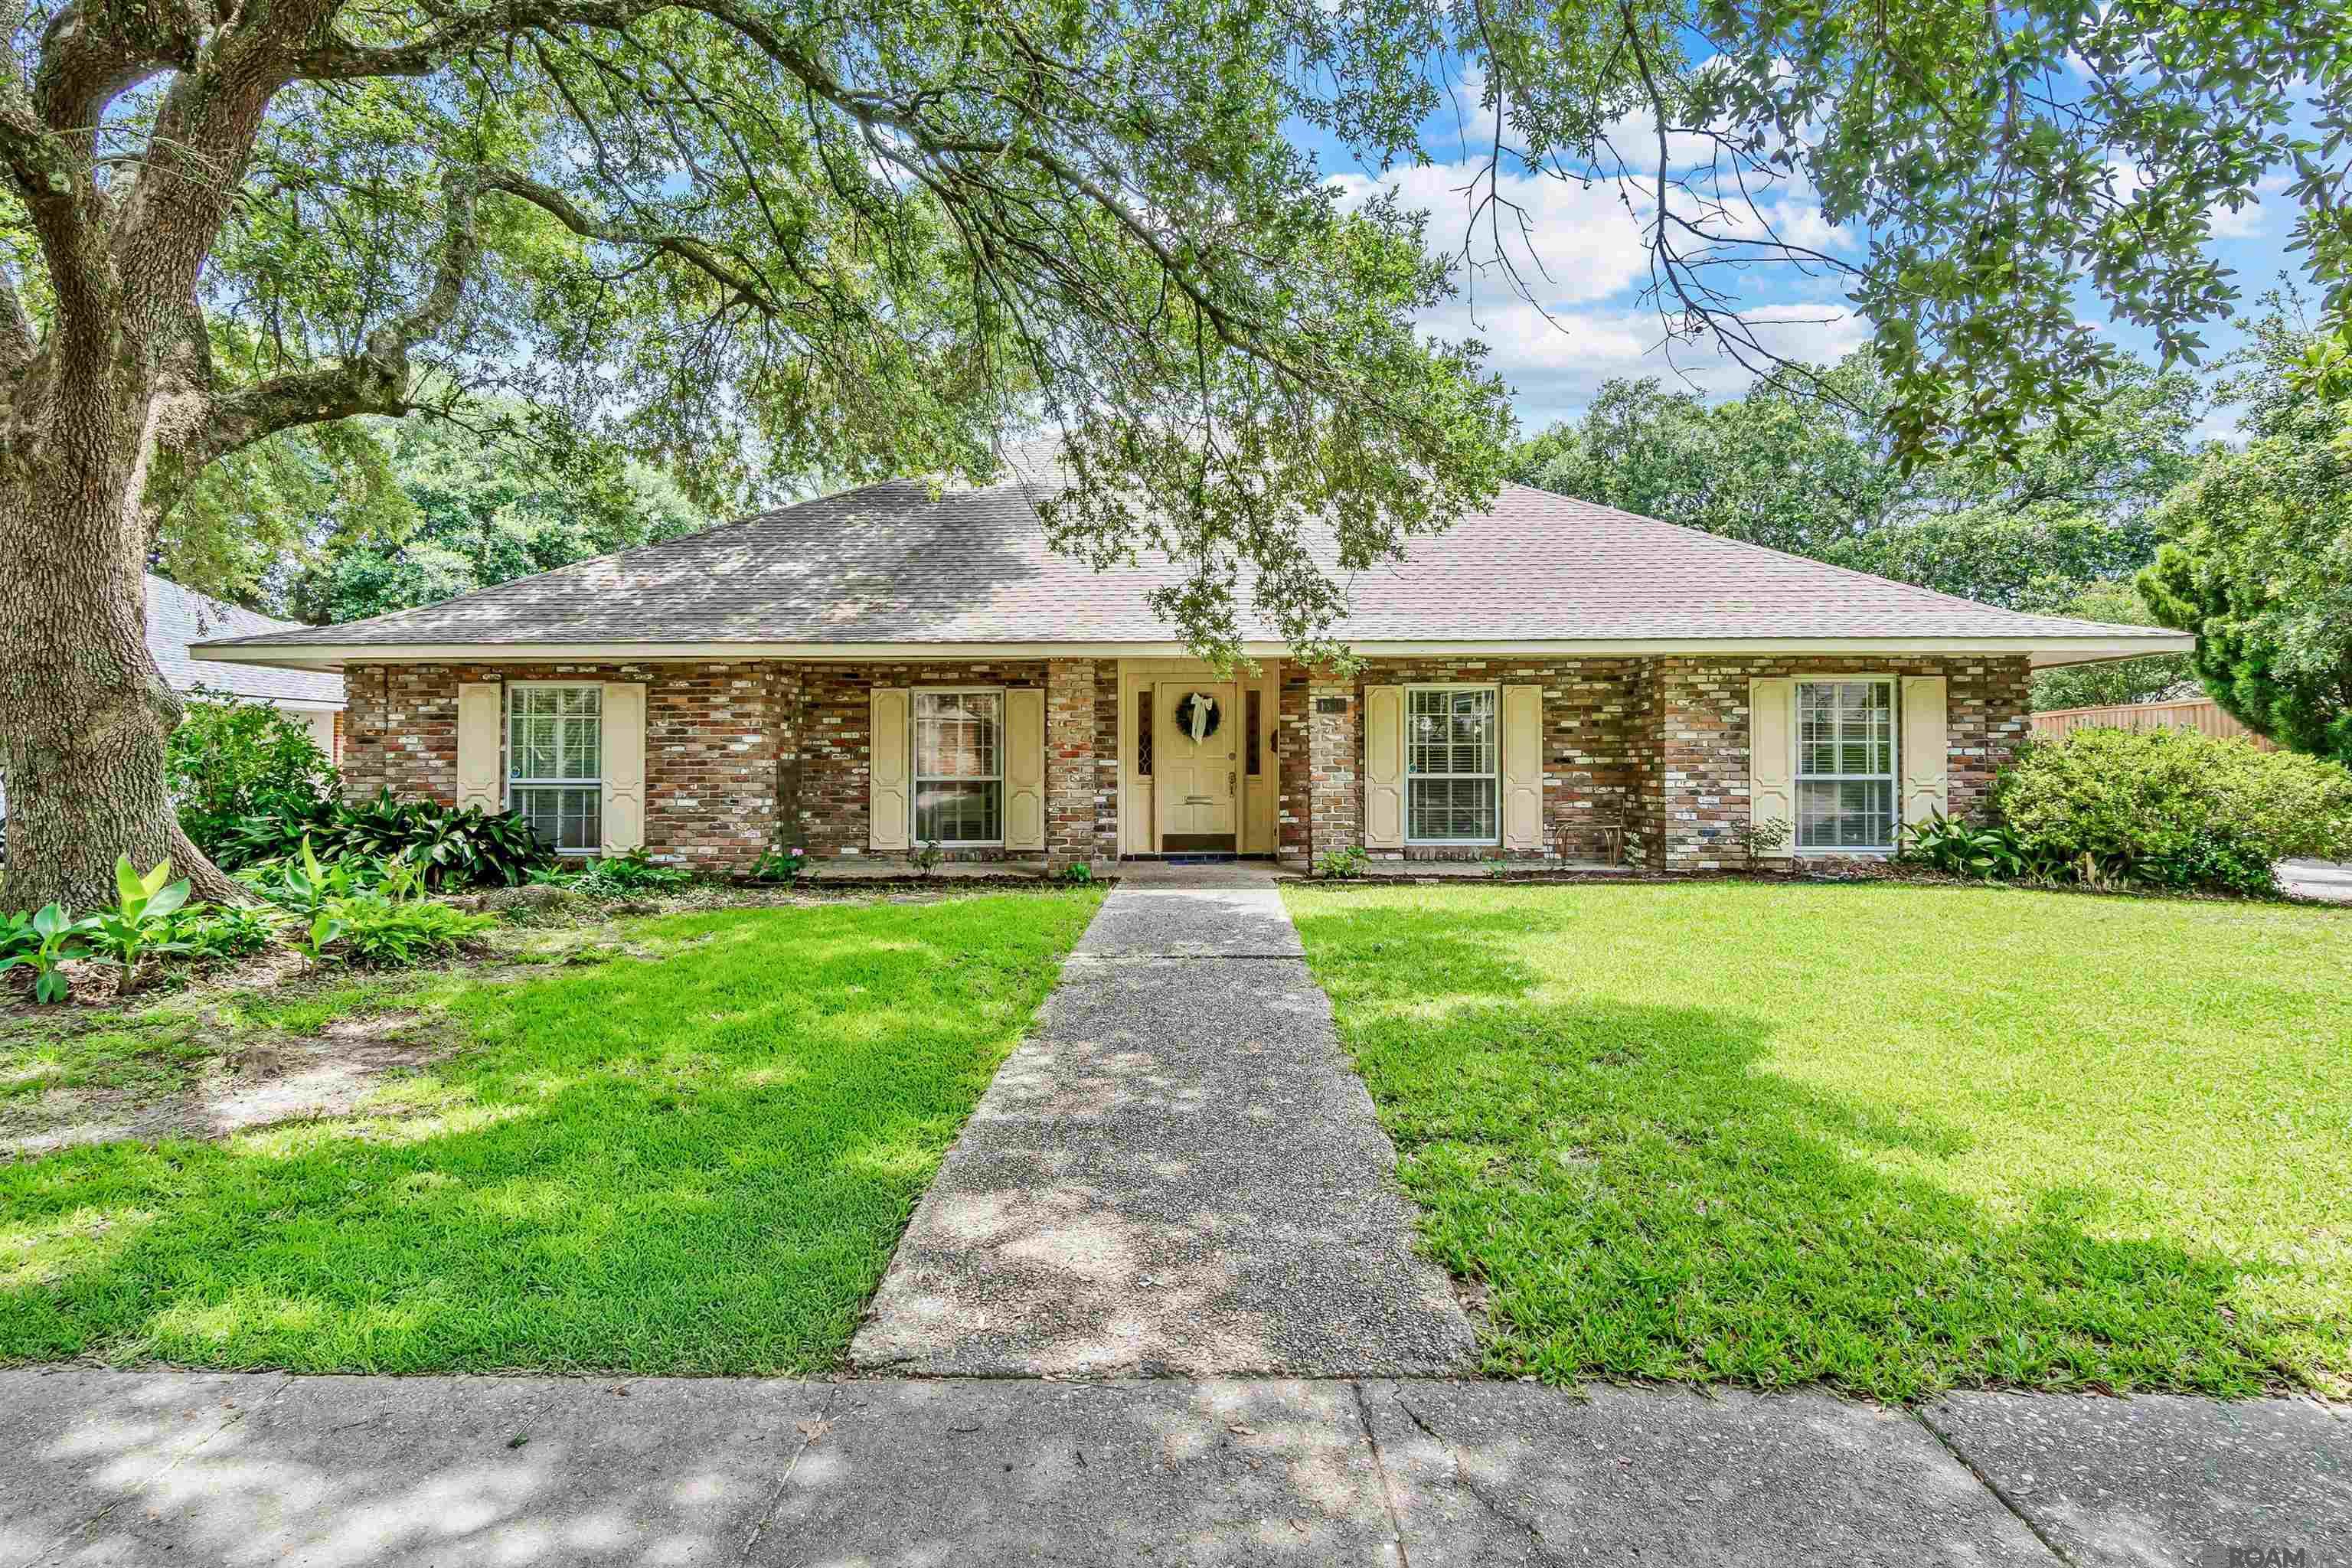
Active
$349,900
4
bds
|
3
ba
|
2,304
sqft
|
built
1981
10124 Hillsbury Dr, Baton Rouge, LA 70809
$66
Cash flow
1.0%
Cash-on-Cash Return
5.9%
Cap rate
0.7%
Rent to Value Ratio
Pending
$190,000
4
bds
|
2
ba
|
2,004
sqft
|
built
1974
11088 Mollylea Dr, Baton Rouge, LA 70815
$481
Cash flow
13.2%
Cash-on-Cash Return
8.7%
Cap rate
1.1%
Rent to Value Ratio
Active
$355,000
4
bds
|
2
ba
|
2,253
sqft
|
built
2016
17525 Waterloo Dr, Baton Rouge, LA 70817
$13
Cash flow
0.2%
Cash-on-Cash Return
5.7%
Cap rate
0.7%
Rent to Value Ratio
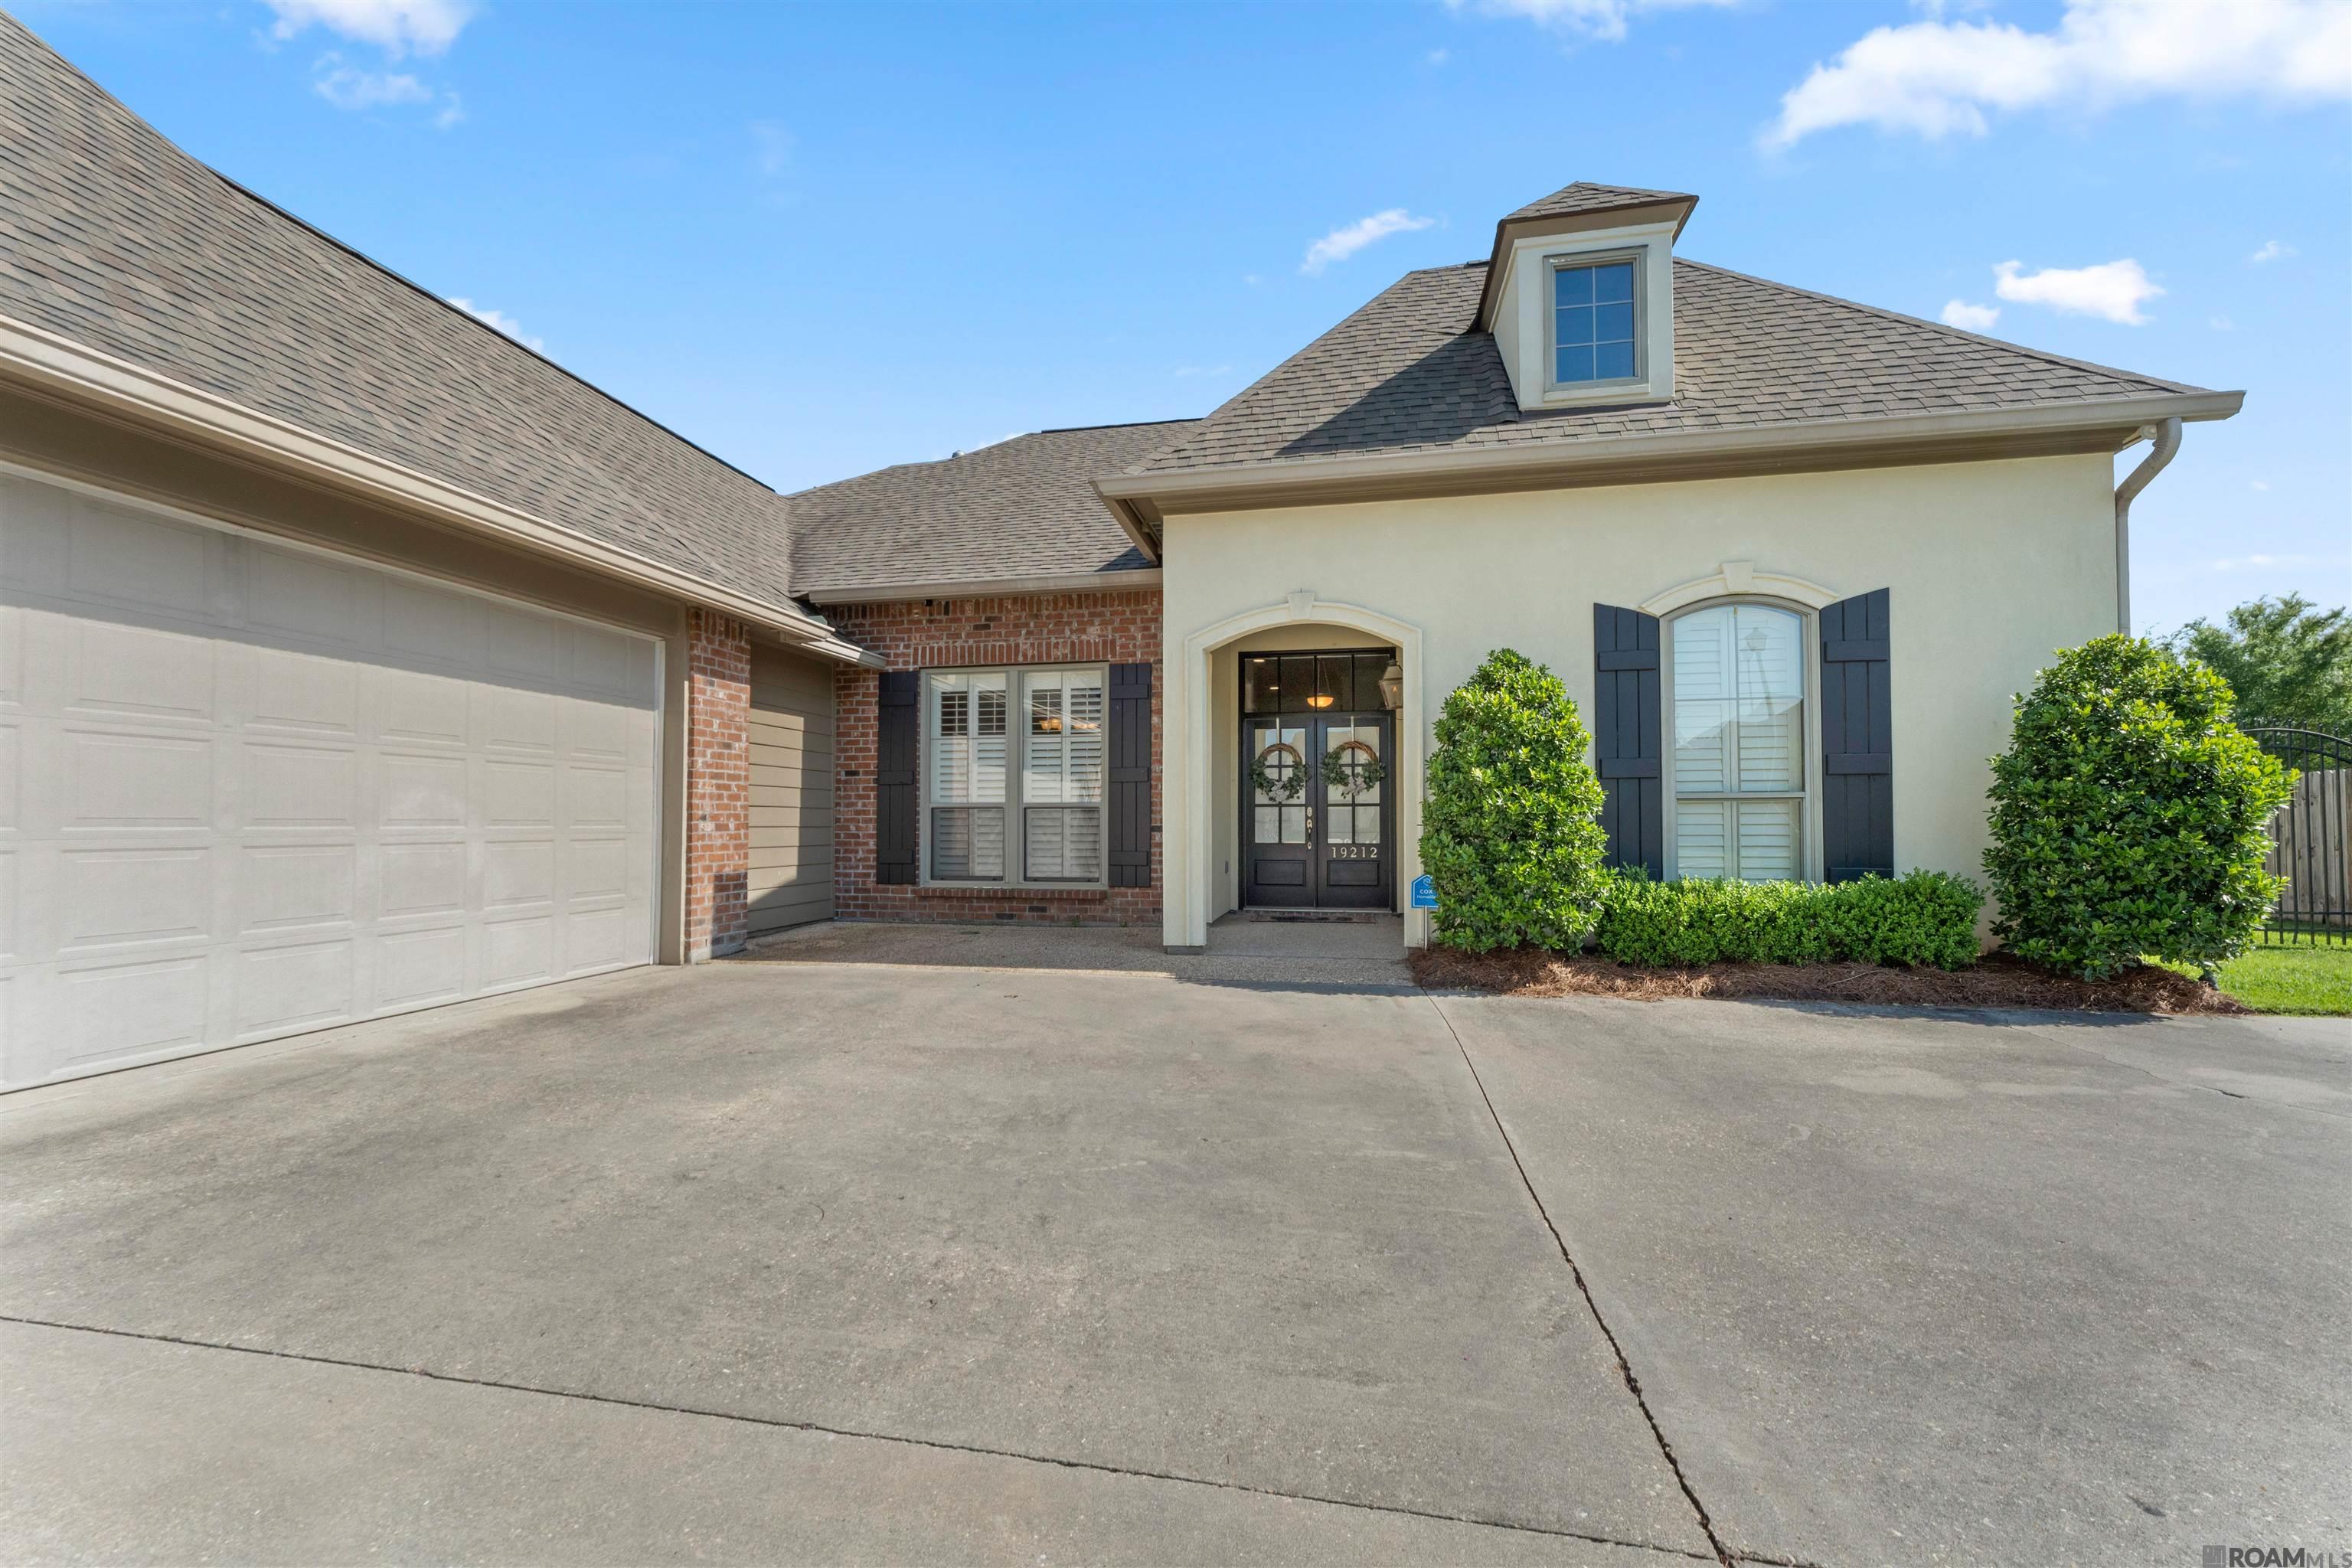
Active
$415,000
4
bds
|
3
ba
|
2,326
sqft
|
built
2007
19212 Merlot Ave, Baton Rouge, LA 70817
$-95
Cash flow
-1.2%
Cash-on-Cash Return
5.4%
Cap rate
0.7%
Rent to Value Ratio
Active
$665,000
4
bds
|
3
ba
|
3,281
sqft
|
built
1991
6911 S Fieldgate Ct, Baton Rouge, LA 70808
$-690
Cash flow
-5.4%
Cash-on-Cash Return
4.4%
Cap rate
0.5%
Rent to Value Ratio
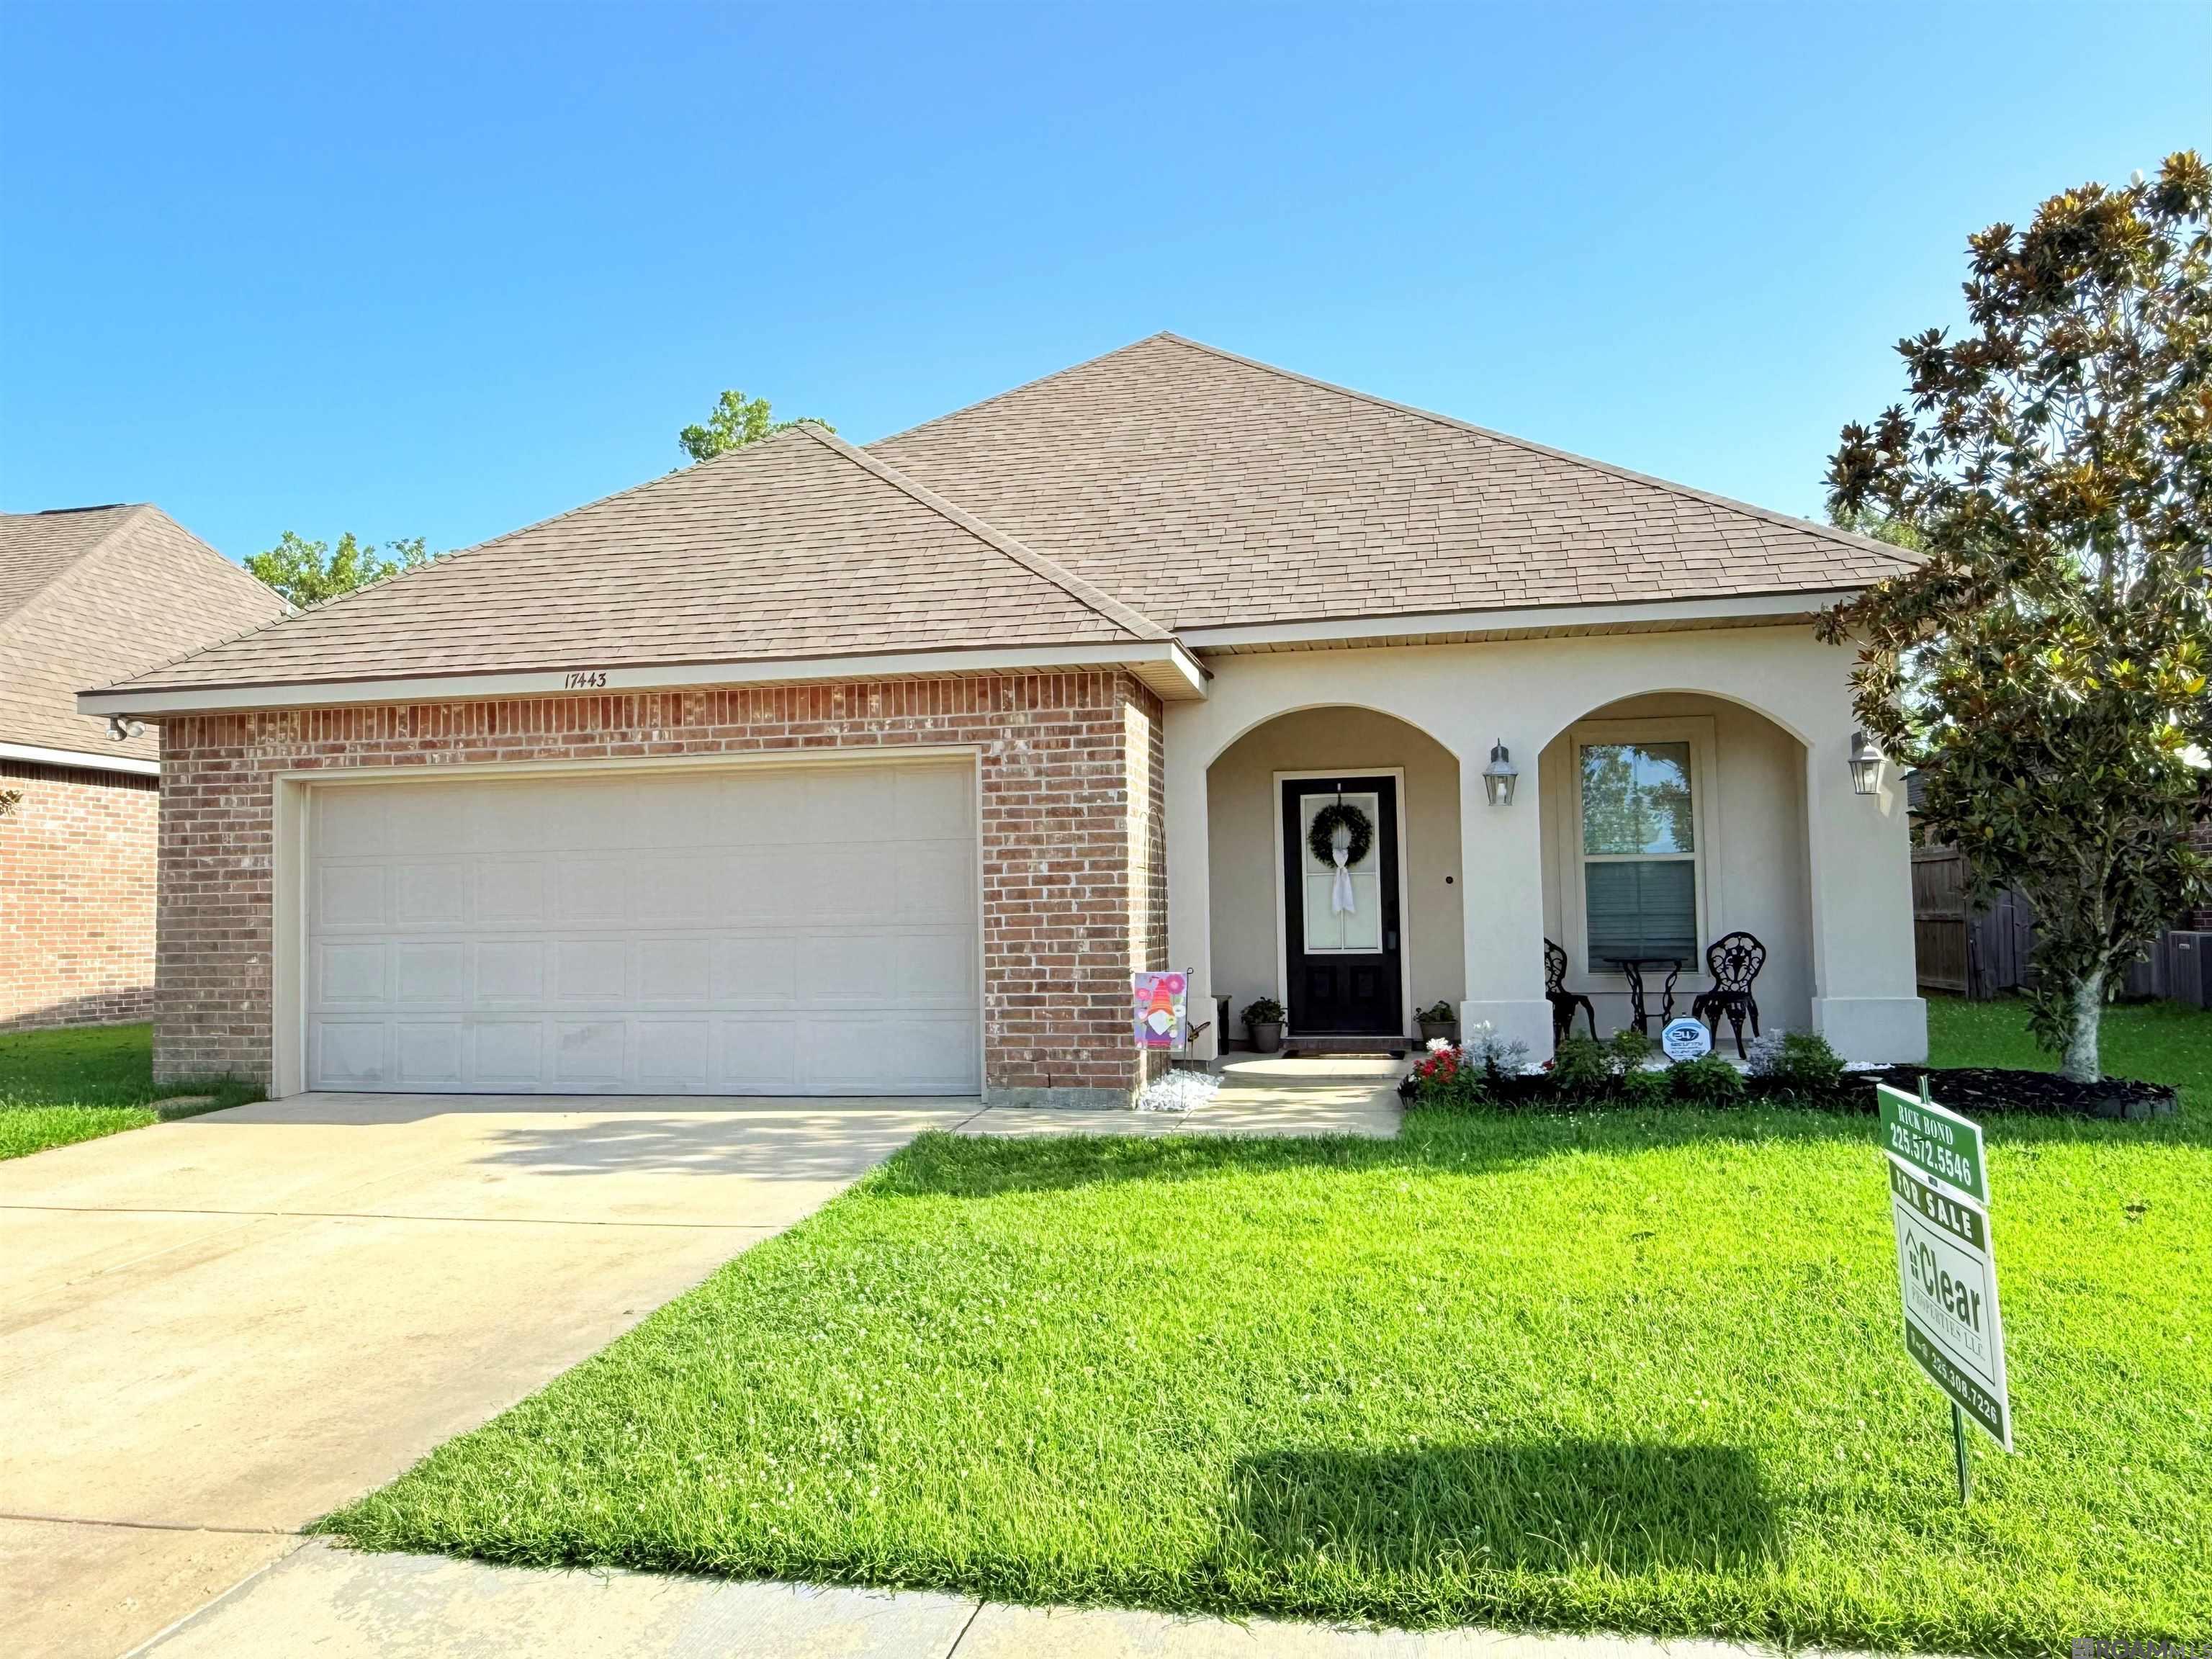
Active
$274,900
3
bds
|
2
ba
|
1,613
sqft
|
built
2016
17443 Waterloo Dr, Baton Rouge, LA 70817
$-160
Cash flow
-3.0%
Cash-on-Cash Return
5.0%
Cap rate
0.6%
Rent to Value Ratio
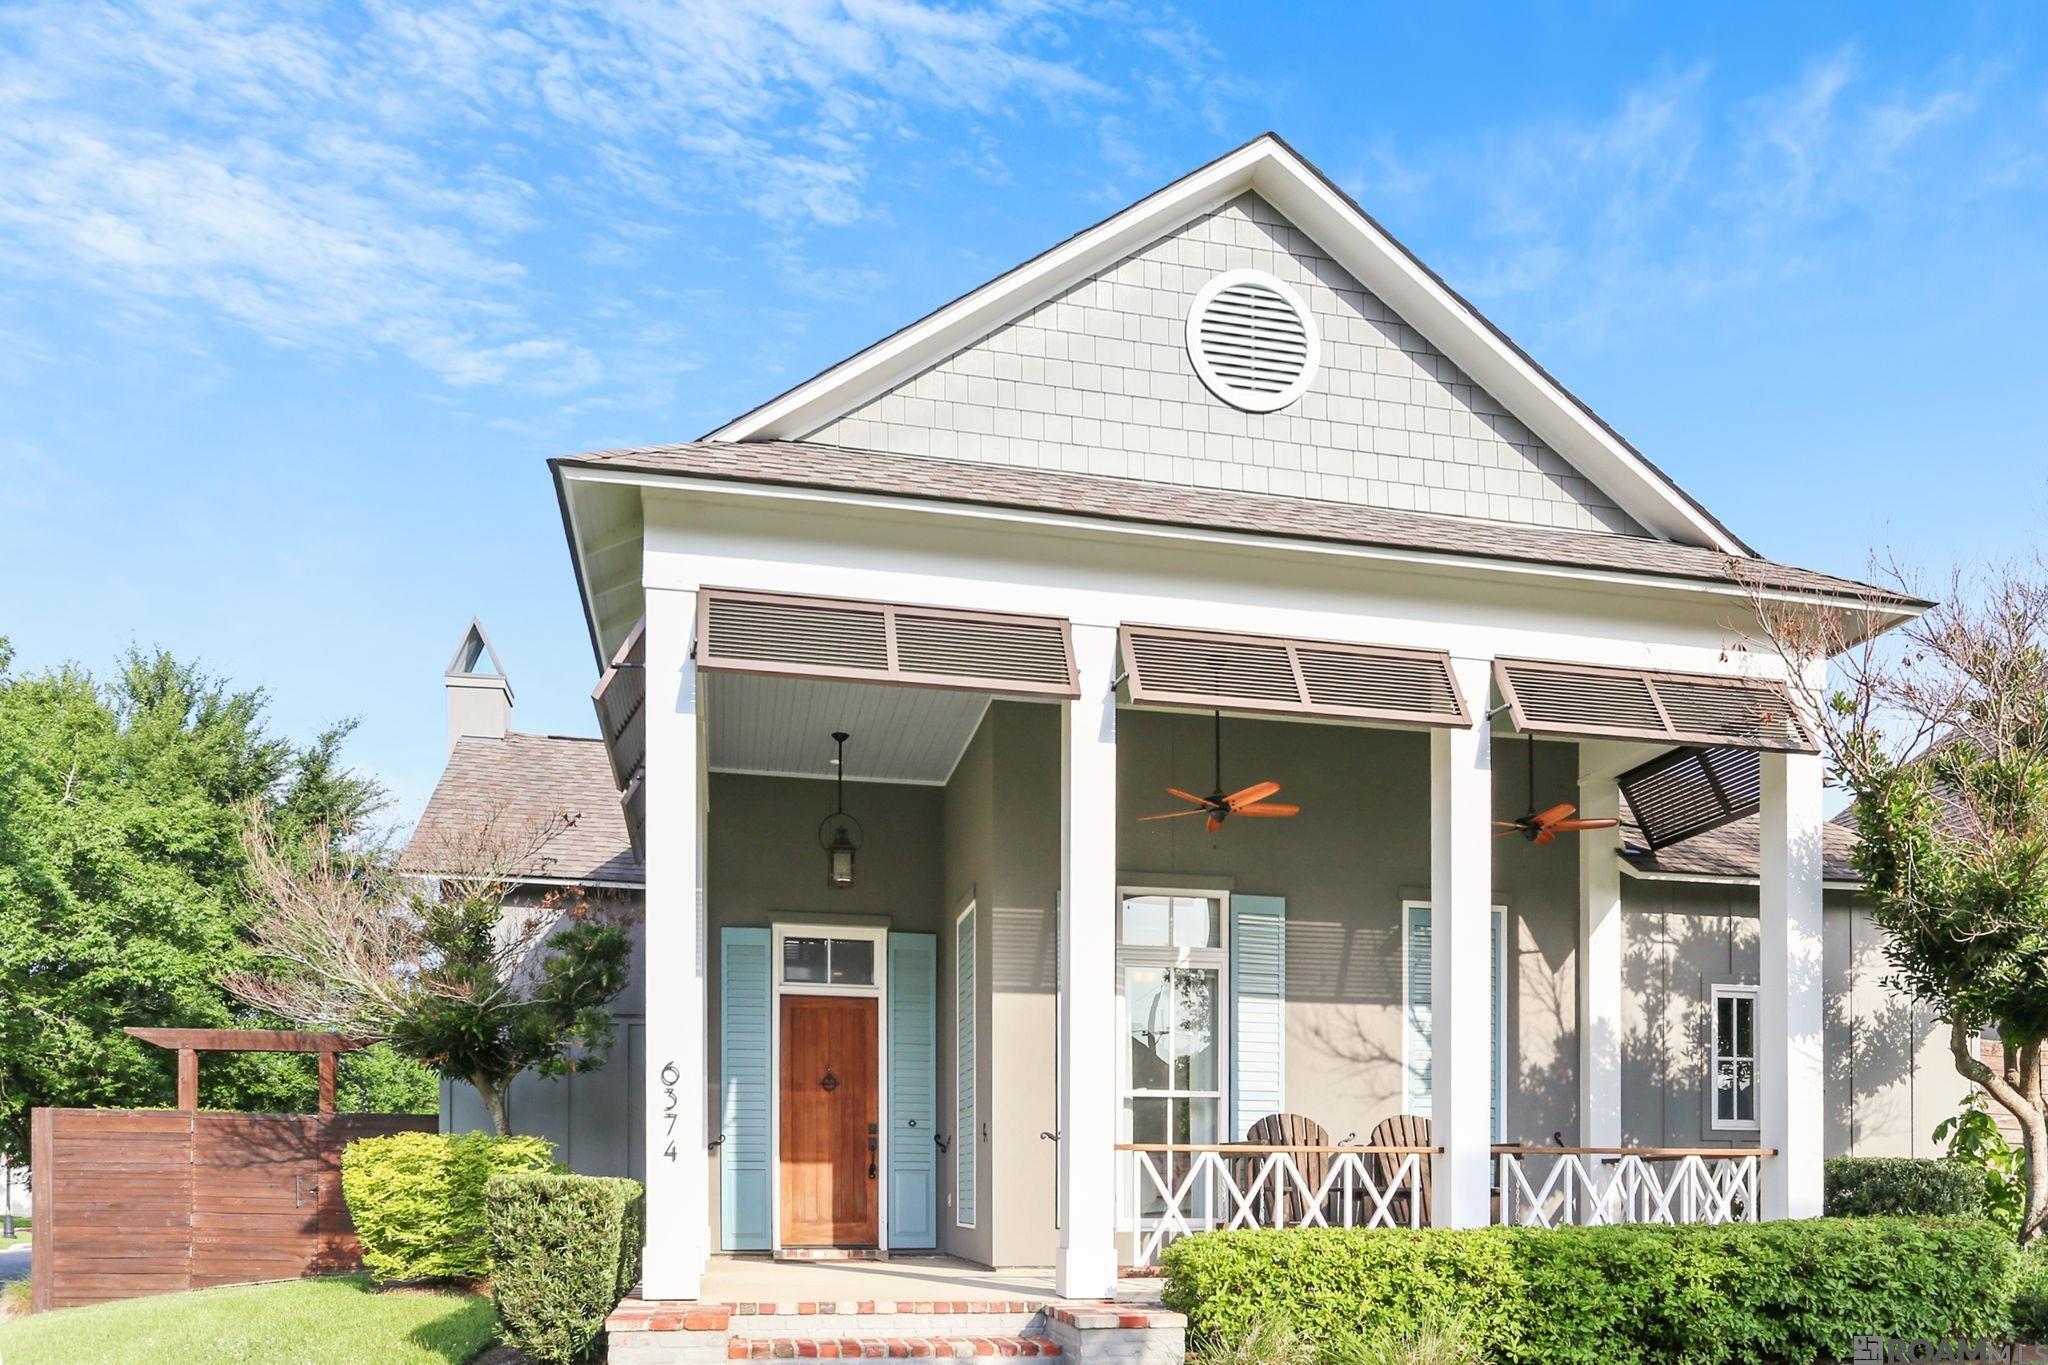
Active
$639,000
4
bds
|
3
ba
|
2,646
sqft
|
built
2014
6374 Muir St, Baton Rouge, LA 70817
$-375
Cash flow
-3.1%
Cash-on-Cash Return
5.0%
Cap rate
0.6%
Rent to Value Ratio
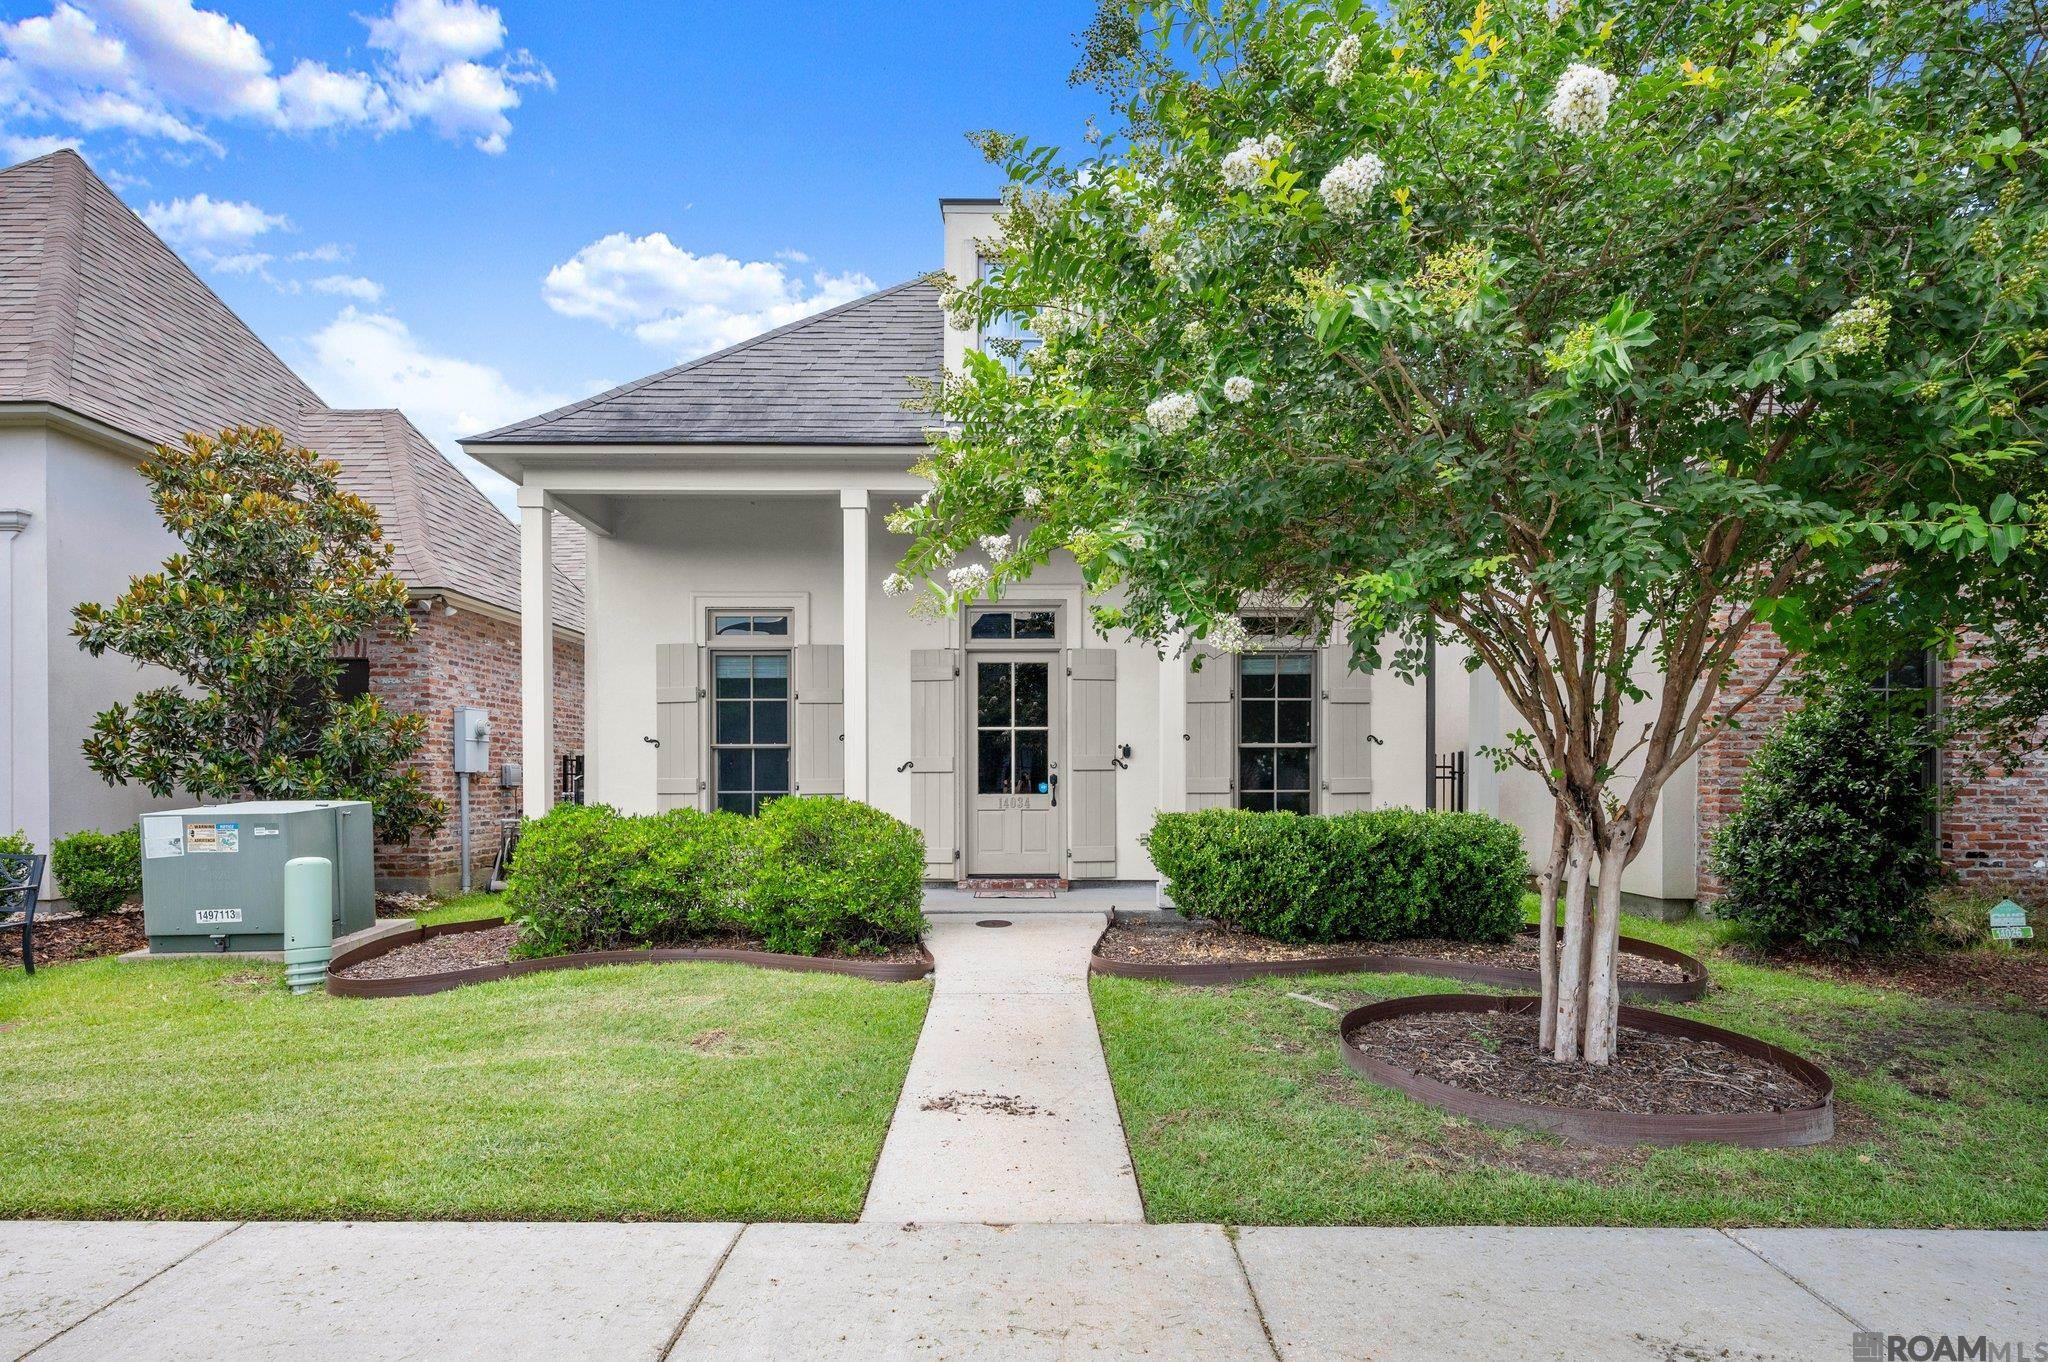
Active
$315,000
3
bds
|
2
ba
|
1,697
sqft
|
built
2016
14034 Arbor Grove Dr, Baton Rouge, LA 70810
$-600
Cash flow
-9.9%
Cash-on-Cash Return
3.4%
Cap rate
0.4%
Rent to Value Ratio
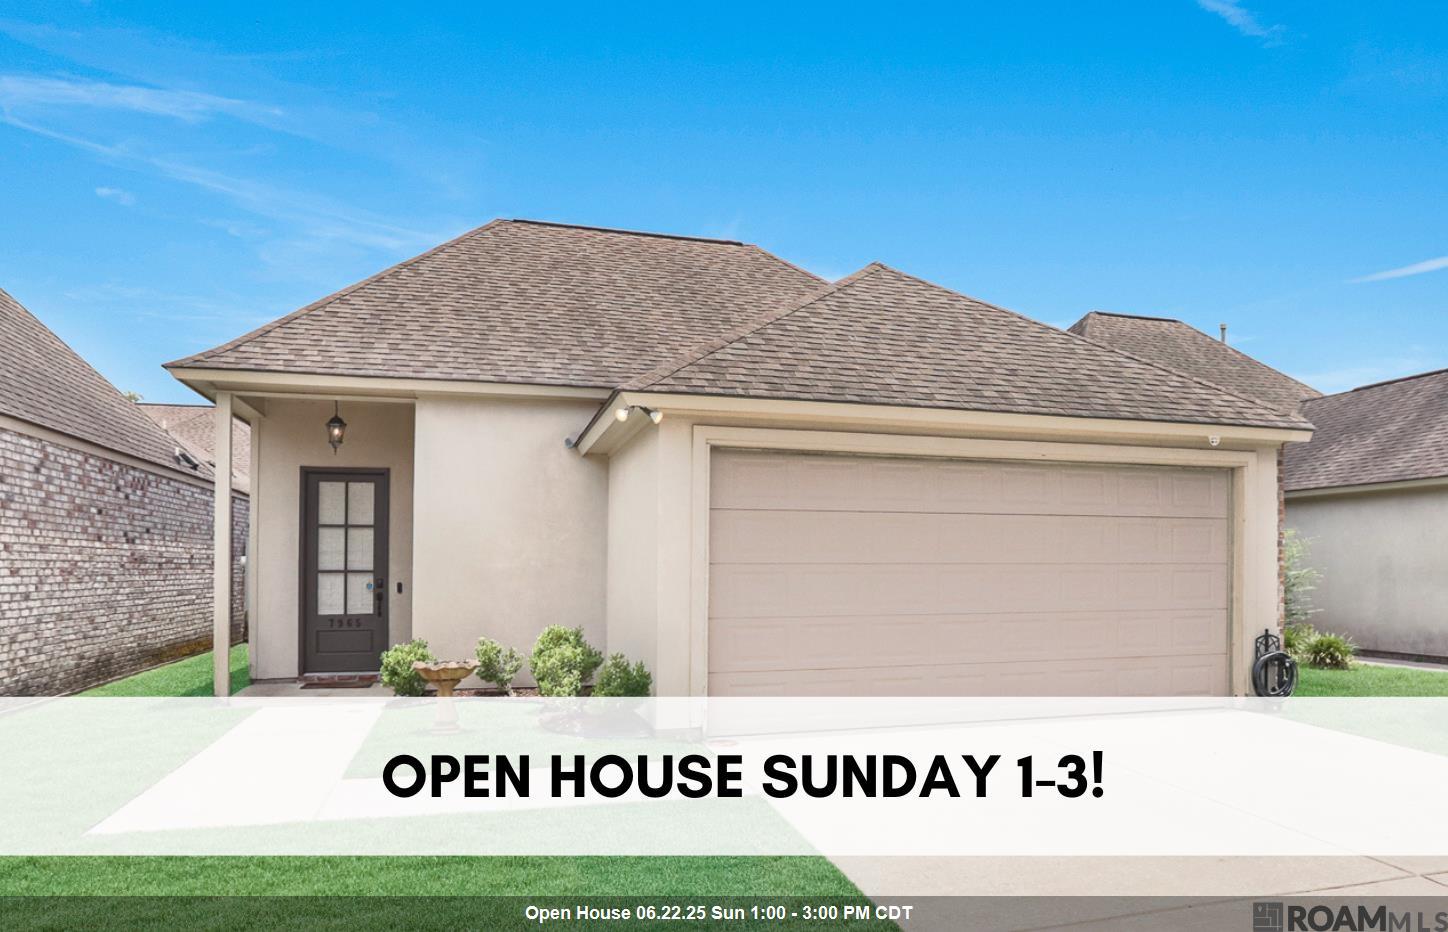
Active
$314,000
3
bds
|
2
ba
|
1,583
sqft
|
built
2013
7965 Seville Ct, Baton Rouge, LA 70820
$-35
Cash flow
-0.6%
Cash-on-Cash Return
5.5%
Cap rate
0.7%
Rent to Value Ratio
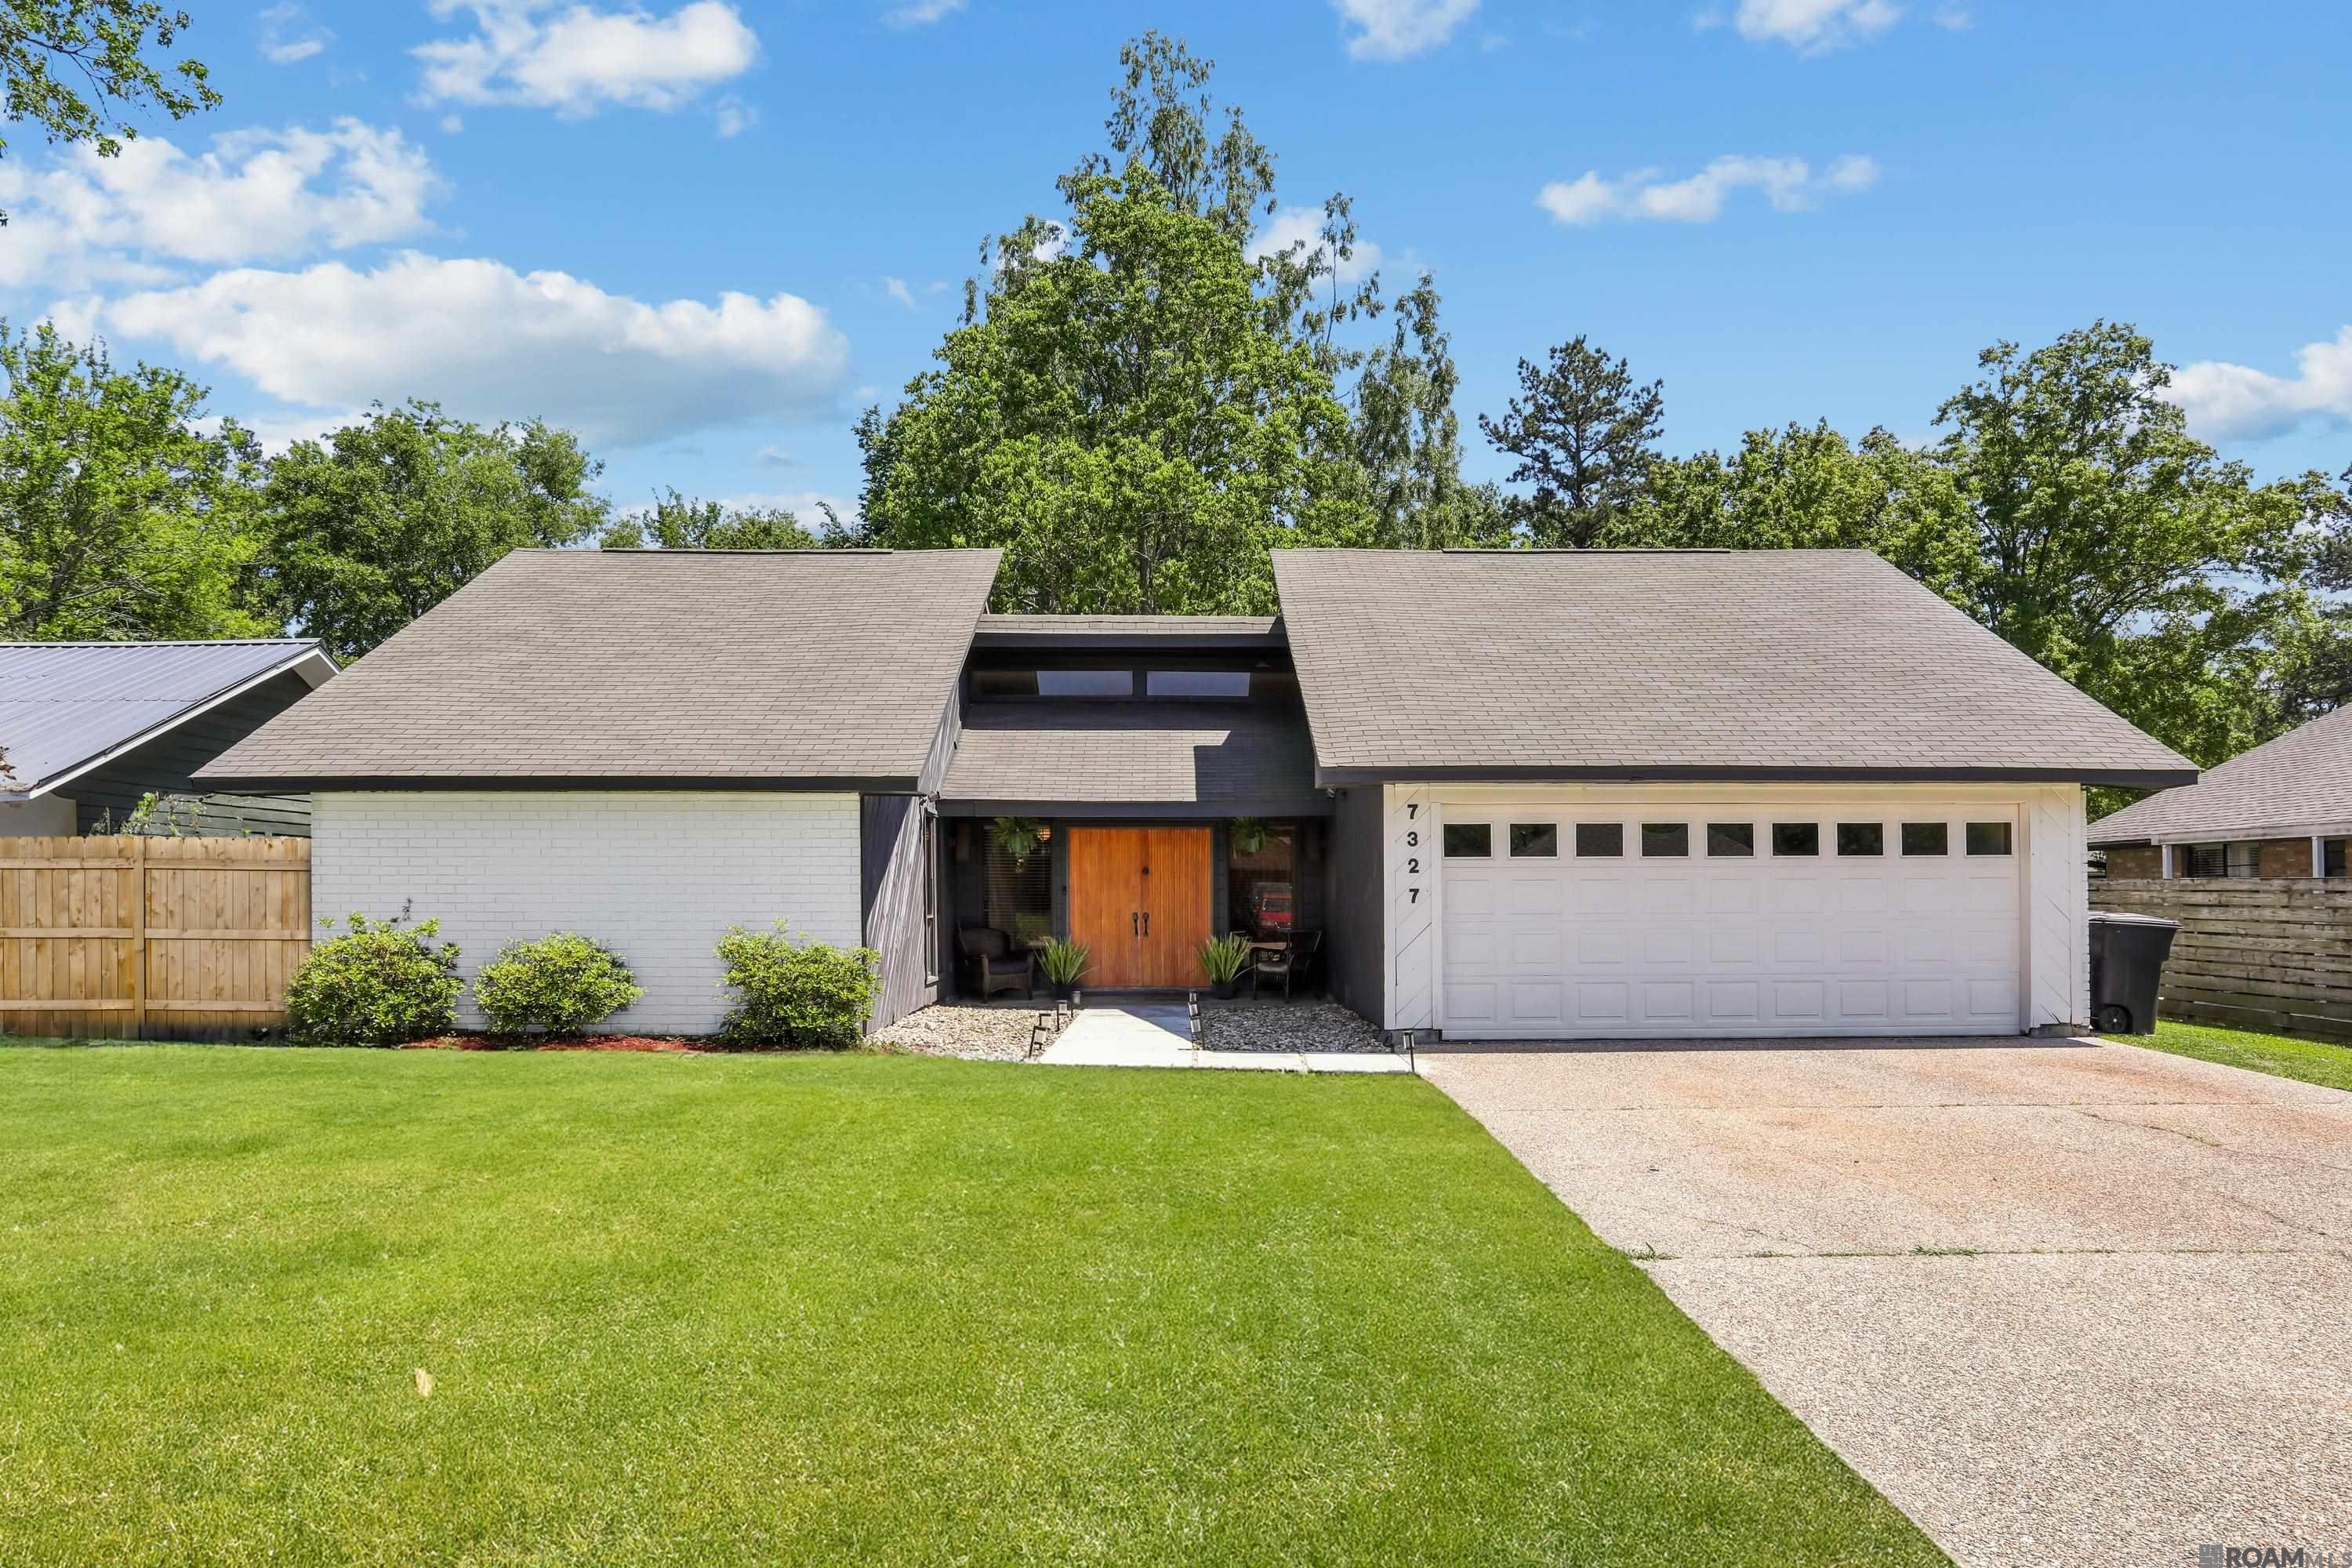
Active
$264,900
4
bds
|
2
ba
|
1,904
sqft
|
built
1977
7327 Briarplace Dr, Baton Rouge, LA 70817
$-34
Cash flow
-0.7%
Cash-on-Cash Return
5.5%
Cap rate
0.7%
Rent to Value Ratio