Baton Rouge, LA Investment Properties for Sale
Browse homes for sale and investment properties in Baton Rouge, LA. Refine your search by price, property type, or more.
Best cash flowing properties in Baton Rouge, LA
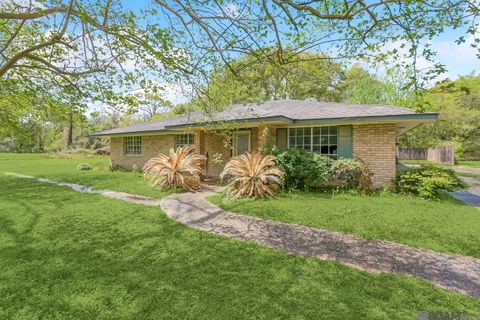
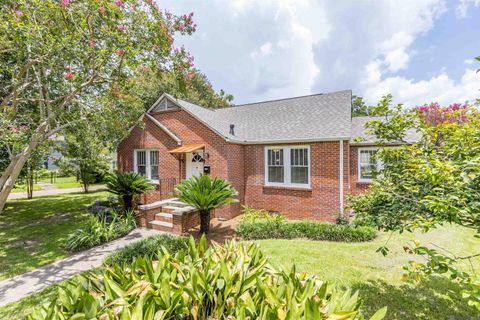
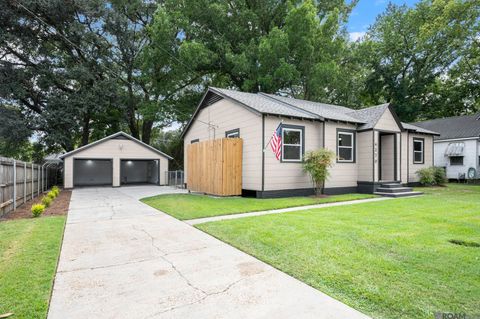
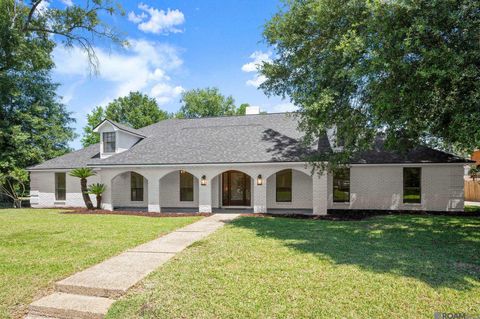
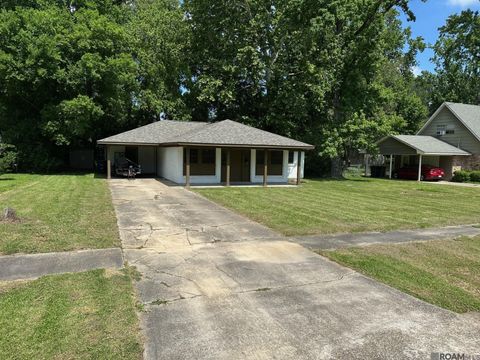
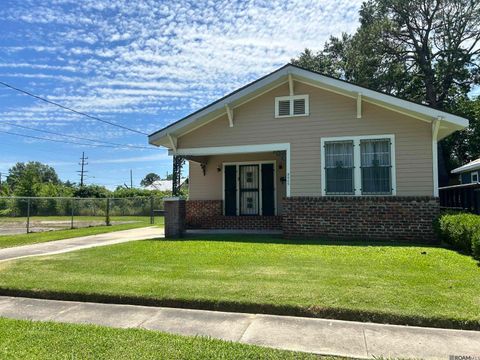
Active
$89,000
3
bds
|
2
ba
|
1,888
sqft
|
built
1975
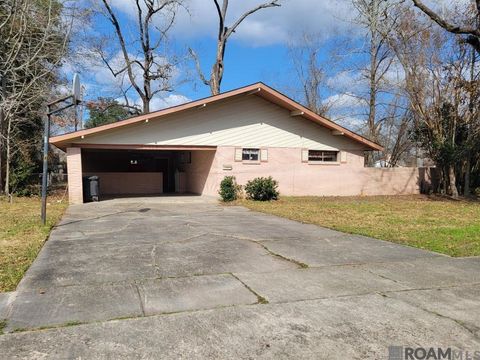
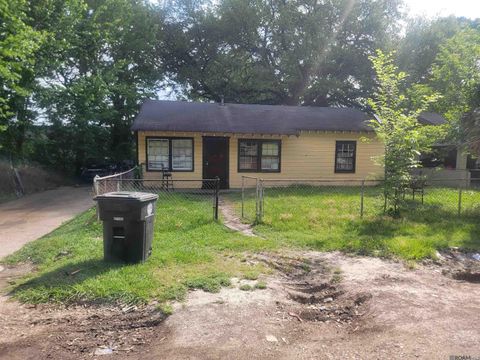
3783 Lone Oak Dr, Baton Rouge, LA 70814
$821
Cash flow
48.1%
Cash-on-Cash Return
16.7%
Cap rate
2.0%
Rent to Value Ratio
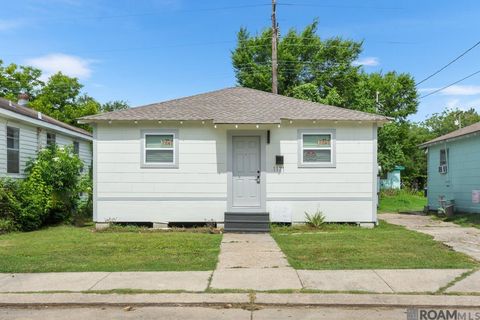
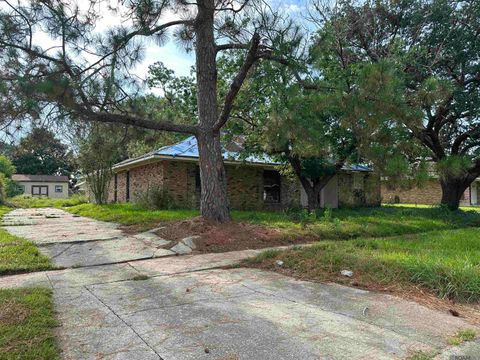
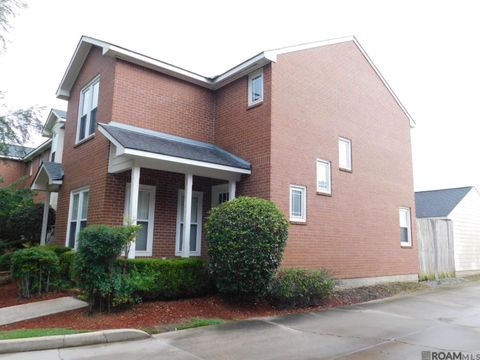
Active
$69,900
2
bds
|
1
ba
|
692
sqft
|
built
1975
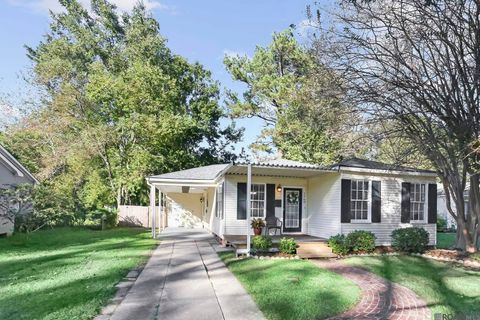
1171 N 46th St, Baton Rouge, LA 70802
$759
Cash flow
12.7%
Cash-on-Cash Return
13.0%
Cap rate
1.6%
Rent to Value Ratio
902 out of 1,166 properties for sale in Baton Rouge, LA
Limited Results Shown
Create a free account, or log in to reveal all property listings and enjoy the complete experience.
Active
$275,000
3
bds
|
3
ba
|
1,889
sqft
|
built
1973
5236 Floynell Dr, Baton Rouge, LA 70809
$79
Cash flow
1.5%
Cash-on-Cash Return
6.0%
Cap rate
0.7%
Rent to Value Ratio
Active
$295,000
3
bds
|
2
ba
|
2,193
sqft
|
built
1978
5422 Bayridge Dr, Baton Rouge, LA 70817
$-158
Cash flow
-2.8%
Cash-on-Cash Return
5.0%
Cap rate
0.6%
Rent to Value Ratio
Active
$725,000
3
bds
|
3
ba
|
2,285
sqft
|
built
2008
998 Stanford Ave, Baton Rouge, LA 70808
$-2,496
Cash flow
-18.0%
Cash-on-Cash Return
1.5%
Cap rate
0.4%
Rent to Value Ratio
Active
$159,900
3
bds
|
1
ba
|
908
sqft
|
built
1967
9621 Foster Rd, Baton Rouge, LA 70811
$209
Cash flow
6.8%
Cash-on-Cash Return
7.2%
Cap rate
0.9%
Rent to Value Ratio
Active
$239,900
4
bds
|
3
ba
|
2,176
sqft
|
built
1974
11368 Pamela Dr, Baton Rouge, LA 70815
$38
Cash flow
0.8%
Cash-on-Cash Return
5.9%
Cap rate
0.7%
Rent to Value Ratio
Active
$389,000
3
bds
|
2
ba
|
1,866
sqft
|
built
1950
286 Kenwood Ave, Baton Rouge, LA 70806
$-116
Cash flow
-1.6%
Cash-on-Cash Return
5.3%
Cap rate
0.6%
Rent to Value Ratio
Active
$310,000
2
bds
|
1
ba
|
1,419
sqft
|
built
1938
2007 Ovid St, Baton Rouge, LA 70808
$-87
Cash flow
-1.5%
Cash-on-Cash Return
5.3%
Cap rate
0.6%
Rent to Value Ratio
Active
$159,900
3
bds
|
2
ba
|
1,712
sqft
|
built
1976
4930 Shadeland Dr, Baton Rouge, LA 70816
$485
Cash flow
15.8%
Cash-on-Cash Return
9.3%
Cap rate
1.1%
Rent to Value Ratio
Active
$144,900
3
bds
|
2
ba
|
1,213
sqft
|
built
1984
2252 Brightside Dr, Baton Rouge, LA 70820
$309
Cash flow
11.1%
Cash-on-Cash Return
8.2%
Cap rate
1.0%
Rent to Value Ratio
Active
$340,000
4
bds
|
2
ba
|
1,828
sqft
|
built
2017
14056 Park Terrace Dr, Baton Rouge, LA 70810
$83
Cash flow
1.3%
Cash-on-Cash Return
6.0%
Cap rate
0.7%
Rent to Value Ratio
Active
$269,900
2
bds
|
2
ba
|
1,363
sqft
|
built
1945
4270 Convention St, Baton Rouge, LA 70806
$-518
Cash flow
-10.0%
Cash-on-Cash Return
3.4%
Cap rate
0.4%
Rent to Value Ratio
Active
$237,500
2
bds
|
3
ba
|
1,440
sqft
|
built
2005
1329 Bromley Park Dr, Baton Rouge, LA 70810
$-57
Cash flow
-1.3%
Cash-on-Cash Return
5.4%
Cap rate
0.8%
Rent to Value Ratio
Active
$119,900
2
bds
|
2
ba
|
879
sqft
|
built
1960
1290 Park Blvd, Baton Rouge, LA 70806
$-158
Cash flow
-6.9%
Cash-on-Cash Return
4.1%
Cap rate
0.9%
Rent to Value Ratio
Active
$350,000
4
bds
|
3
ba
|
2,159
sqft
|
built
2021
13930 Keever Ave, Baton Rouge, LA 70817
$214
Cash flow
3.2%
Cash-on-Cash Return
6.4%
Cap rate
0.8%
Rent to Value Ratio
Active
$510,500
4
bds
|
4
ba
|
4,377
sqft
|
built
1985
5705 Georgetown Ave, Baton Rouge, LA 70808
$-626
Cash flow
-6.4%
Cash-on-Cash Return
4.2%
Cap rate
0.5%
Rent to Value Ratio

Active
$599,900
3
bds
|
3
ba
|
2,903
sqft
|
built
2022
14241 Spalding Way, Baton Rouge, LA 70817
$-495
Cash flow
-4.3%
Cash-on-Cash Return
4.7%
Cap rate
0.6%
Rent to Value Ratio
Active
$425,000
4
bds
|
3
ba
|
2,310
sqft
|
built
1992
18421 Lake Iris Ave, Baton Rouge, LA 70817
$-299
Cash flow
-3.7%
Cash-on-Cash Return
4.8%
Cap rate
0.6%
Rent to Value Ratio
Active
$400,000
3
bds
|
3
ba
|
2,242
sqft
|
built
1991
13333 Dorset Ave, Baton Rouge, LA 70818
$39
Cash flow
0.5%
Cash-on-Cash Return
5.8%
Cap rate
0.7%
Rent to Value Ratio
Active
$389,500
4
bds
|
3
ba
|
2,252
sqft
|
built
1985
6017 Hickory Ridge Blvd, Baton Rouge, LA 70817
$-118
Cash flow
-1.6%
Cash-on-Cash Return
5.3%
Cap rate
0.6%
Rent to Value Ratio
Active
$169,000
3
bds
|
2
ba
|
1,684
sqft
|
built
1966
11775 Parkwood Dr, Baton Rouge, LA 70815
$438
Cash flow
13.5%
Cash-on-Cash Return
8.8%
Cap rate
1.1%
Rent to Value Ratio
Active
$295,000
2
bds
|
2
ba
|
1,339
sqft
|
built
1950
600 Blanchard St, Baton Rouge, LA 70806
$-154
Cash flow
-2.7%
Cash-on-Cash Return
5.1%
Cap rate
0.6%
Rent to Value Ratio
Active
$355,000
3
bds
|
2
ba
|
2,076
sqft
|
built
2005
16632 Highland Club Ave, Baton Rouge, LA 70817
$-122
Cash flow
-1.8%
Cash-on-Cash Return
5.3%
Cap rate
0.6%
Rent to Value Ratio
Active
$275,000
3
bds
|
1
ba
|
1,380
sqft
|
built
1952
7769 Lasalle Ave, Baton Rouge, LA 70806
$-61
Cash flow
-1.2%
Cash-on-Cash Return
5.4%
Cap rate
0.7%
Rent to Value Ratio
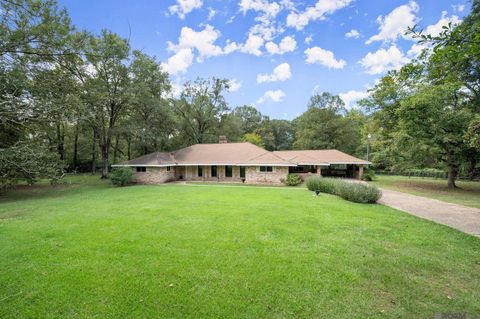
Active
$530,000
4
bds
|
4
ba
|
3,004
sqft
|
built
1990
14513 N Majestic Oaks Pl, Baton Rouge, LA 70810
$-377
Cash flow
-3.7%
Cash-on-Cash Return
4.8%
Cap rate
0.6%
Rent to Value Ratio
Active
$451,000
4
bds
|
3
ba
|
2,236
sqft
|
built
2022
13174 Elissa Ln, Baton Rouge, LA 70818
$-1,088
Cash flow
-12.6%
Cash-on-Cash Return
2.8%
Cap rate
0.4%
Rent to Value Ratio
Active
$275,000
bds
|
0
ba
|
2,114
sqft
|
built
638 Eddie Robinson Sr Dr, Baton Rouge, LA 70802
$79
Cash flow
1.5%
Cash-on-Cash Return
6.0%
Cap rate
0.7%
Rent to Value Ratio
Active
$430,000
3
bds
|
2
ba
|
1,679
sqft
|
built
2022
14232 Haile Way, Baton Rouge, LA 70817
$-308
Cash flow
-3.7%
Cash-on-Cash Return
4.8%
Cap rate
0.6%
Rent to Value Ratio
Active
$259,500
3
bds
|
2
ba
|
1,446
sqft
|
built
1972
525 Baird Dr, Baton Rouge, LA 70808
$-331
Cash flow
-6.7%
Cash-on-Cash Return
4.1%
Cap rate
0.5%
Rent to Value Ratio
Active
$475,000
4
bds
|
4
ba
|
4,415
sqft
|
built
1965
9555 Goodwood Blvd, Baton Rouge, LA 70815
$-523
Cash flow
-5.7%
Cash-on-Cash Return
4.4%
Cap rate
0.5%
Rent to Value Ratio

Active
$290,900
3
bds
|
2
ba
|
2,416
sqft
|
built
2007
14737 Rhonda Ave, Baton Rouge, LA 70816
$72
Cash flow
1.3%
Cash-on-Cash Return
6.0%
Cap rate
0.7%
Rent to Value Ratio
Active
$299,000
3
bds
|
2
ba
|
1,808
sqft
|
built
1930
730 Camelia Ave, Baton Rouge, LA 70806
$-449
Cash flow
-7.8%
Cash-on-Cash Return
3.9%
Cap rate
0.5%
Rent to Value Ratio
Active
$274,000
4
bds
|
3
ba
|
1,975
sqft
|
built
1986
13141 Devall Rd, Baton Rouge, LA 70818
$-193
Cash flow
-3.7%
Cash-on-Cash Return
4.8%
Cap rate
0.6%
Rent to Value Ratio
Active
$125,000
2
bds
|
1
ba
|
1,665
sqft
|
built
1975
2060 Hemlock St, Baton Rouge, LA 70802
$167
Cash flow
7.0%
Cash-on-Cash Return
7.3%
Cap rate
0.9%
Rent to Value Ratio
Active
$499,000
5
bds
|
4
ba
|
4,065
sqft
|
built
1983
12024 Lovett Rd, Baton Rouge, LA 70818
$123
Cash flow
1.3%
Cash-on-Cash Return
6.0%
Cap rate
0.7%
Rent to Value Ratio
Active
$248,000
3
bds
|
2
ba
|
1,861
sqft
|
built
1987
15166 Cocodrie Ave, Baton Rouge, LA 70817
$-70
Cash flow
-1.5%
Cash-on-Cash Return
5.3%
Cap rate
0.6%
Rent to Value Ratio
Active
$539,500
3
bds
|
2
ba
|
2,130
sqft
|
built
2014
10726 Preservation Way, Baton Rouge, LA 70810
$-746
Cash flow
-7.2%
Cash-on-Cash Return
4.0%
Cap rate
0.5%
Rent to Value Ratio
Active
$24,995
3
bds
|
1
ba
|
949
sqft
|
built
1975
5262 E Brookstown Dr, Baton Rouge, LA 70805
$621
Cash flow
28.9%
Cash-on-Cash Return
29.8%
Cap rate
3.6%
Rent to Value Ratio
Active
$329,000
3
bds
|
3
ba
|
1,860
sqft
|
built
2020
2537 Jura St, Baton Rouge, LA 70806
$237
Cash flow
3.8%
Cash-on-Cash Return
6.5%
Cap rate
0.8%
Rent to Value Ratio