Baton Rouge, LA Investment Properties for Sale
Browse homes for sale and investment properties in Baton Rouge, LA. Refine your search by price, property type, or more.
Best cash flowing properties in Baton Rouge, LA

Active
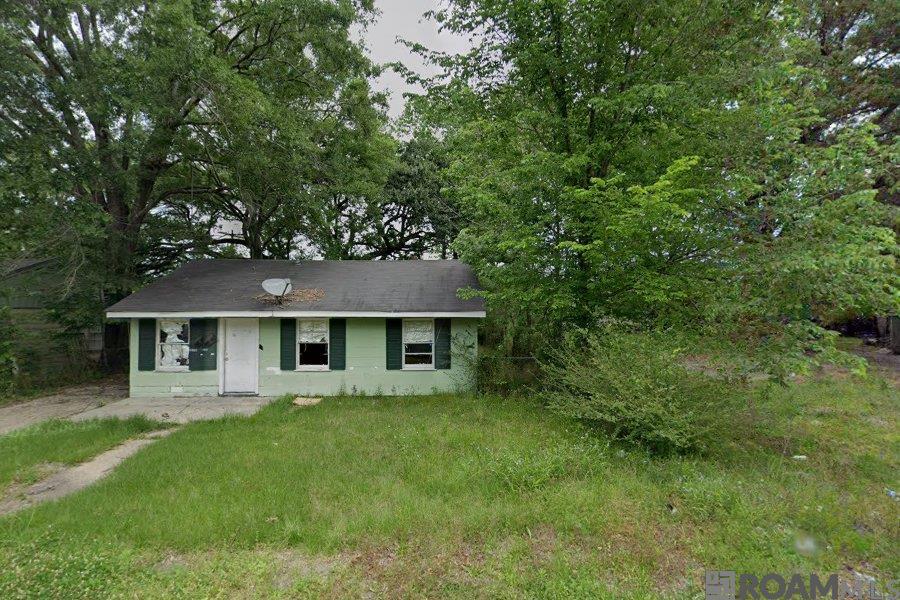
$48,500
3
bds
|
1
ba
|
1,600
sqft
|
built
1950
3655 Sherwood St, Baton Rouge, LA 70805
$897
Cash flow
21.5%
Cash-on-Cash Return
22.2%
Cap rate
2.7%
Rent to Value Ratio
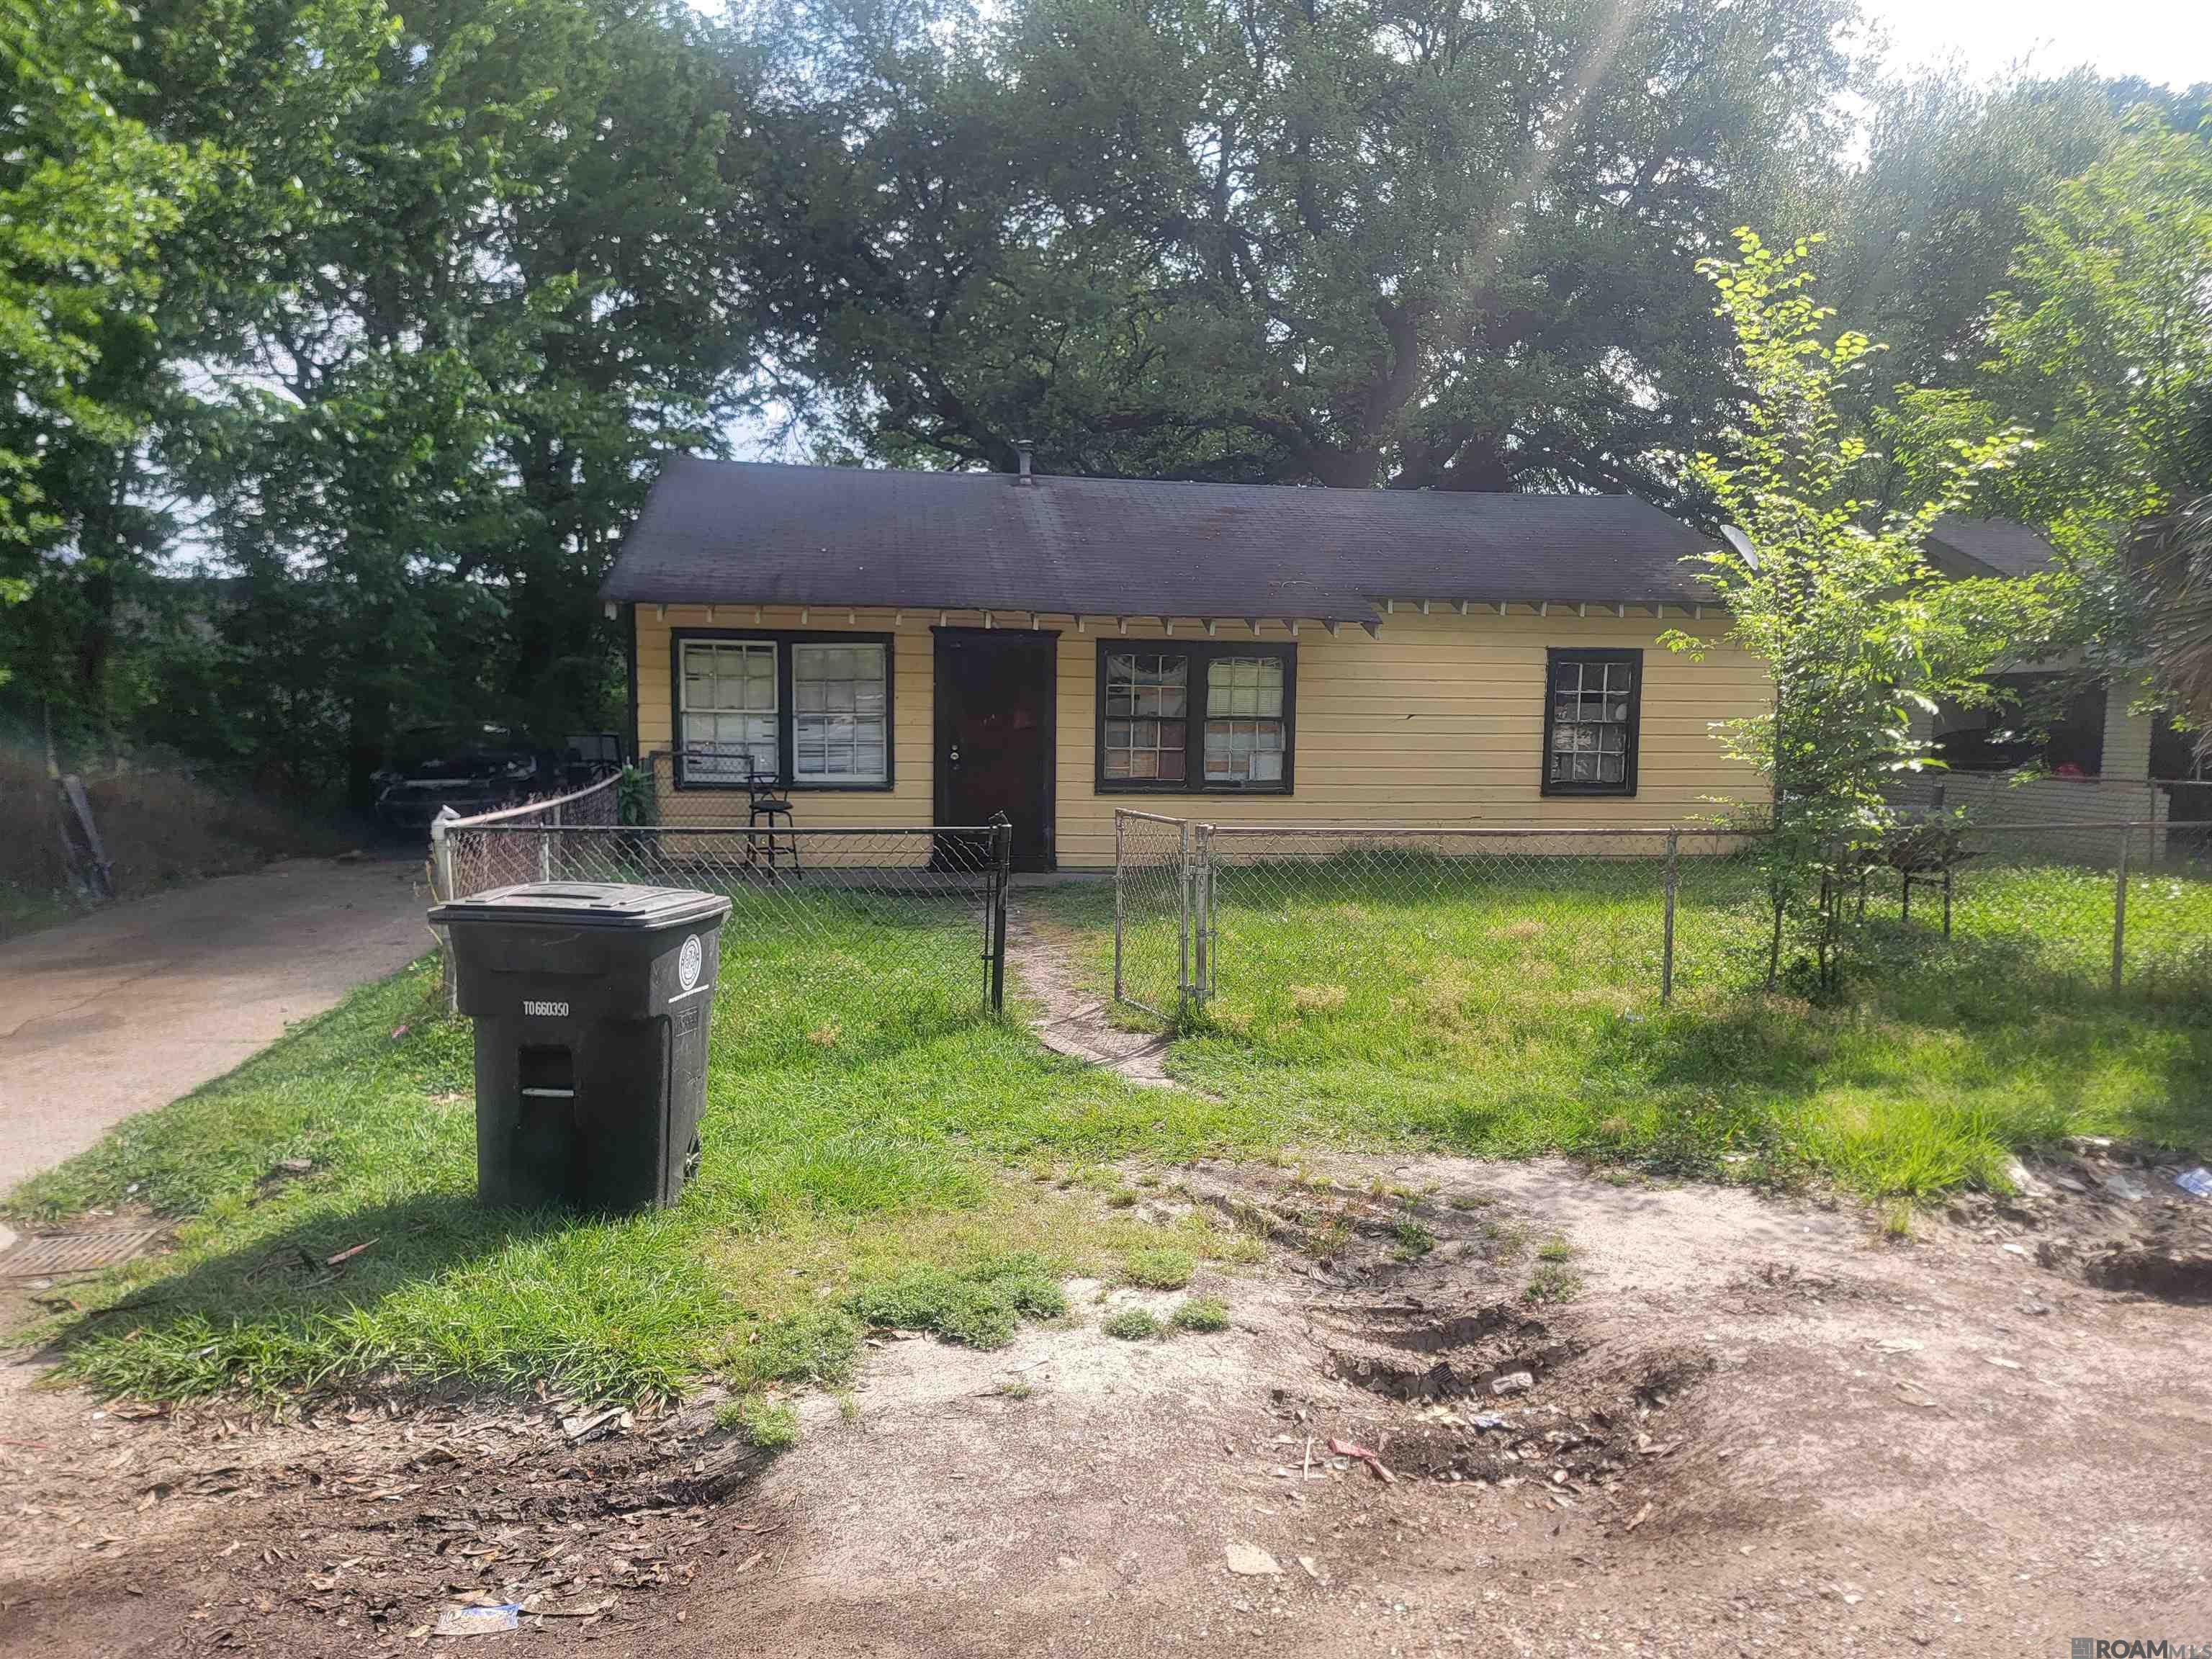
Active
$44,900
3
bds
|
2
ba
|
1,694
sqft
|
built
1974
823 S 12th St, Baton Rouge, LA 70802
$759
Cash flow
19.7%
Cash-on-Cash Return
20.3%
Cap rate
2.4%
Rent to Value Ratio
1,001 out of 1,290 properties for sale in Baton Rouge, LA
Limited Results Shown
Create a free account, or log in to reveal all property listings and enjoy the complete experience.

Active
$299,000
4
bds
|
3
ba
|
2,502
sqft
|
built
1976
16429 Antietam Ave, Baton Rouge, LA 70817
$-48
Cash flow
-0.8%
Cash-on-Cash Return
6.1%
Cap rate
0.7%
Rent to Value Ratio
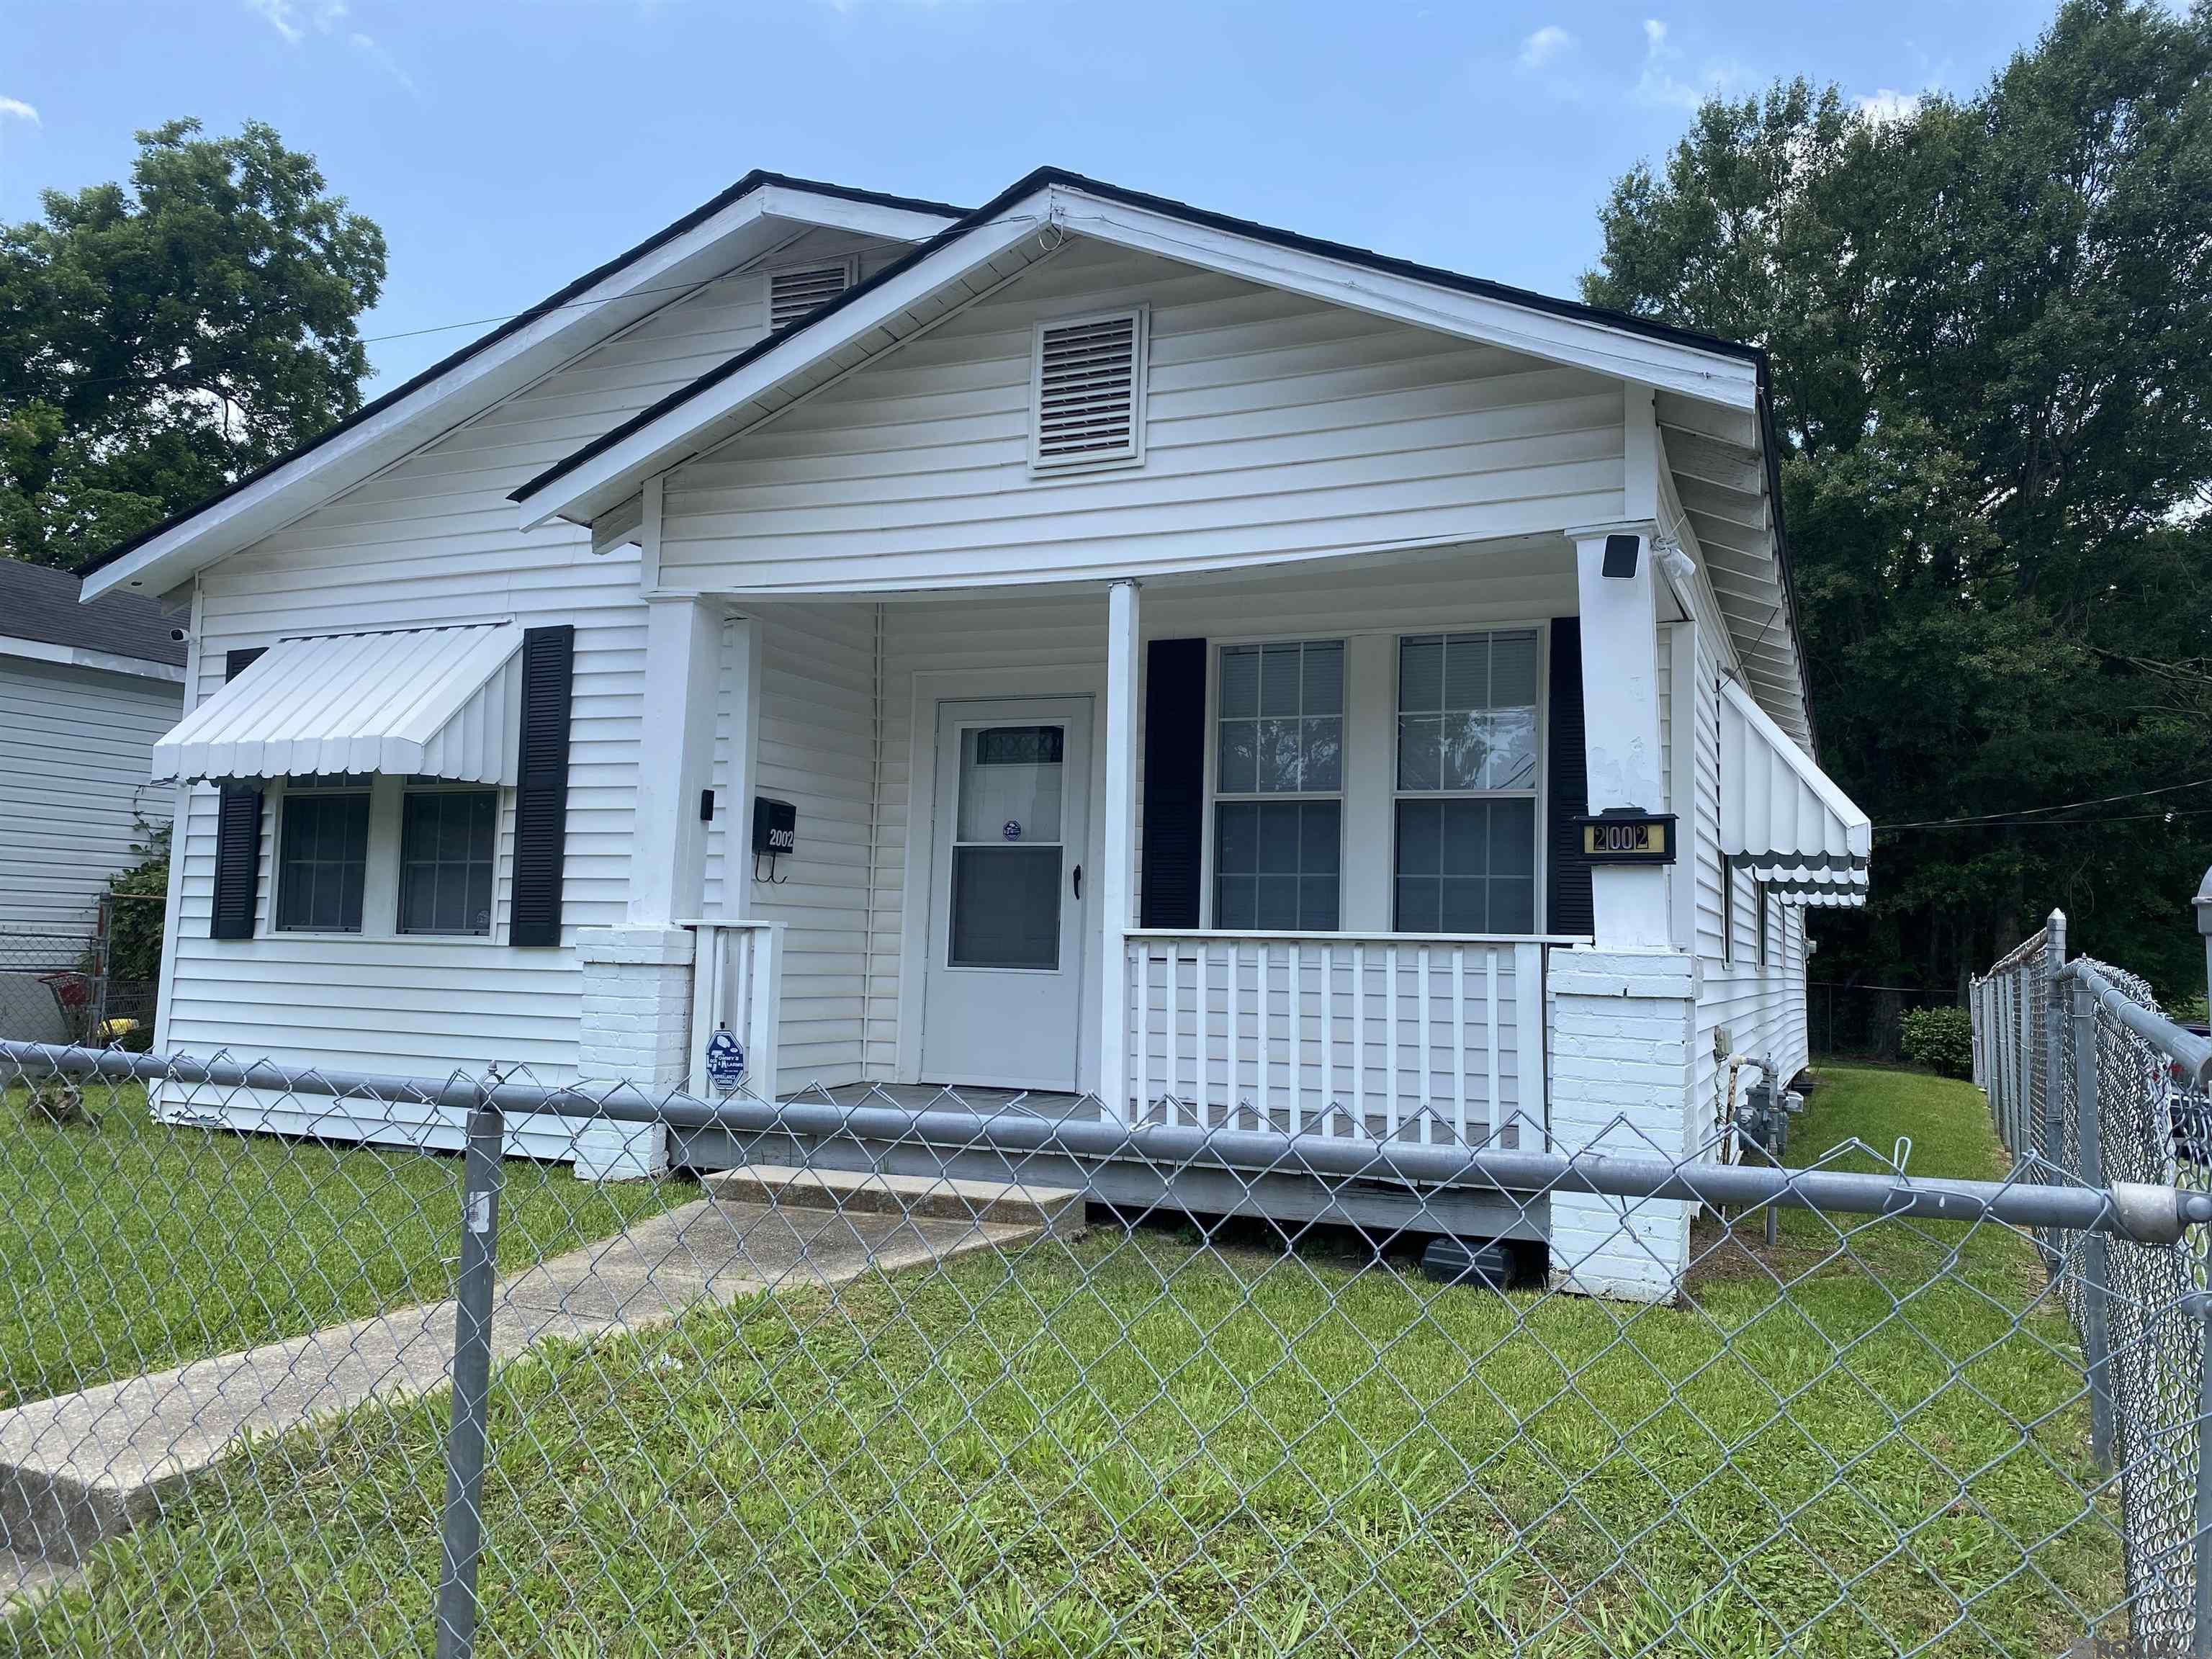
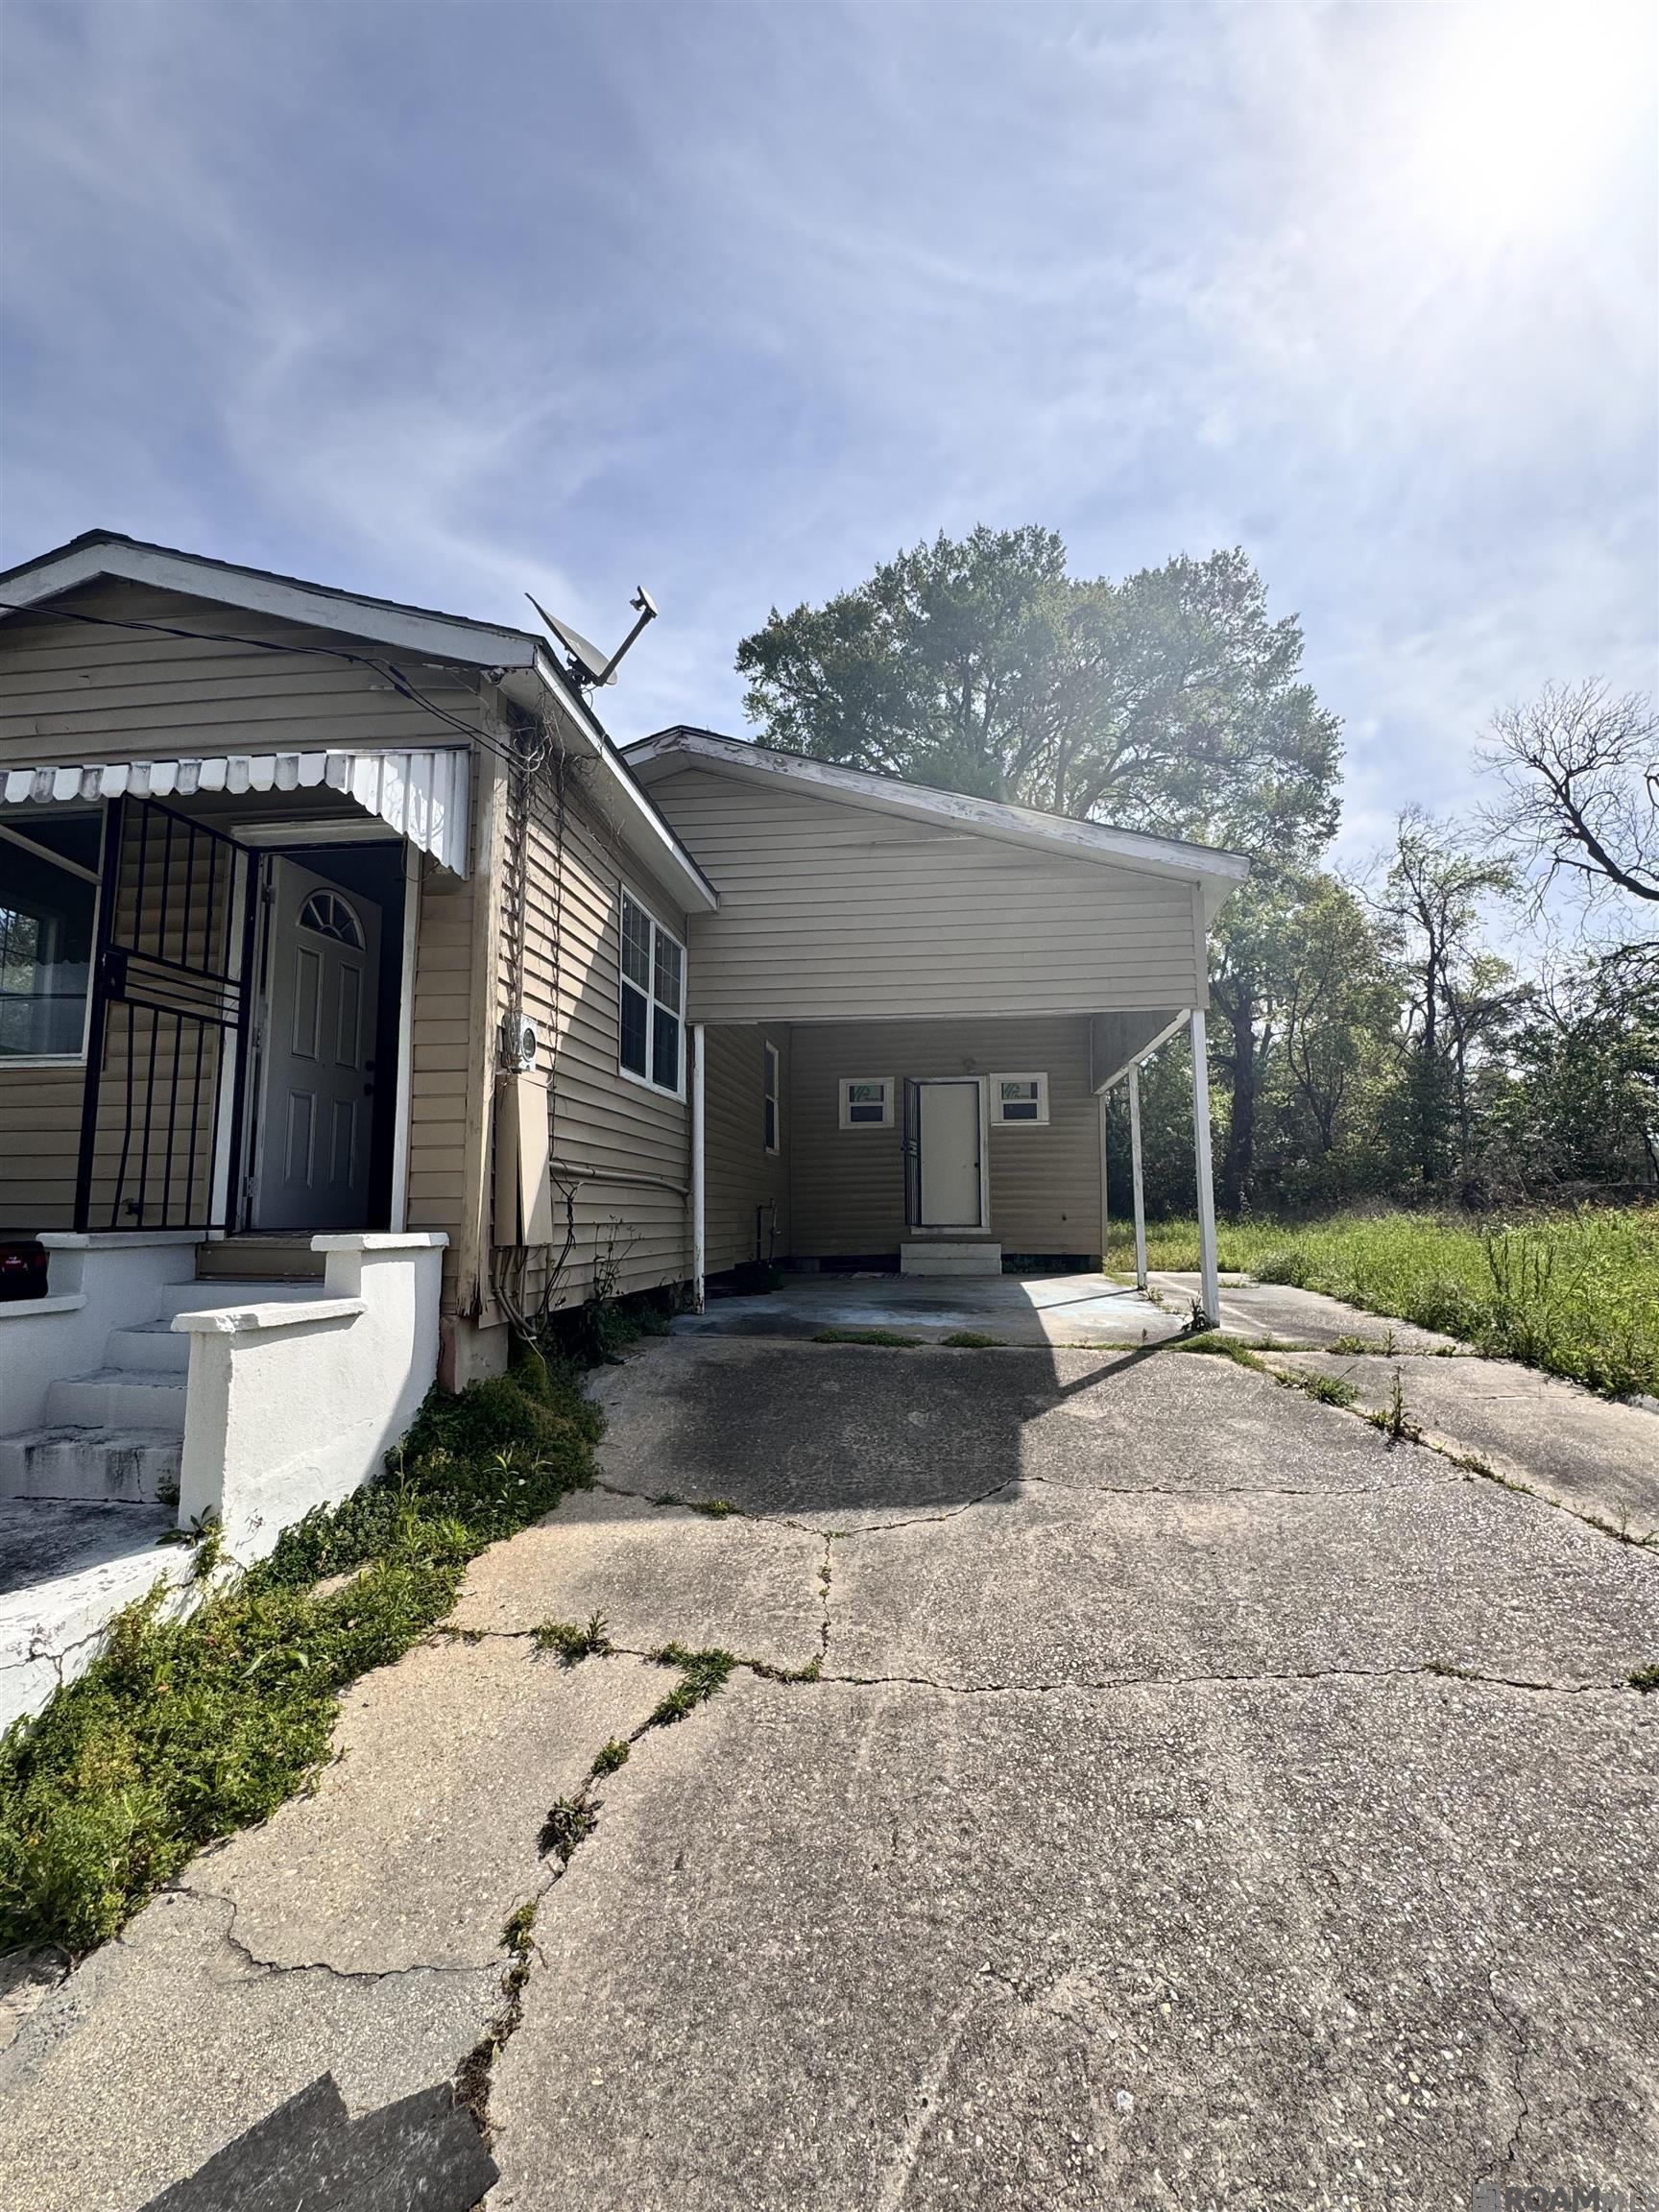
Active
$100,000
3
bds
|
1
ba
|
1,313
sqft
|
built
1955
2002 Thomas H Delpit Dr, Baton Rouge, LA 70802
$166
Cash flow
8.7%
Cash-on-Cash Return
8.3%
Cap rate
1.0%
Rent to Value Ratio
Active
$585,000
4
bds
|
3
ba
|
3,166
sqft
|
built
2012
5826 Nature Trail Dr, Baton Rouge, LA 70817
$-1,108
Cash flow
-9.9%
Cash-on-Cash Return
4.0%
Cap rate
0.5%
Rent to Value Ratio
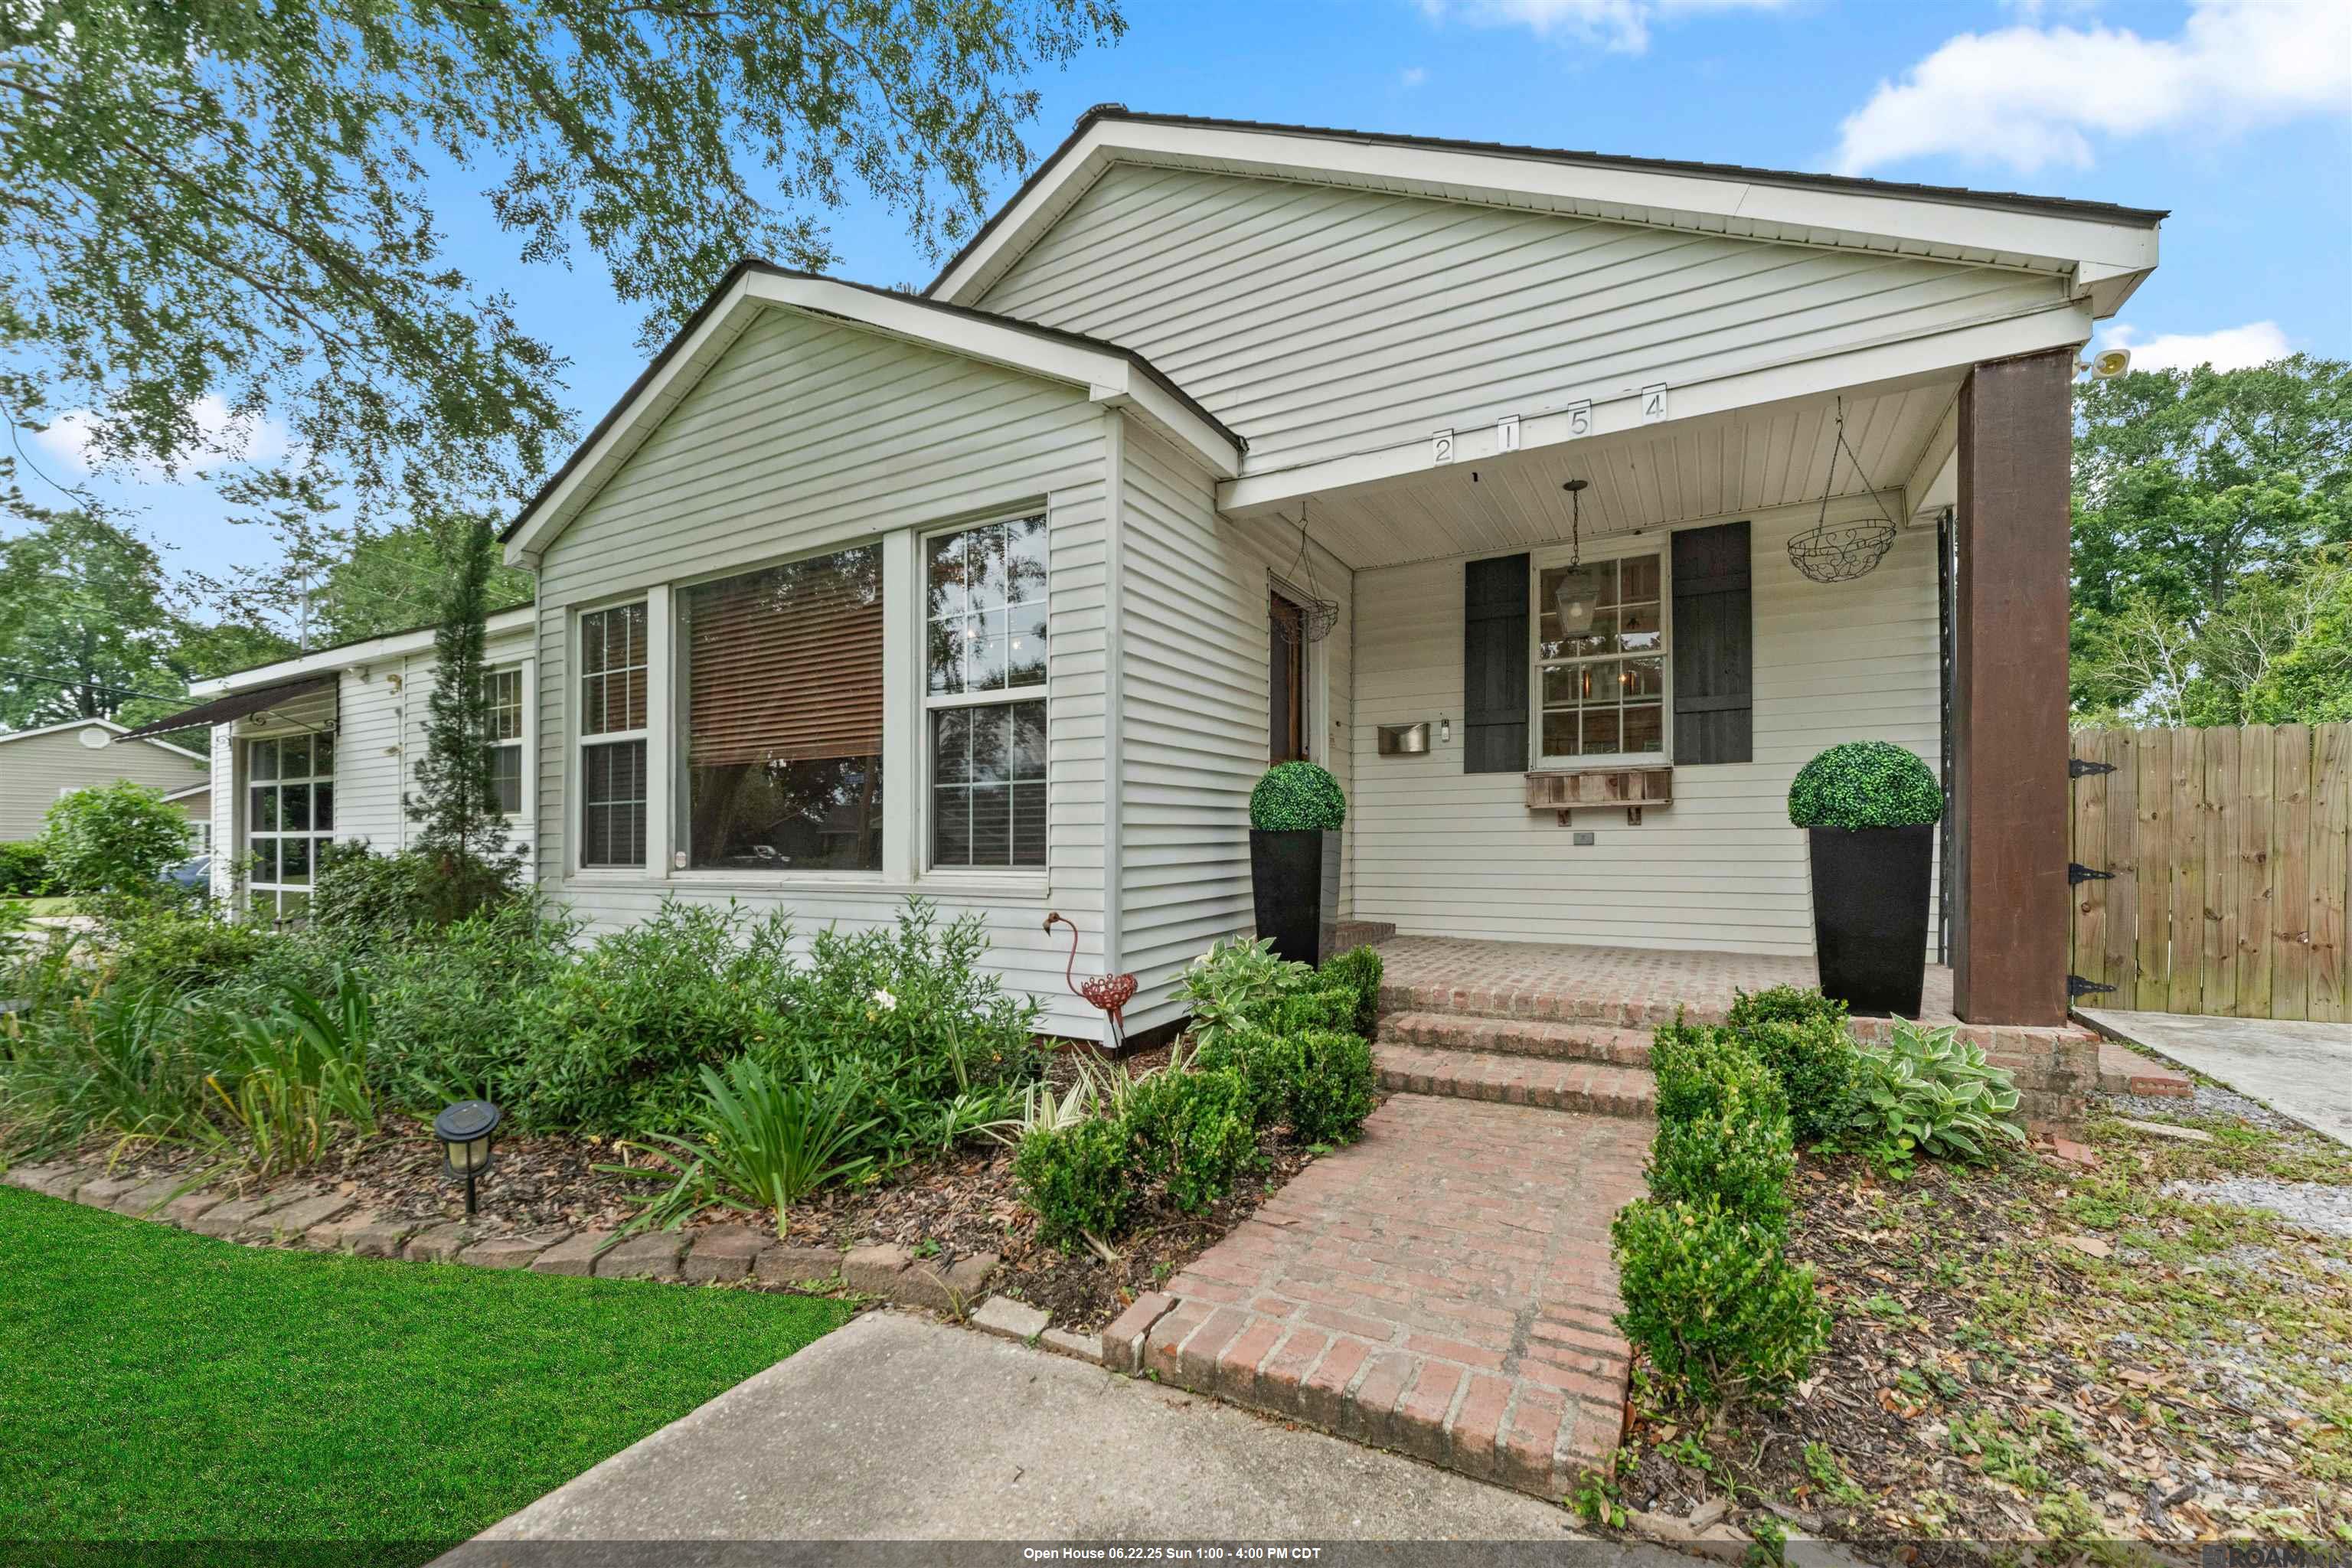
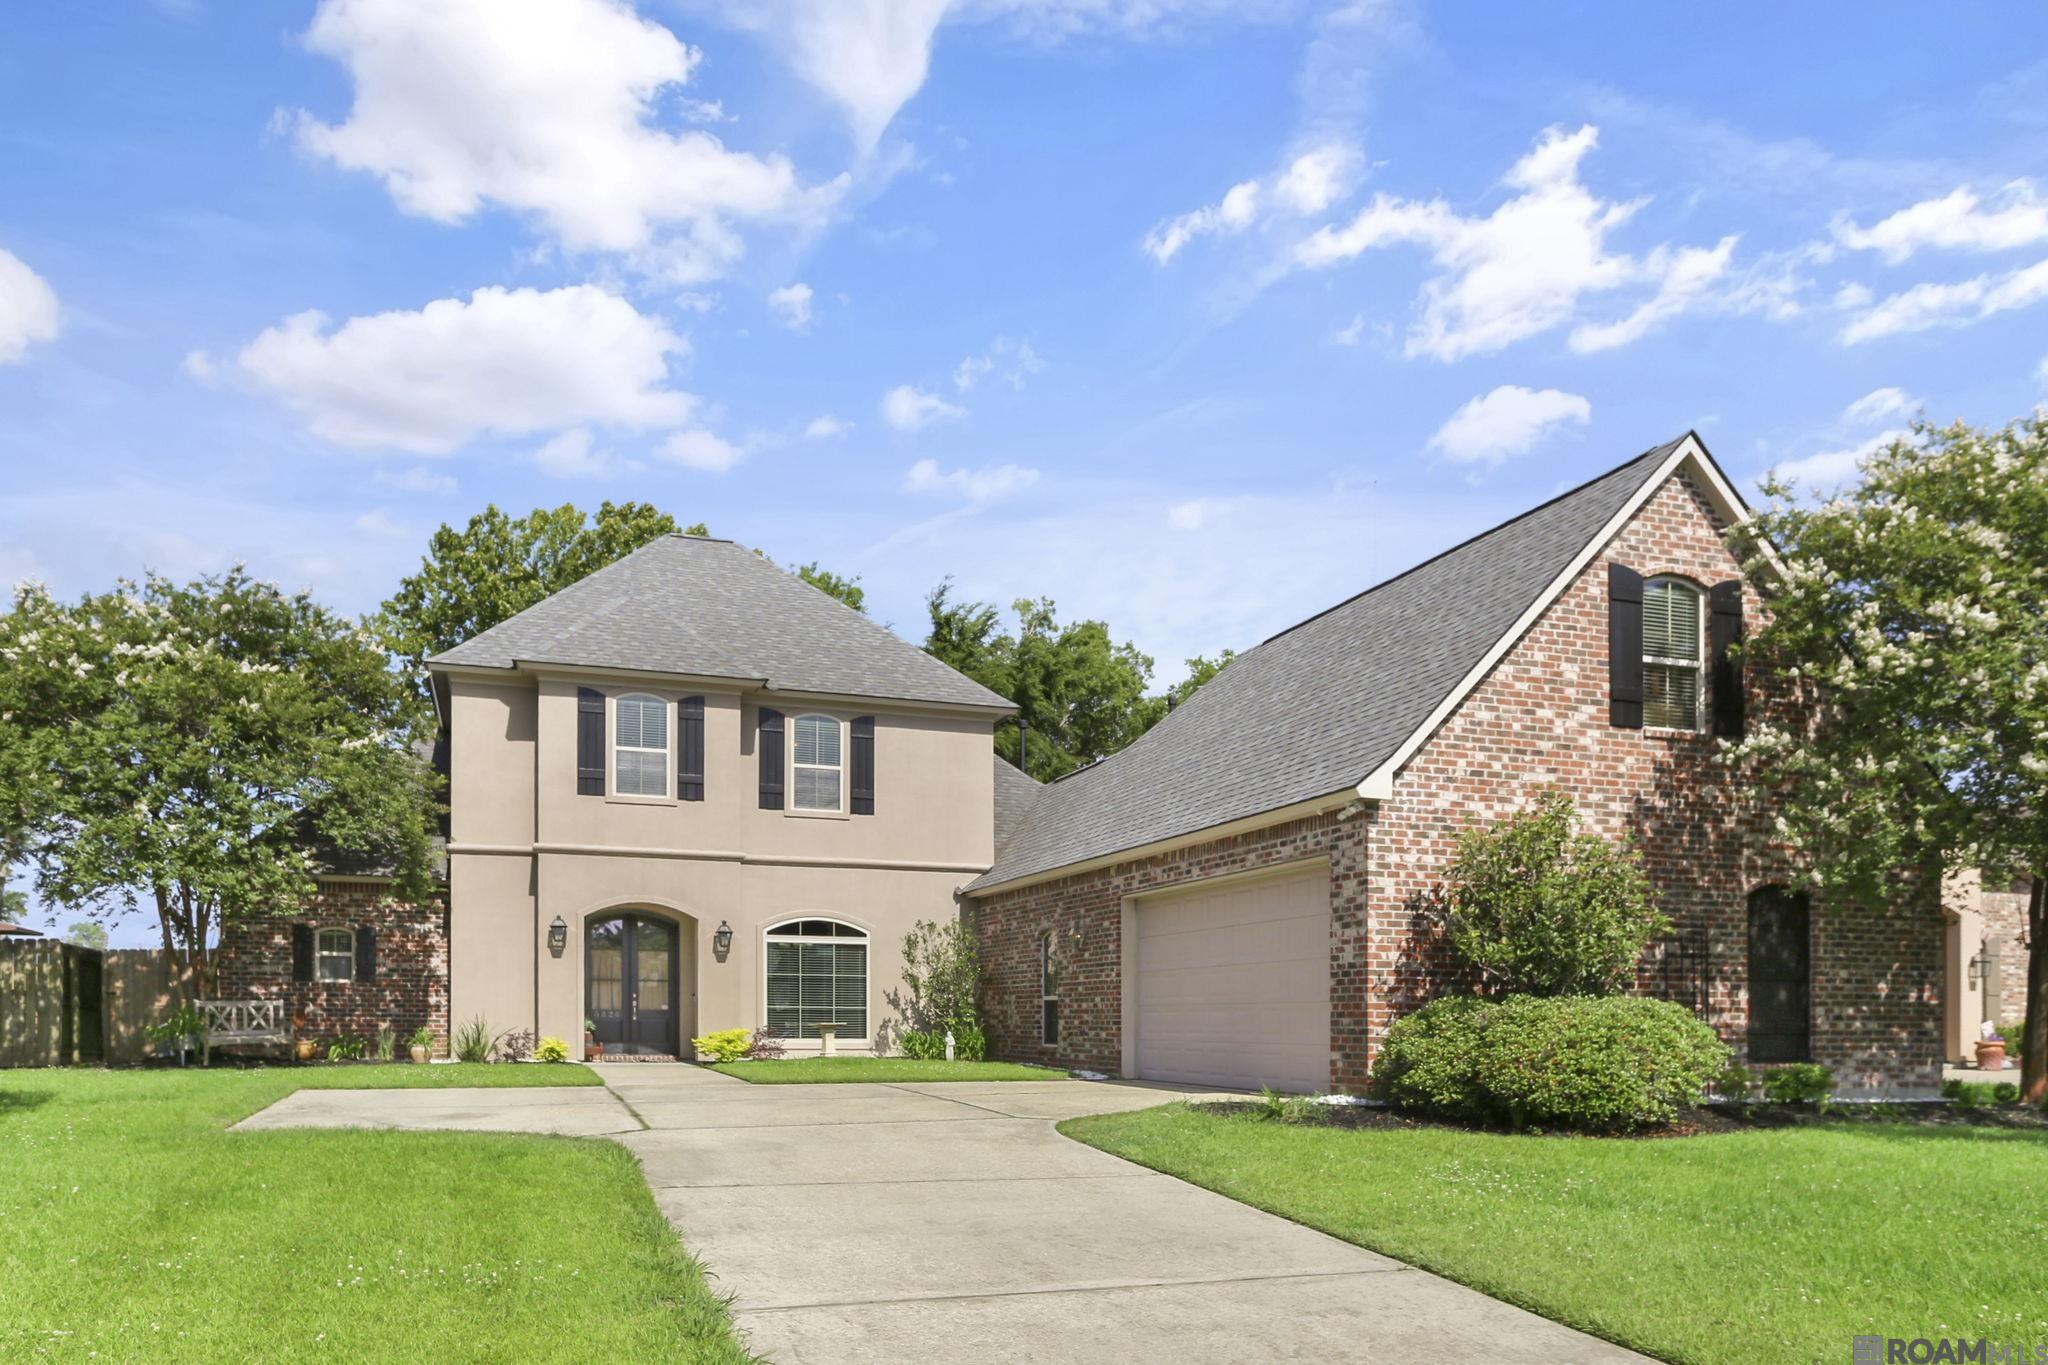
Active
$500,000
4
bds
|
3
ba
|
2,428
sqft
|
built
1954
2154 Edinburgh Ave, Baton Rouge, LA 70808
$-410
Cash flow
-4.3%
Cash-on-Cash Return
5.3%
Cap rate
0.6%
Rent to Value Ratio
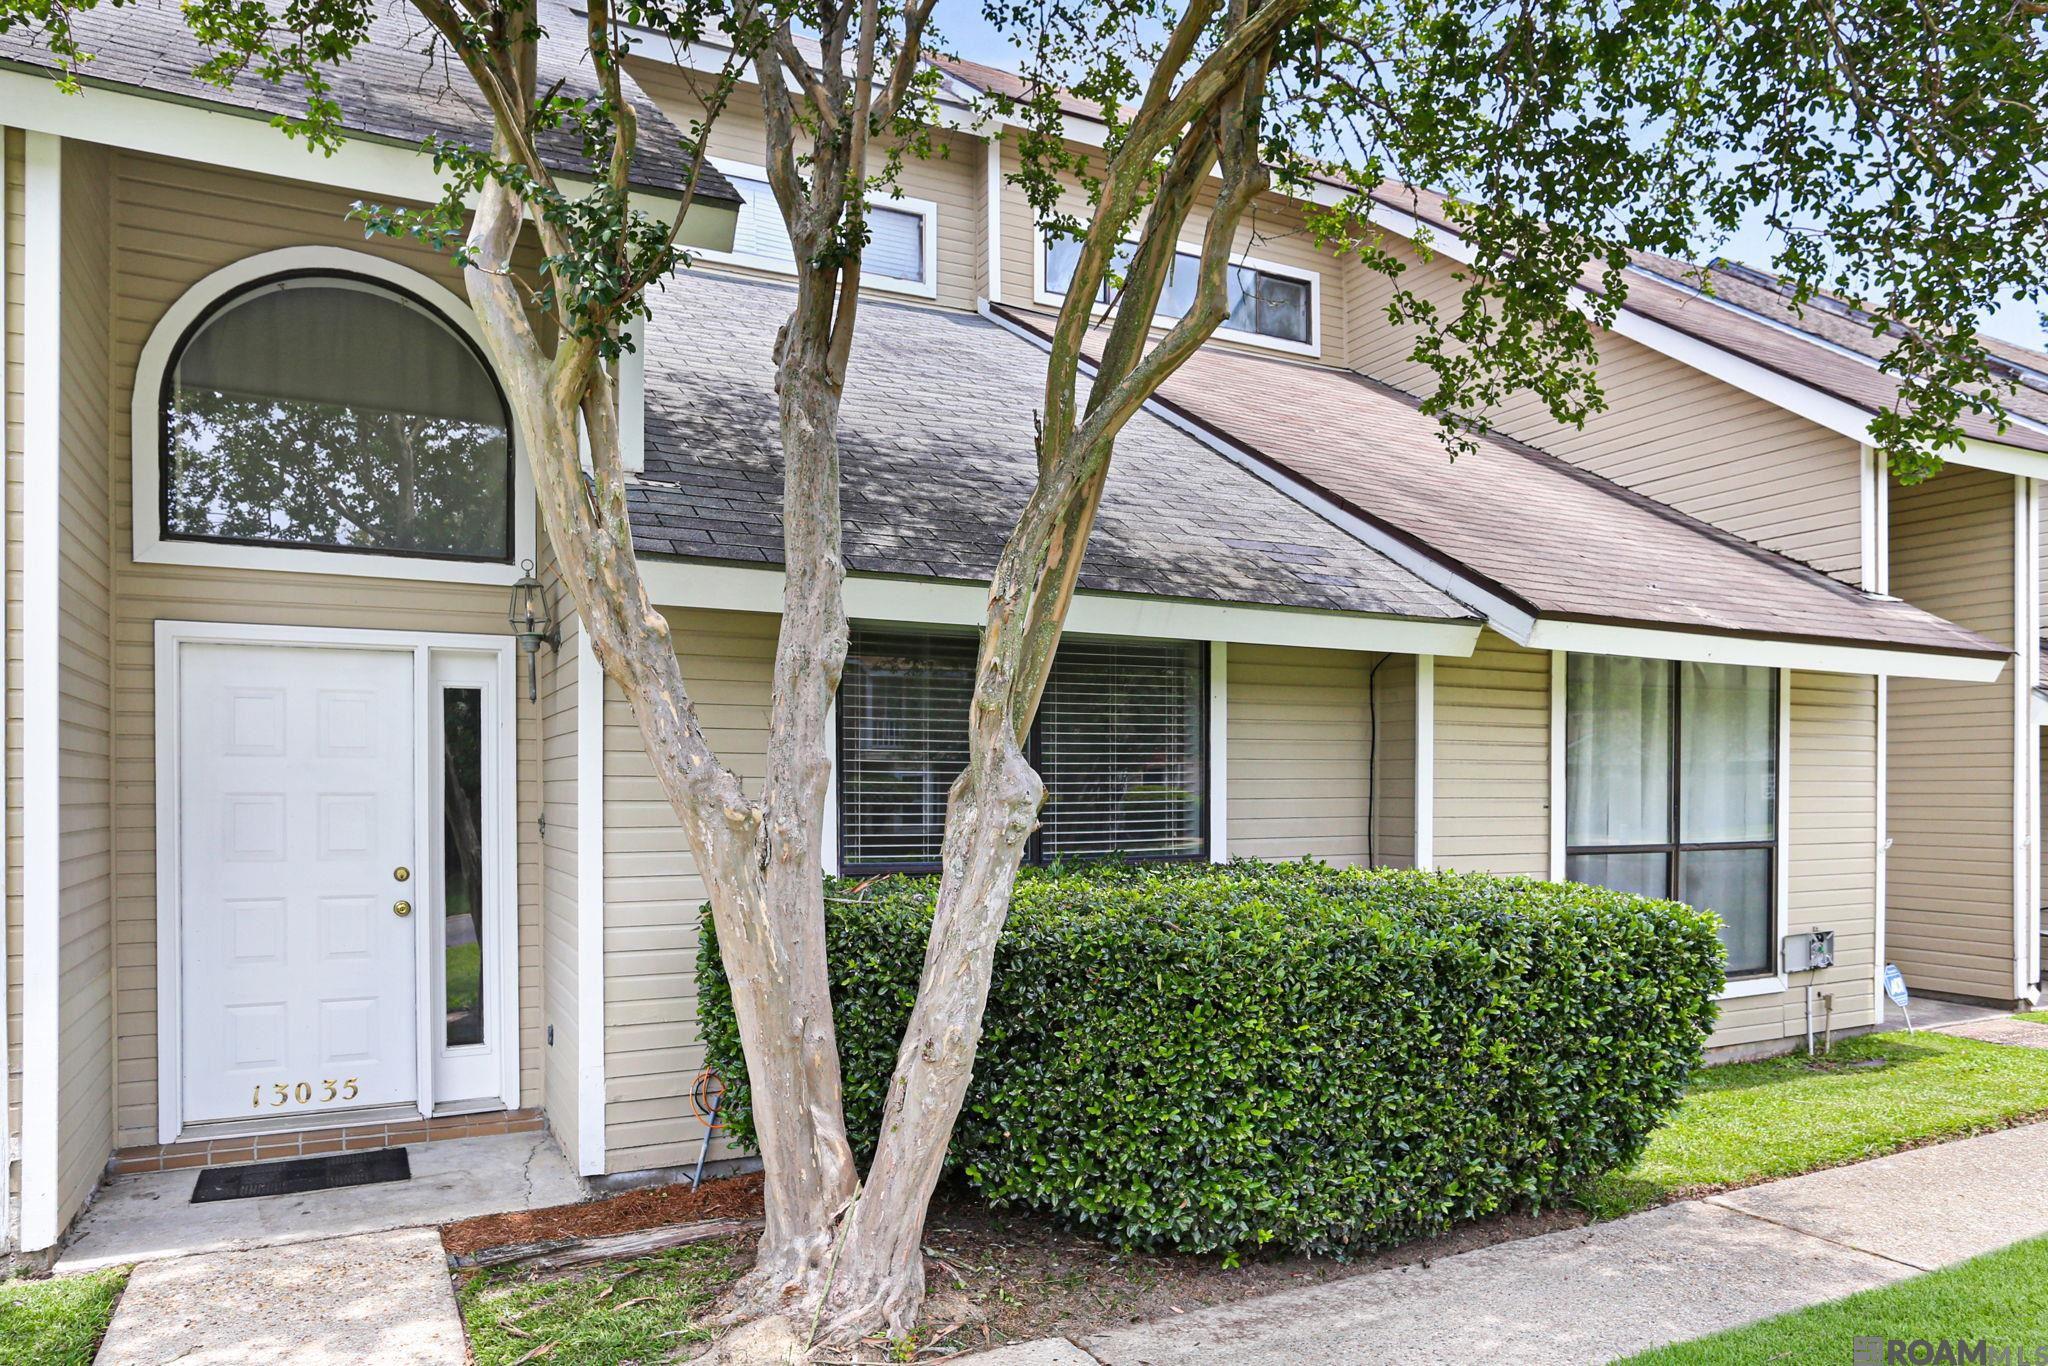
Active
$150,000
2
bds
|
2
ba
|
1,080
sqft
|
built
1983
13035 Briar Hollow Ave, Baton Rouge, LA 70810
$120
Cash flow
4.2%
Cash-on-Cash Return
7.2%
Cap rate
0.9%
Rent to Value Ratio
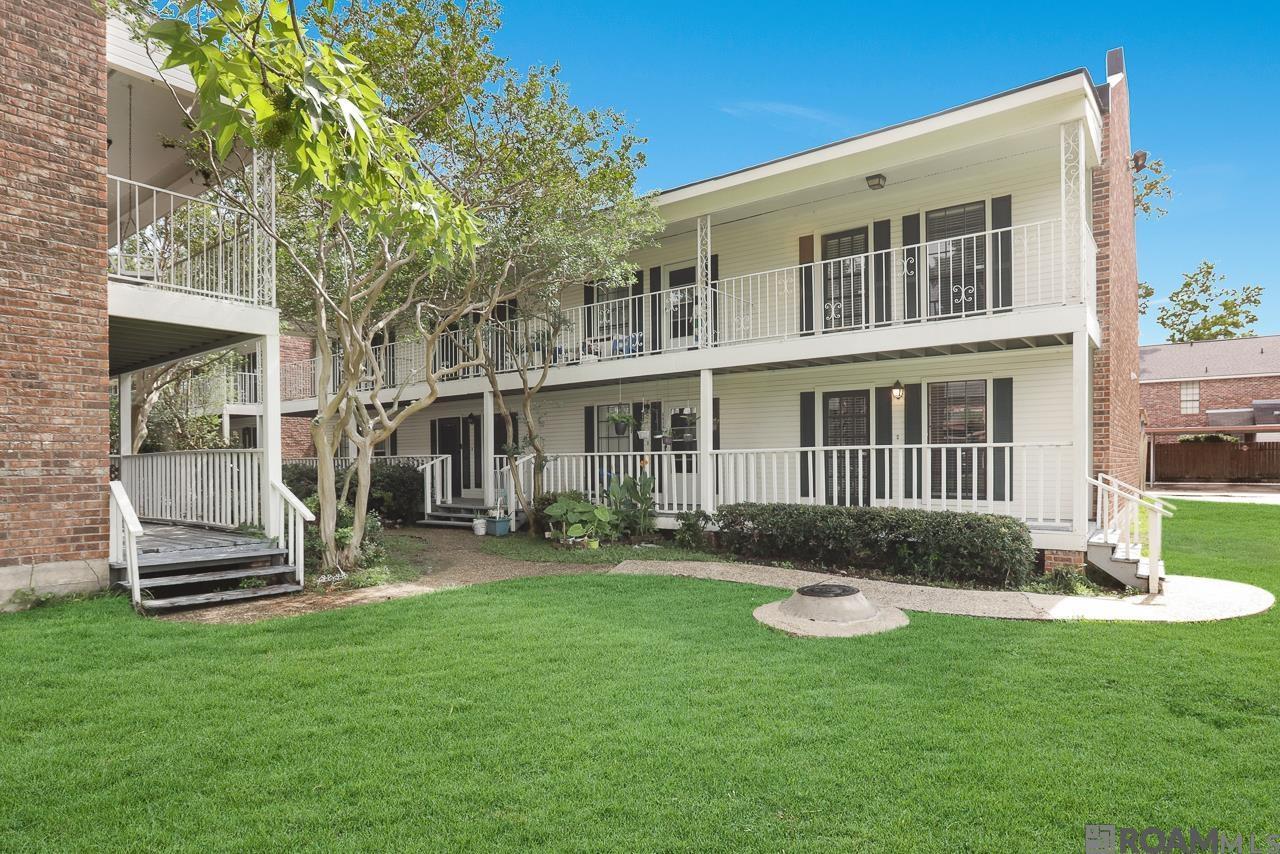
Active
$125,000
2
bds
|
3
ba
|
1,186
sqft
|
built
1984
4436 Stumberg Ln, Baton Rouge, LA 70816
$96
Cash flow
4.0%
Cash-on-Cash Return
7.2%
Cap rate
1.1%
Rent to Value Ratio
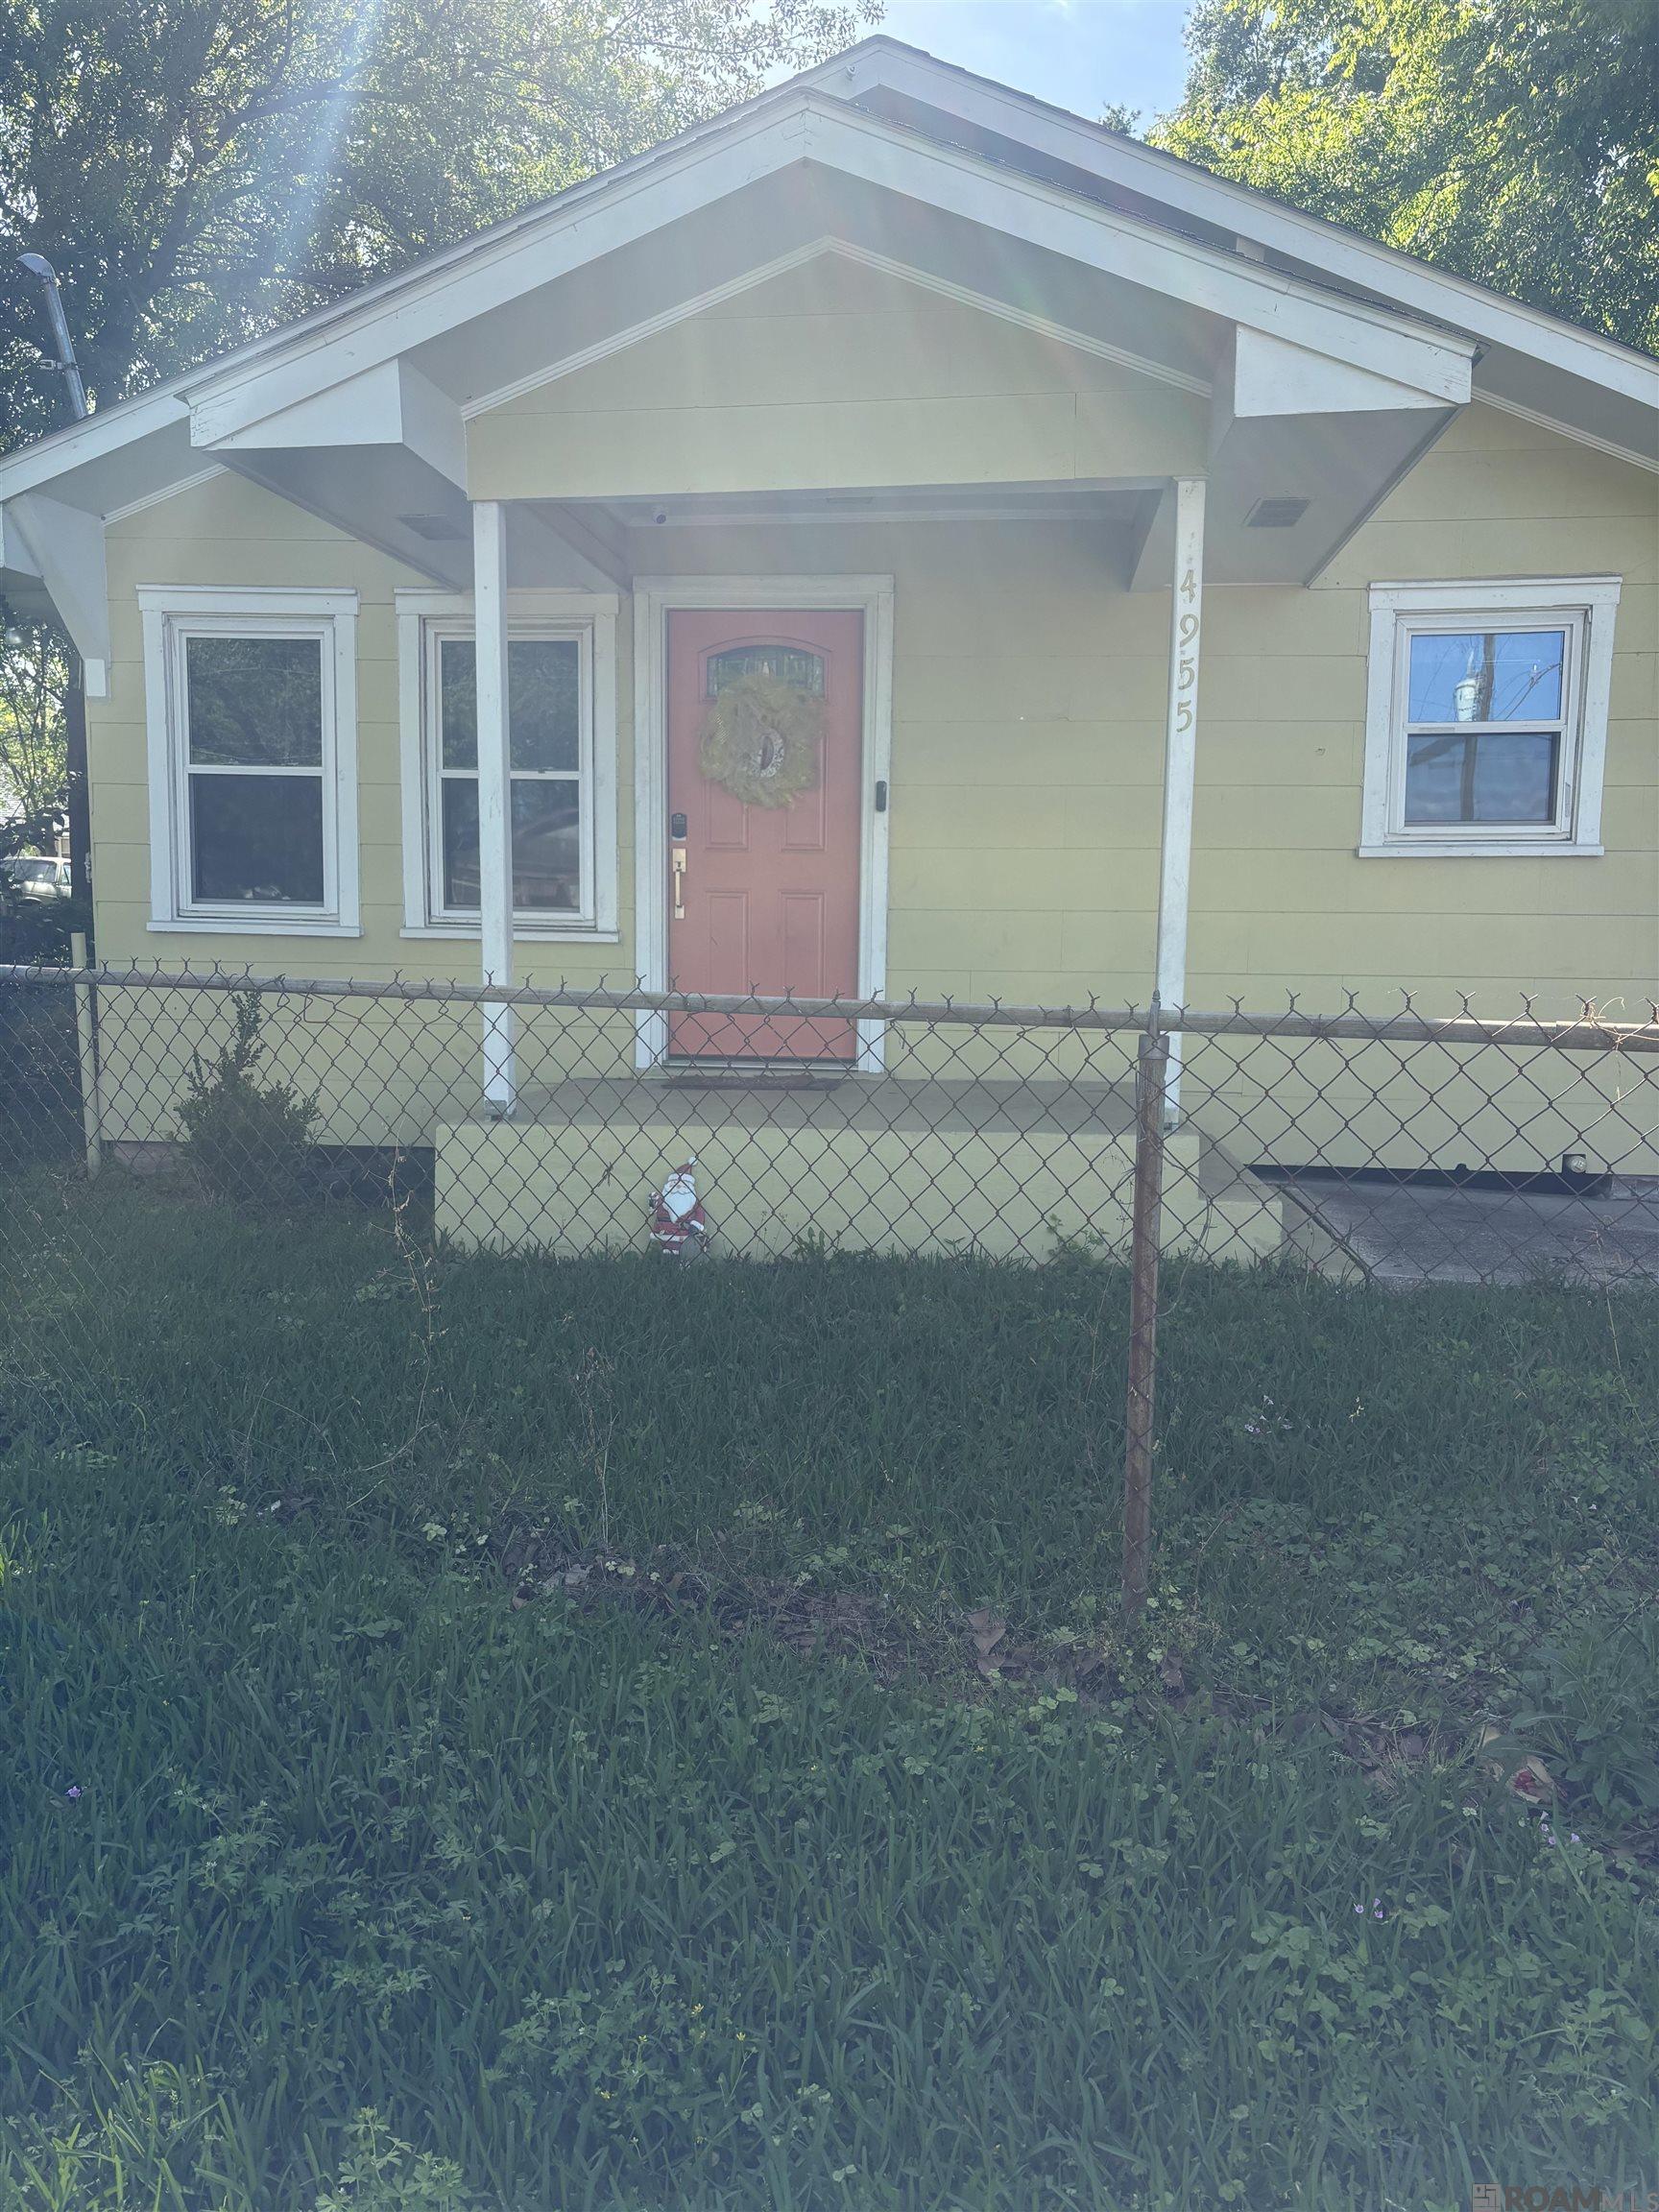
Active
$99,900
3
bds
|
2
ba
|
1,217
sqft
|
built
1955
4955 Longfellow Dr, Baton Rouge, LA 70805
$512
Cash flow
26.7%
Cash-on-Cash Return
12.4%
Cap rate
1.5%
Rent to Value Ratio

Active
$475,000
3
bds
|
3
ba
|
2,440
sqft
|
built
2012
2437 Fiero St, Baton Rouge, LA 70808
$-279
Cash flow
-3.1%
Cash-on-Cash Return
5.6%
Cap rate
0.7%
Rent to Value Ratio

Active
$659,900
6
bds
|
5
ba
|
3,539
sqft
|
built
1994
10813 N Oak Hills Pkwy, Baton Rouge, LA 70810
$-786
Cash flow
-6.2%
Cash-on-Cash Return
4.9%
Cap rate
0.6%
Rent to Value Ratio
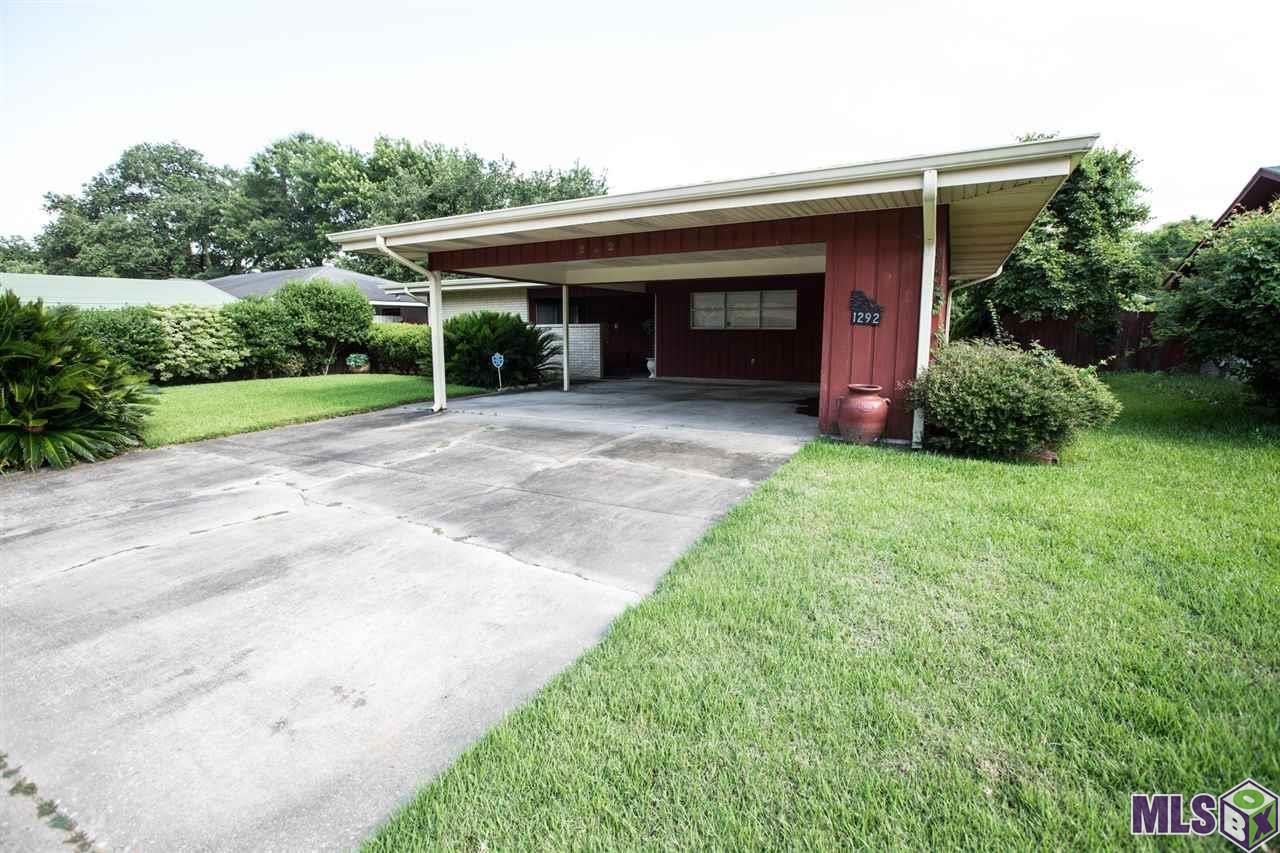
Active
$149,900
3
bds
|
3
ba
|
2,189
sqft
|
built
1978
1292 Balsam Ave, Baton Rouge, LA 70807
$457
Cash flow
15.9%
Cash-on-Cash Return
9.9%
Cap rate
1.2%
Rent to Value Ratio
Active
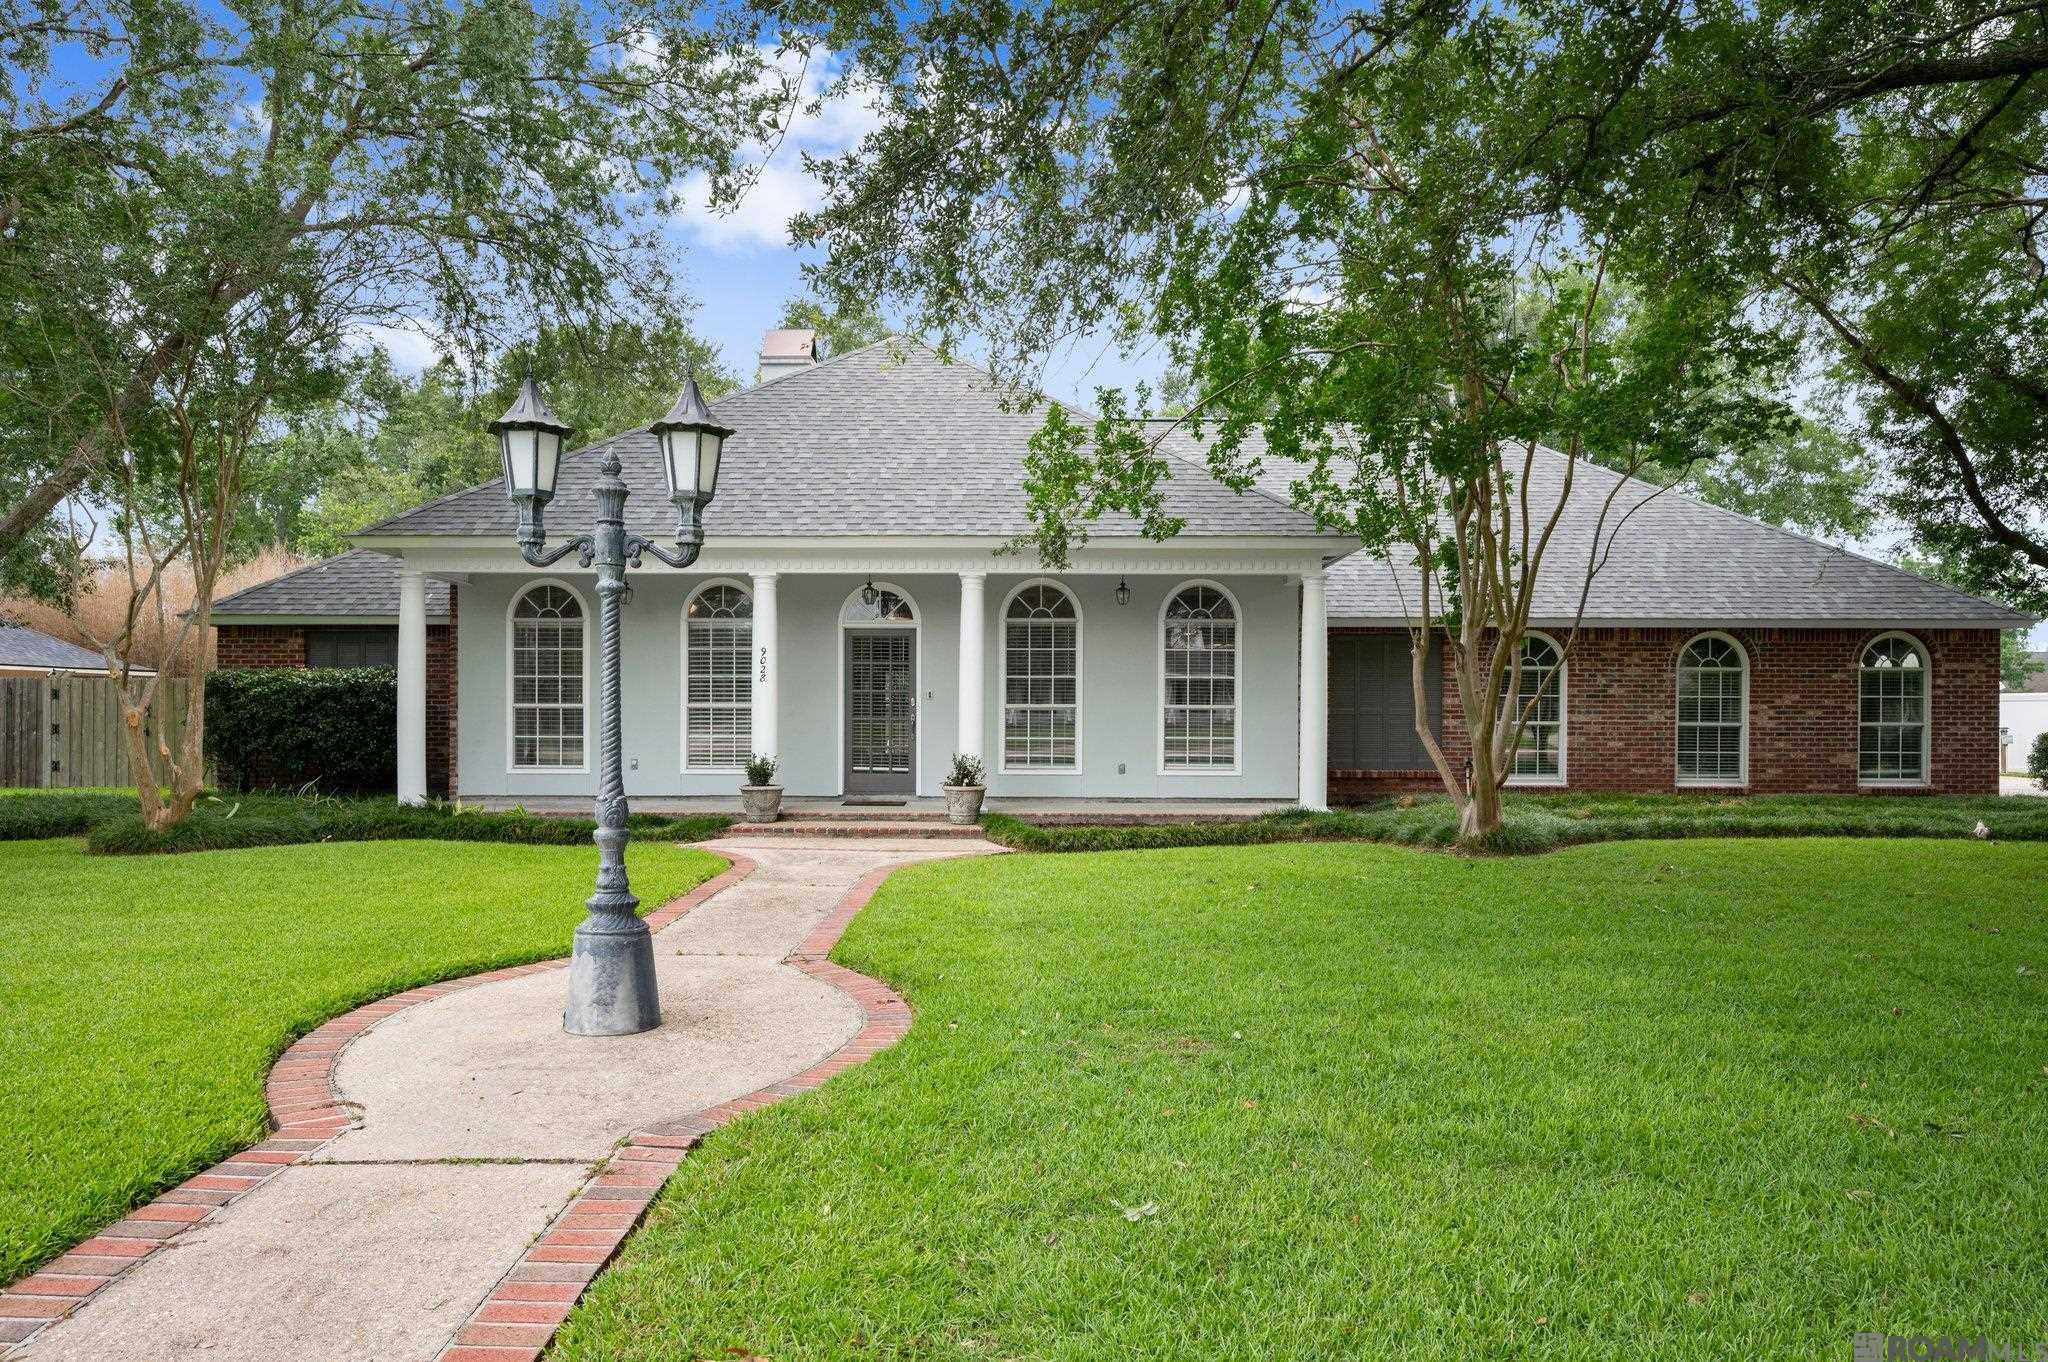
$482,000
4
bds
|
3
ba
|
2,795
sqft
|
built
1990
9028 Round Oak Dr, Baton Rouge, LA 70817
$-385
Cash flow
-4.2%
Cash-on-Cash Return
5.3%
Cap rate
0.6%
Rent to Value Ratio
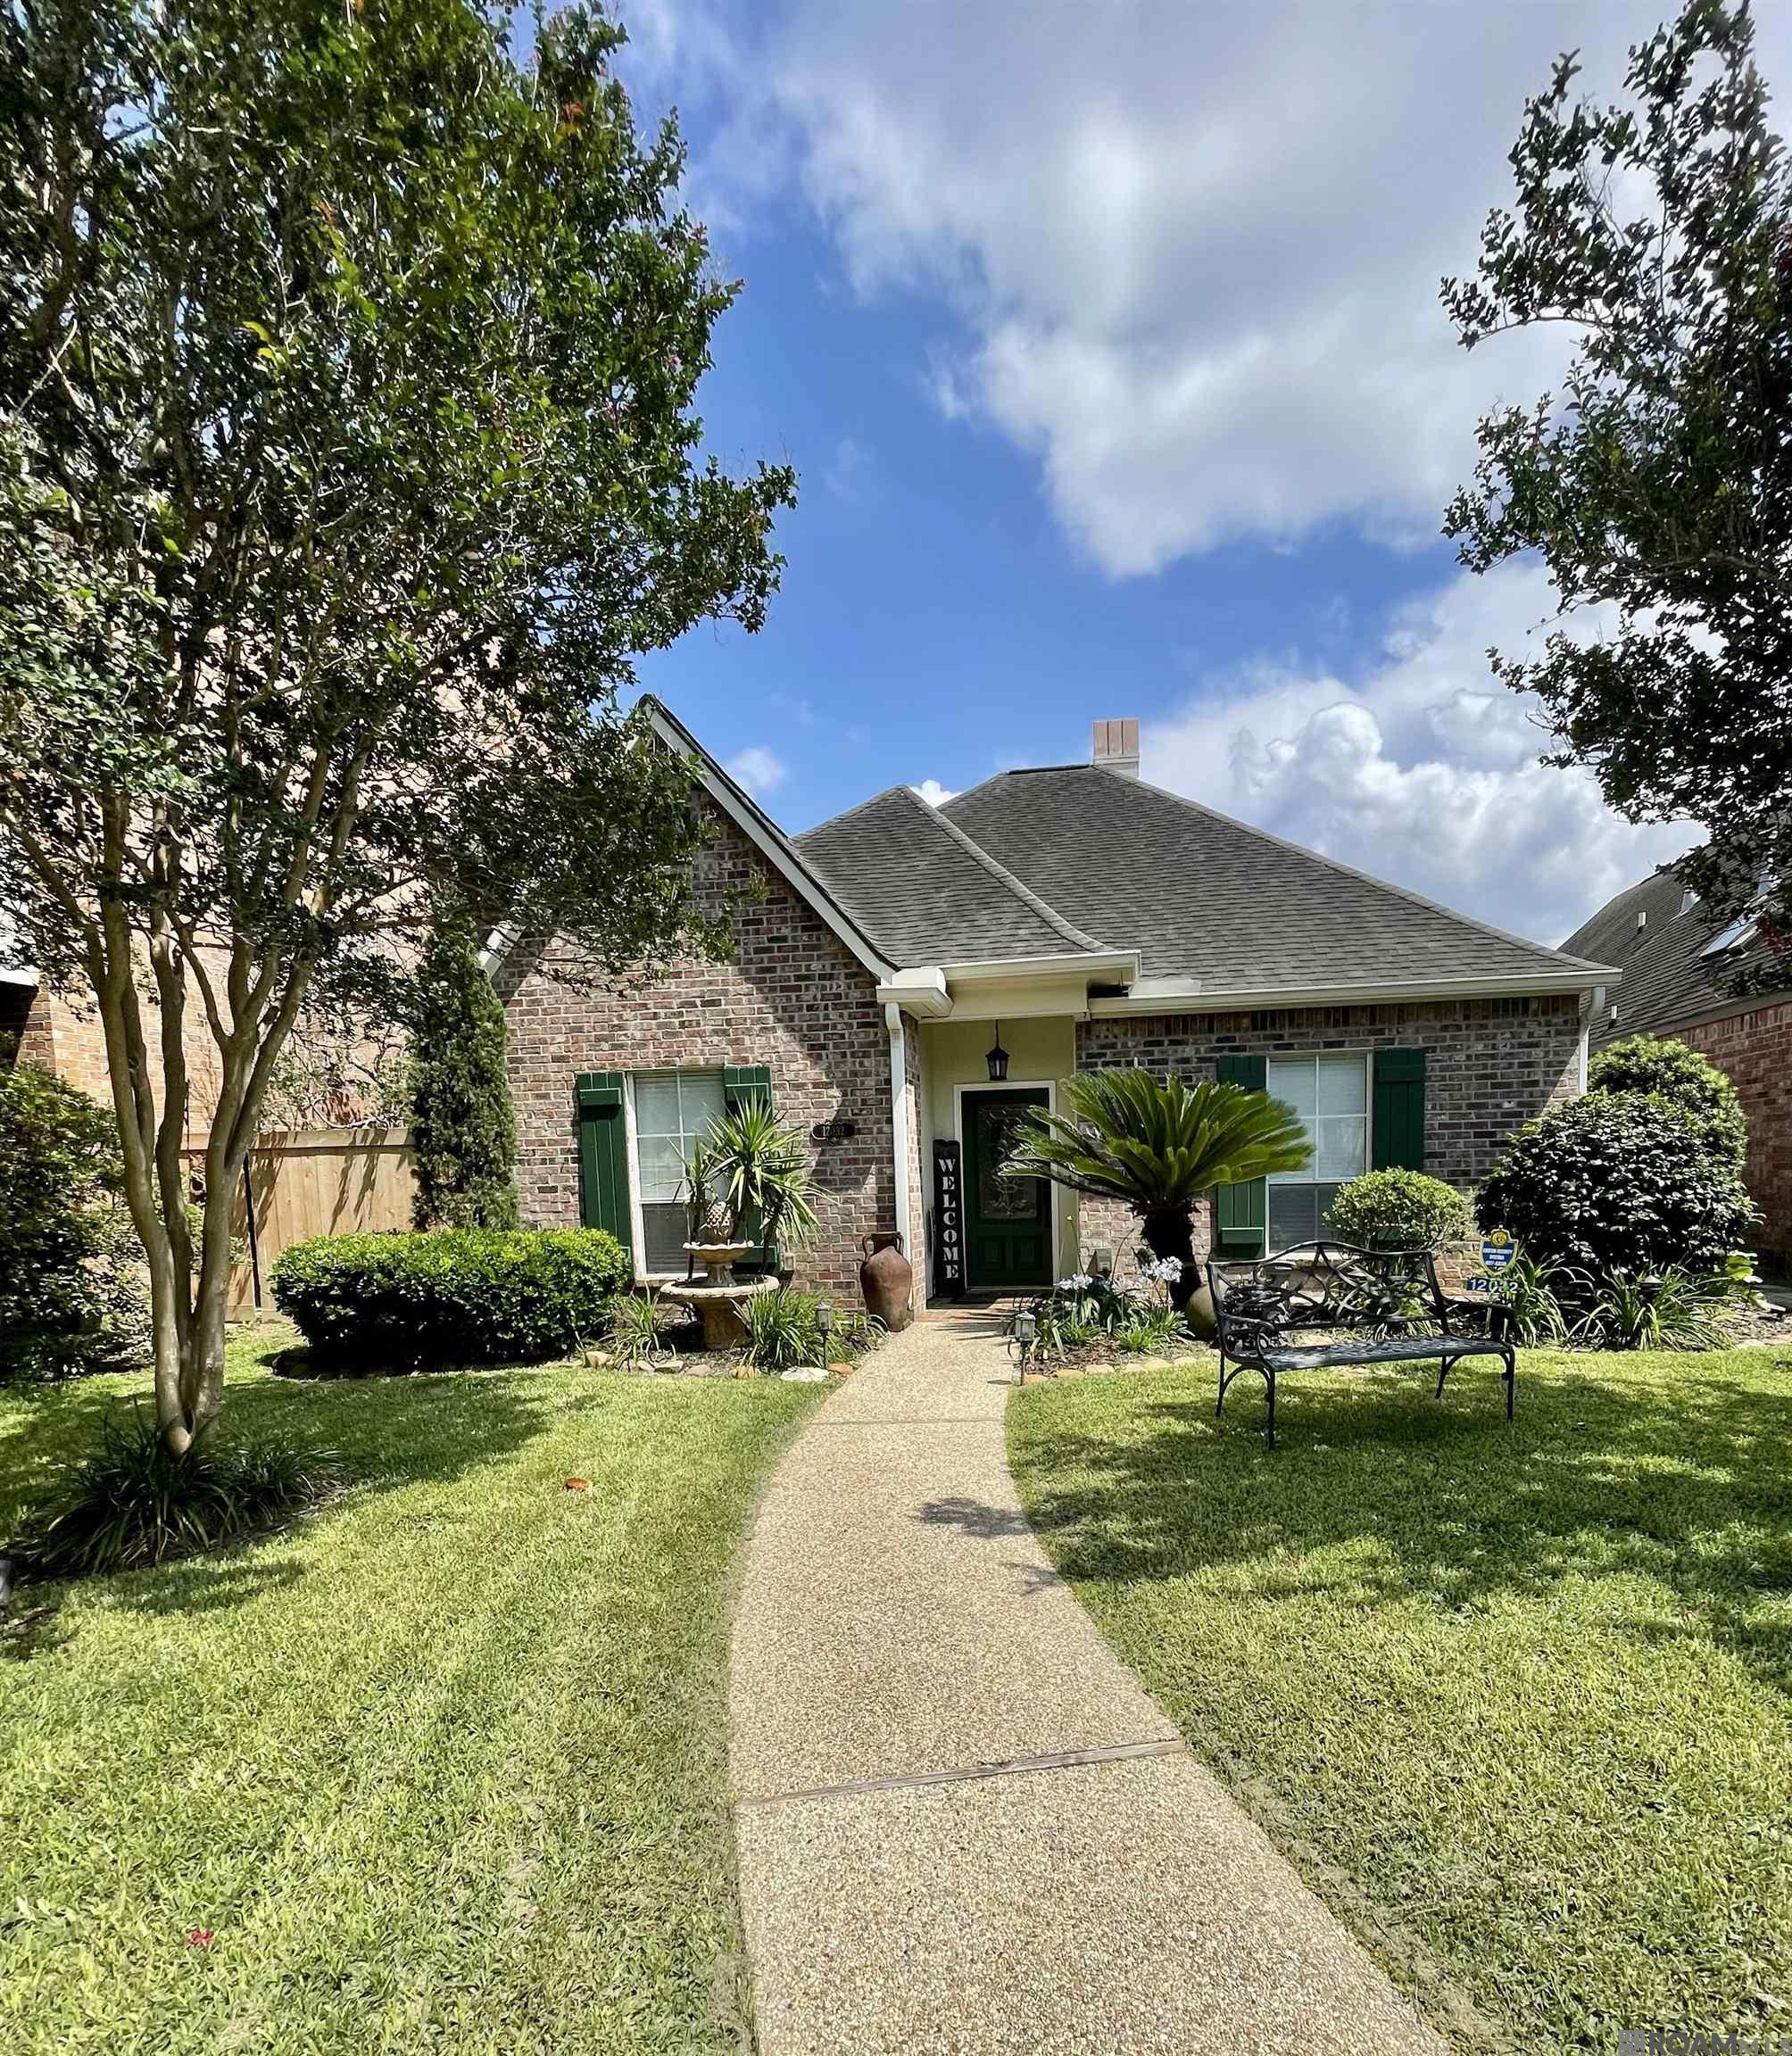
Active
$289,900
3
bds
|
2
ba
|
1,844
sqft
|
built
1999
12032 Beauverde Ct, Baton Rouge, LA 70815
$-159
Cash flow
-2.9%
Cash-on-Cash Return
5.6%
Cap rate
0.7%
Rent to Value Ratio
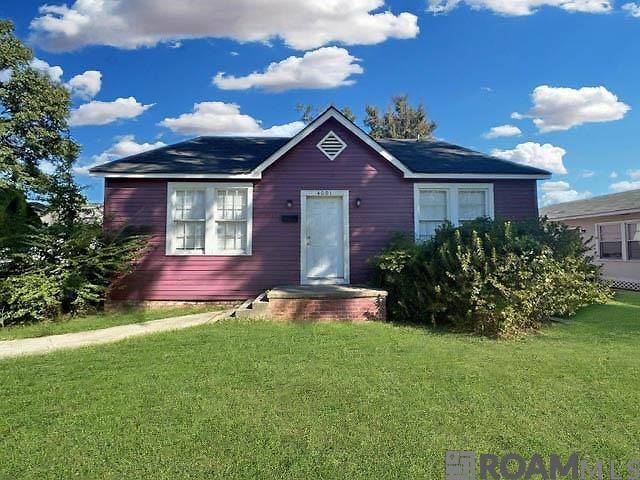
Active
$180,000
3
bds
|
2
ba
|
1,768
sqft
|
built
1948
4091 Convention St, Baton Rouge, LA 70806
$161
Cash flow
4.7%
Cash-on-Cash Return
7.4%
Cap rate
0.9%
Rent to Value Ratio
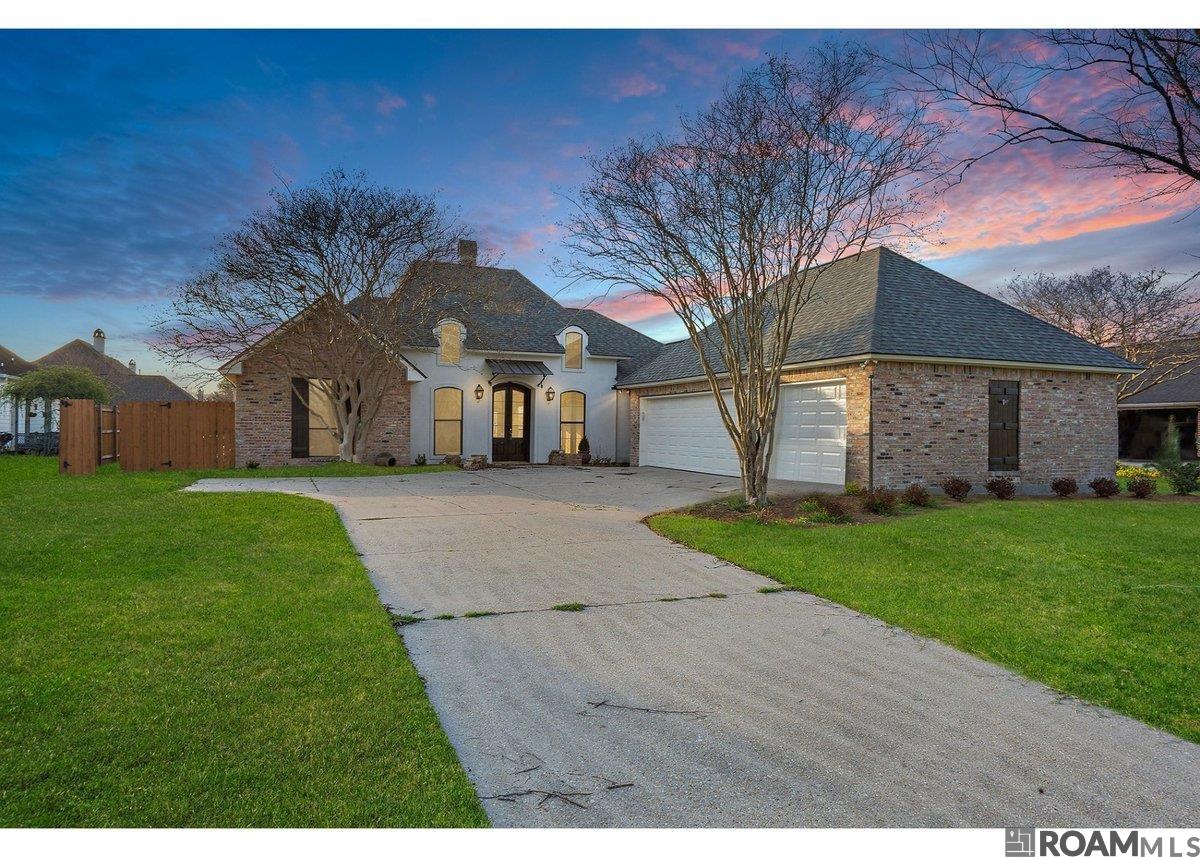
Active
$369,000
3
bds
|
2
ba
|
1,960
sqft
|
built
2001
9832 S Vignes Rd, Baton Rouge, LA 70817
$-345
Cash flow
-4.9%
Cash-on-Cash Return
5.2%
Cap rate
0.6%
Rent to Value Ratio
Active
$318,000
bds
|
0
ba
|
3,462
sqft
|
built
1983
3218 Toulon Dr, Baton Rouge, LA 70816
$-147
Cash flow
-2.4%
Cash-on-Cash Return
5.7%
Cap rate
0.7%
Rent to Value Ratio
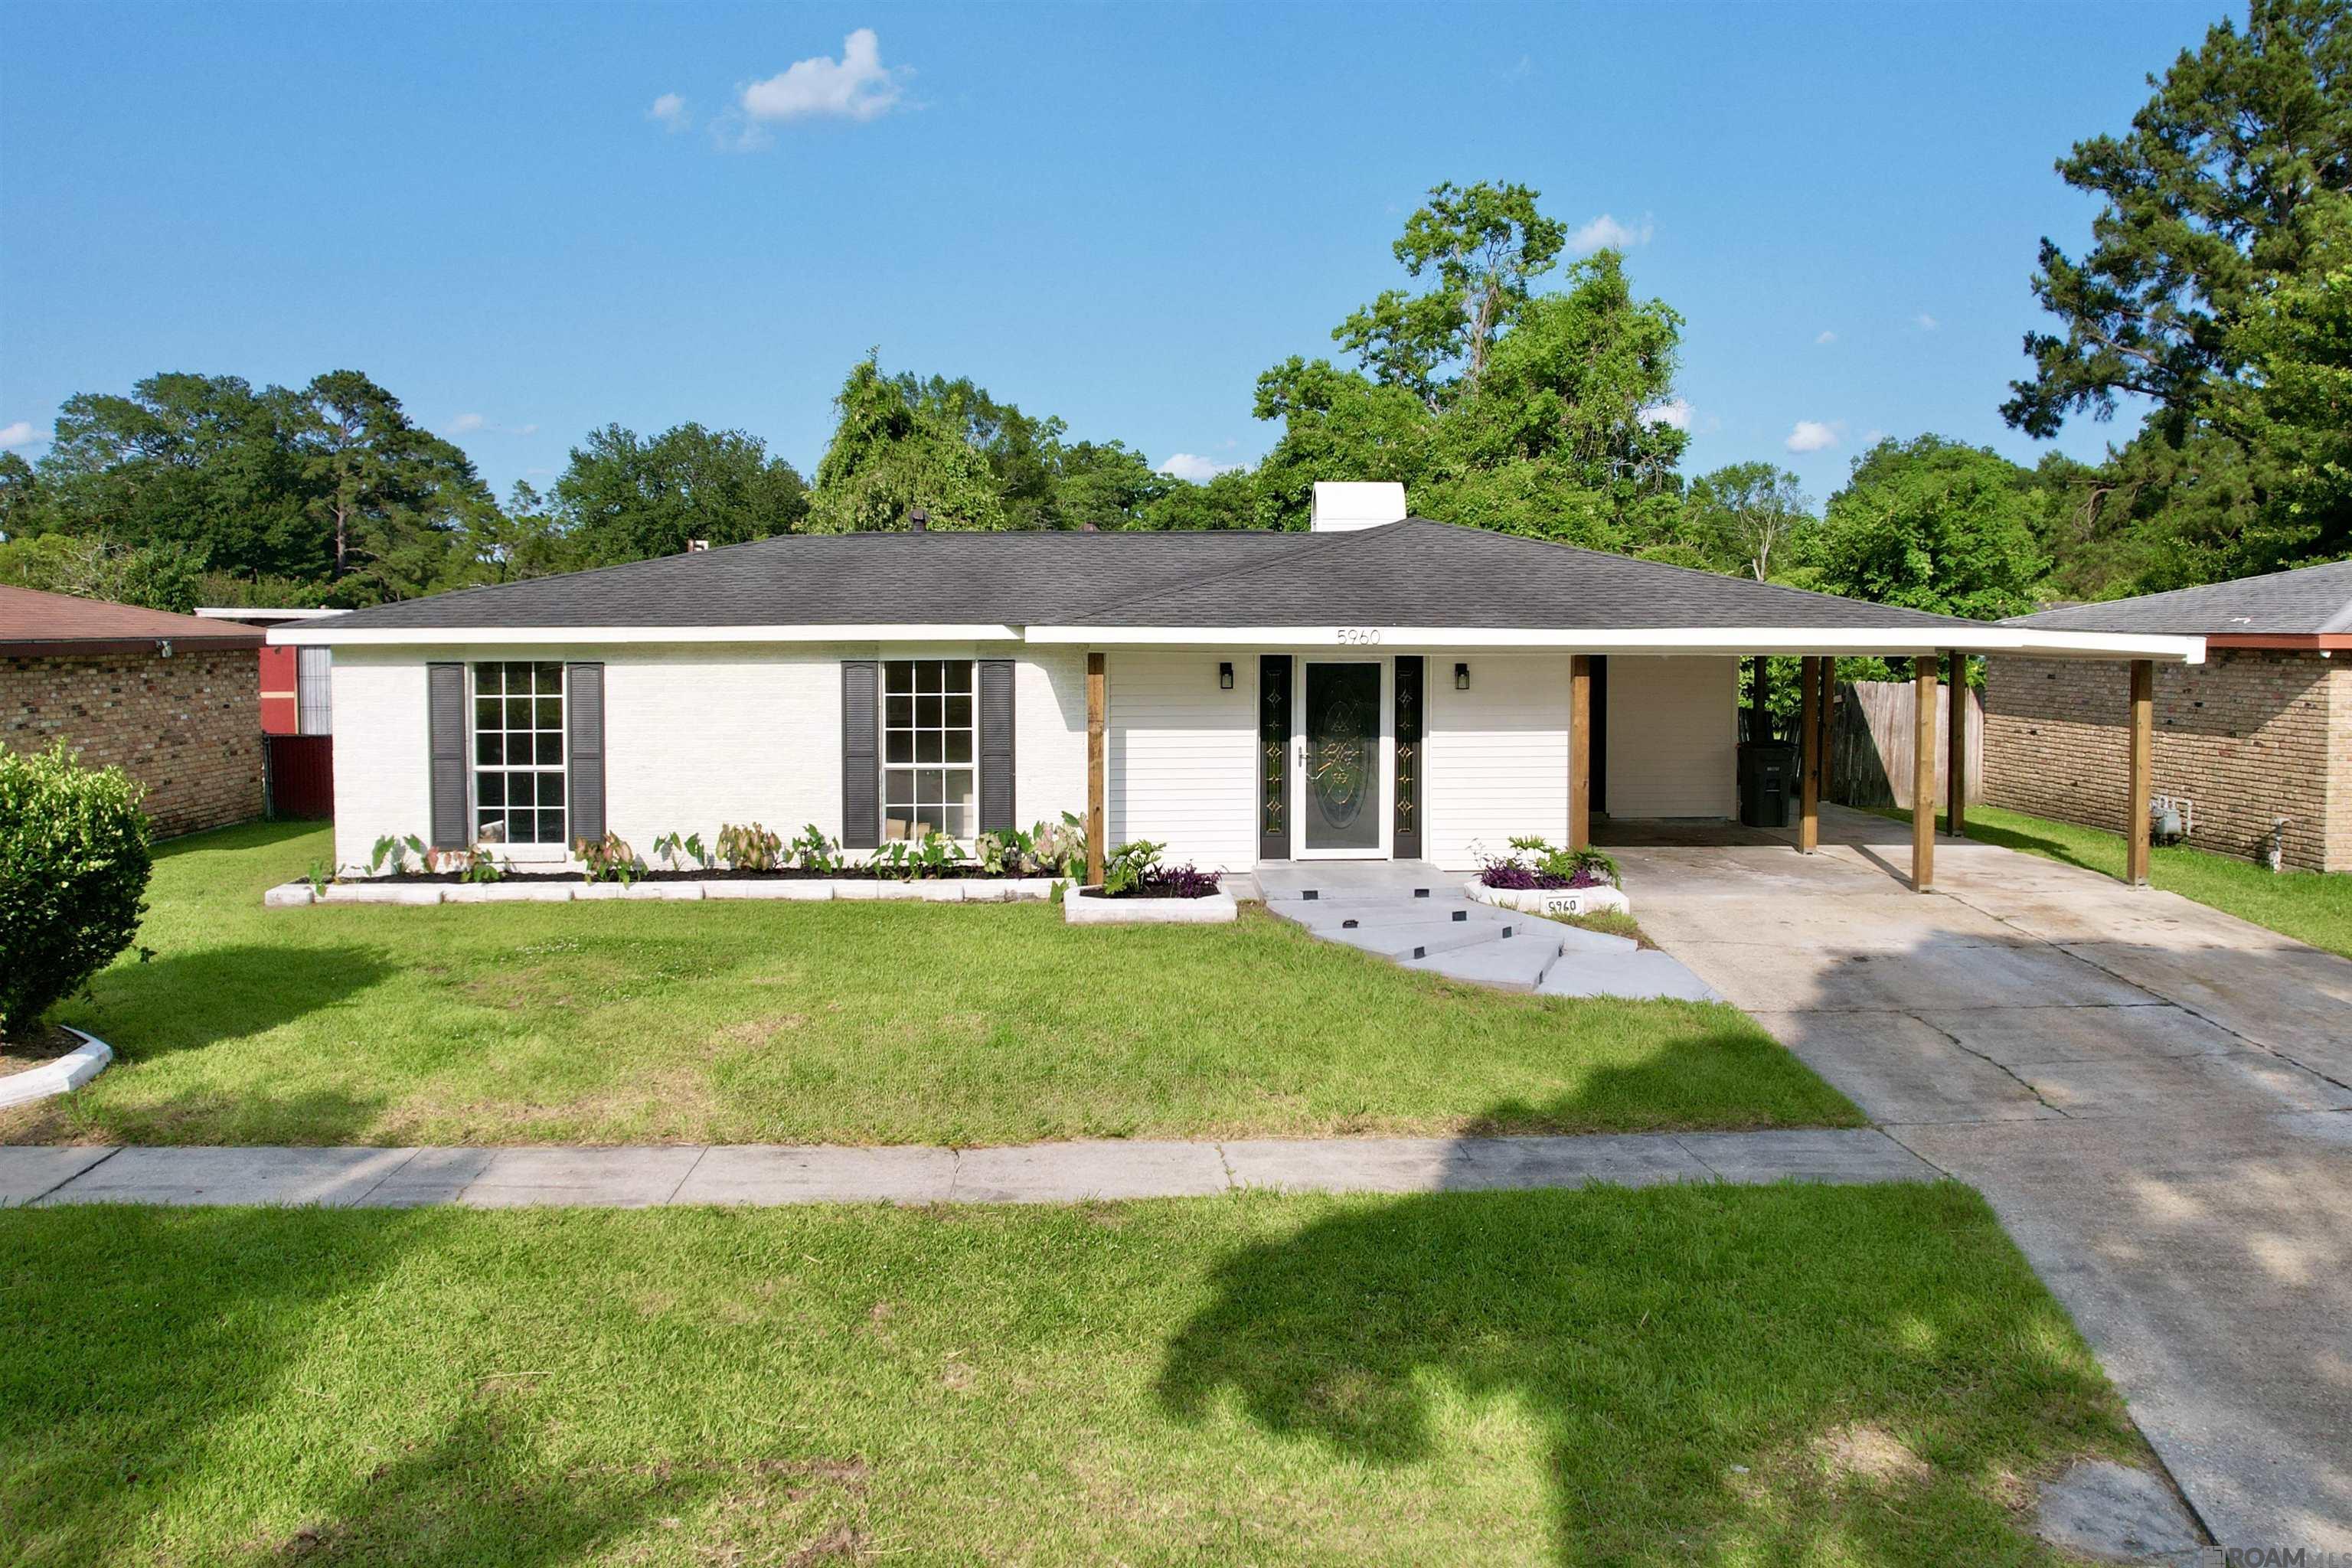
Pending
$195,000
3
bds
|
2
ba
|
1,700
sqft
|
built
1965
5960 W Fairlane Ct, Baton Rouge, LA 70812
$-469
Cash flow
-12.5%
Cash-on-Cash Return
3.4%
Cap rate
0.4%
Rent to Value Ratio
Active
$345,000
4
bds
|
3
ba
|
2,011
sqft
|
built
2022
10810 Maitland Ave, Baton Rouge, LA 70810
$-60
Cash flow
-0.9%
Cash-on-Cash Return
6.1%
Cap rate
0.8%
Rent to Value Ratio
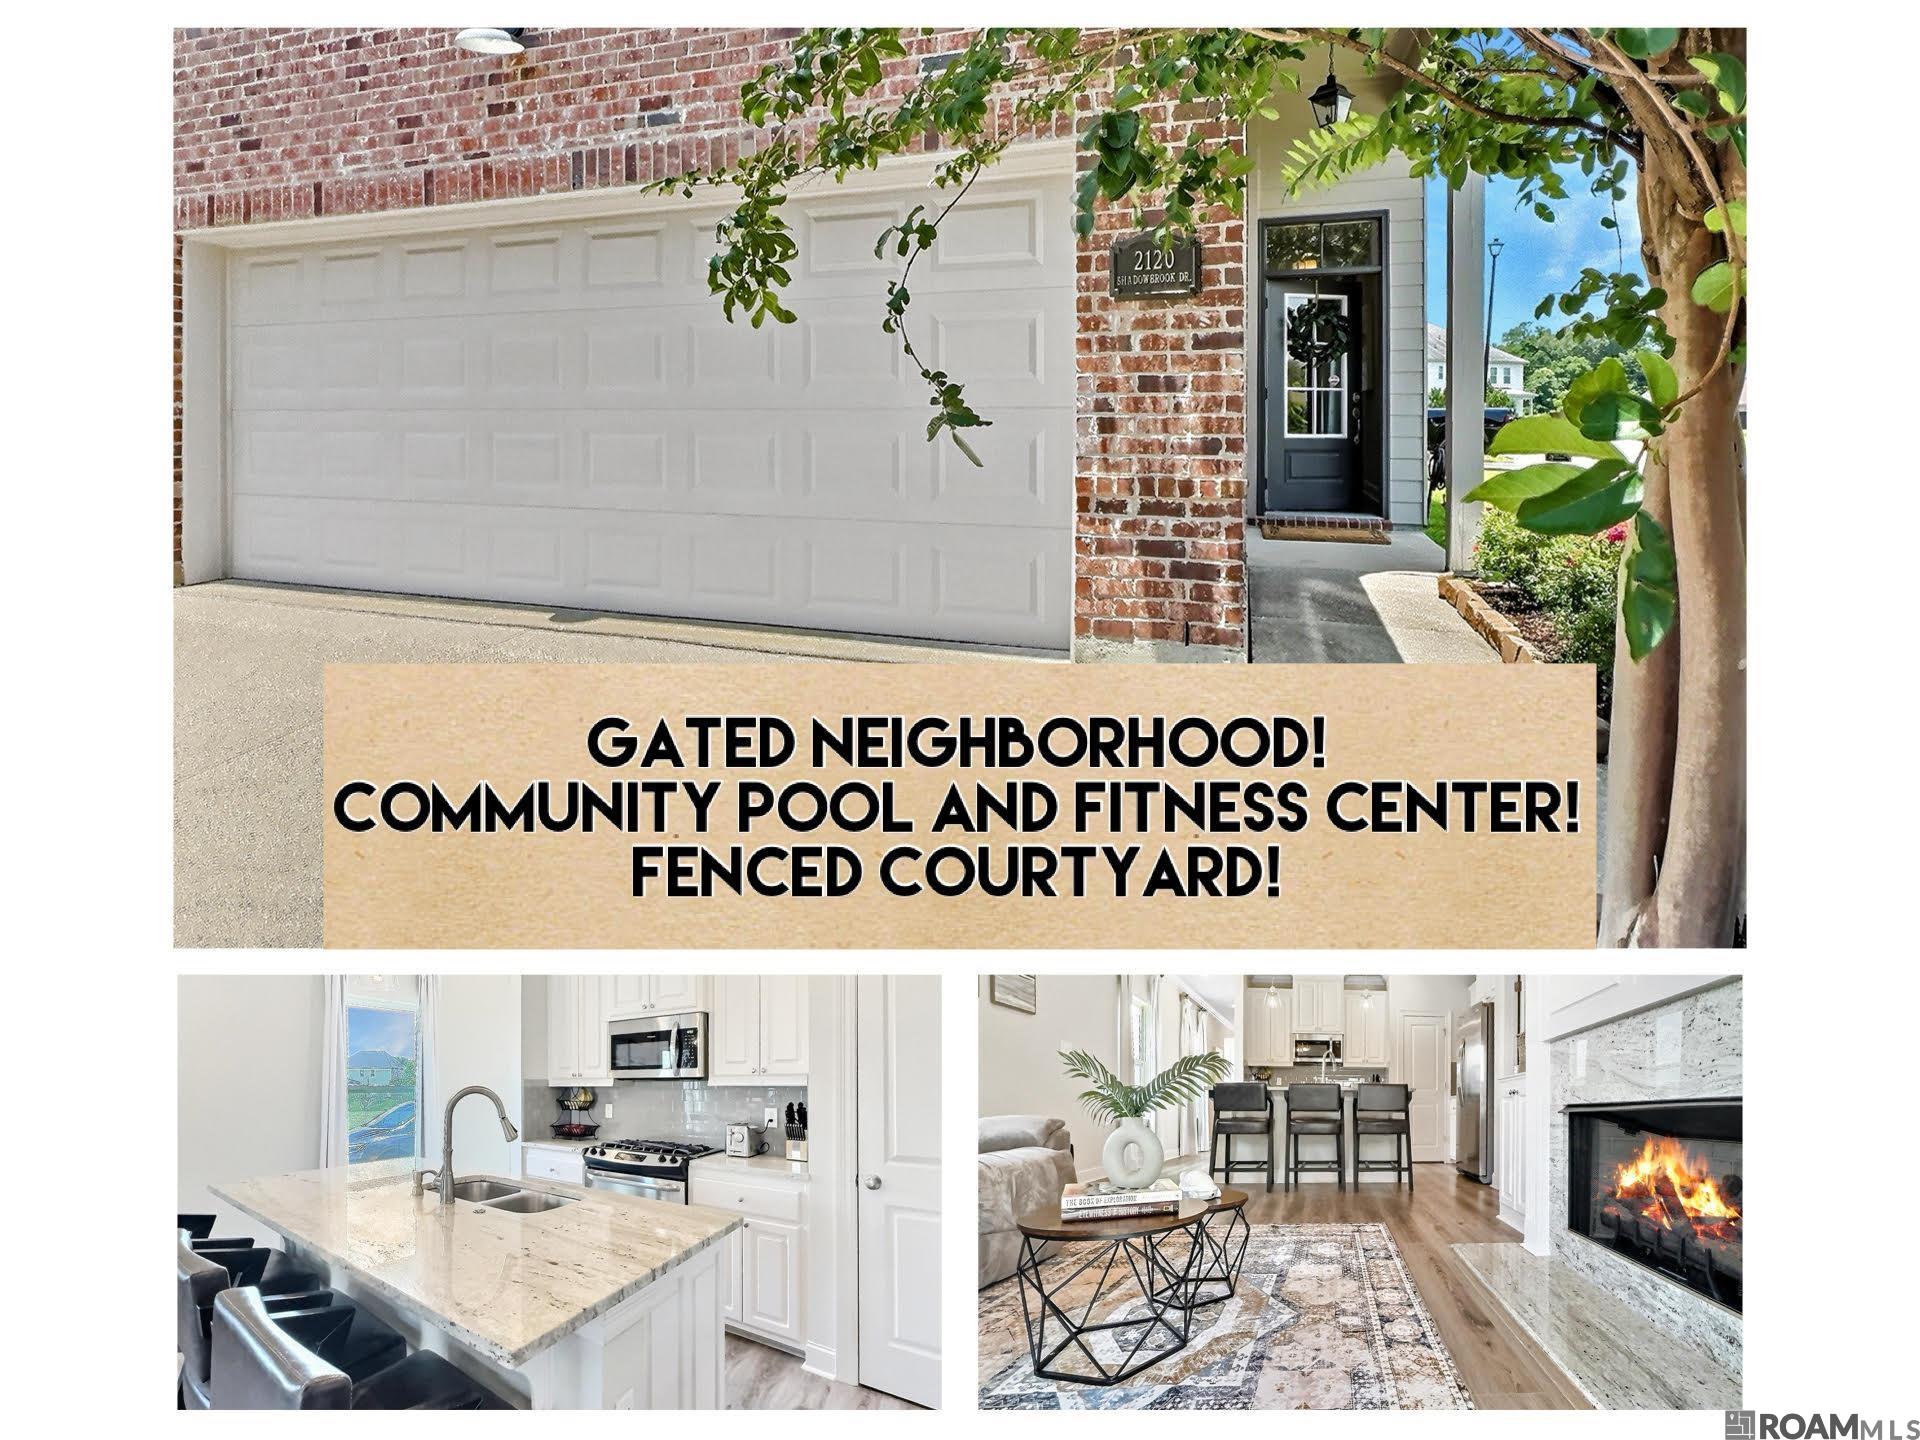
Active
$260,000
3
bds
|
3
ba
|
1,735
sqft
|
built
2017
2120 Shadowbrook Dr W, Baton Rouge, LA 70816
$-409
Cash flow
-8.2%
Cash-on-Cash Return
4.4%
Cap rate
0.6%
Rent to Value Ratio
Active
$250,000
4
bds
|
3
ba
|
2,049
sqft
|
built
1968
333 Eileen Dr, Baton Rouge, LA 70815
$71
Cash flow
1.5%
Cash-on-Cash Return
6.6%
Cap rate
0.8%
Rent to Value Ratio
Pending
$175,000
3
bds
|
2
ba
|
1,162
sqft
|
built
1990
427 E Bolivar Dr, Baton Rouge, LA 70819
$188
Cash flow
5.6%
Cash-on-Cash Return
7.6%
Cap rate
0.9%
Rent to Value Ratio
Active
$479,000
4
bds
|
4
ba
|
2,687
sqft
|
built
1981
435 Corsair Dr, Baton Rouge, LA 70810
$-576
Cash flow
-6.3%
Cash-on-Cash Return
4.8%
Cap rate
0.6%
Rent to Value Ratio
Pending
$250,000
4
bds
|
3
ba
|
2,118
sqft
|
built
1977
12525 Excalibur Ave, Baton Rouge, LA 70816
$61
Cash flow
1.3%
Cash-on-Cash Return
6.6%
Cap rate
0.8%
Rent to Value Ratio

Active
$265,000
3
bds
|
1
ba
|
1,135
sqft
|
built
1958
774 Edison St, Baton Rouge, LA 70806
$-215
Cash flow
-4.2%
Cash-on-Cash Return
5.3%
Cap rate
0.6%
Rent to Value Ratio
Active
$295,000
3
bds
|
2
ba
|
1,524
sqft
|
built
2016
1405 Alouette Dr, Baton Rouge, LA 70820
$-490
Cash flow
-8.7%
Cash-on-Cash Return
4.3%
Cap rate
0.5%
Rent to Value Ratio
Active
$1,065,000
3
bds
|
3
ba
|
3,293
sqft
|
built
2006
6428 Province Ln, Baton Rouge, LA 70808
$-3,164
Cash flow
-15.5%
Cash-on-Cash Return
2.7%
Cap rate
0.3%
Rent to Value Ratio
Active
$950,000
5
bds
|
5
ba
|
5,074
sqft
|
built
2017
13013 W Waterside Dr, Baton Rouge, LA 70818
$-1,105
Cash flow
-6.1%
Cash-on-Cash Return
4.9%
Cap rate
0.6%
Rent to Value Ratio
Active
$180,500
3
bds
|
2
ba
|
1,457
sqft
|
built
2004
6142 Wright Dr, Baton Rouge, LA 70812
$159
Cash flow
4.6%
Cash-on-Cash Return
7.3%
Cap rate
0.9%
Rent to Value Ratio

Pending
$90,000
4
bds
|
2
ba
|
3,320
sqft
|
built
1980
9331 Scenic Hwy, Baton Rouge, LA 70807
$633
Cash flow
36.7%
Cash-on-Cash Return
14.7%
Cap rate
1.8%
Rent to Value Ratio
Active
$48,500
3
bds
|
1
ba
|
1,600
sqft
|
built
1950
3655 Sherwood St, Baton Rouge, LA 70805
$897
Cash flow
21.5%
Cash-on-Cash Return
22.2%
Cap rate
2.7%
Rent to Value Ratio
Active
$44,900
3
bds
|
2
ba
|
1,694
sqft
|
built
1974
823 S 12th St, Baton Rouge, LA 70802
$759
Cash flow
19.7%
Cash-on-Cash Return
20.3%
Cap rate
2.4%
Rent to Value Ratio

Active
$30,000
3
bds
|
2
ba
|
1,000
sqft
|
built
1950
6372 Nellie Ave, Baton Rouge, LA 70805
$690
Cash flow
26.8%
Cash-on-Cash Return
27.6%
Cap rate
3.3%
Rent to Value Ratio
Active
$24,995
3
bds
|
1
ba
|
1,015
sqft
|
built
1975
5348 E Brookstown Dr, Baton Rouge, LA 70805
$621
Cash flow
28.9%
Cash-on-Cash Return
29.8%
Cap rate
3.6%
Rent to Value Ratio
Active
$24,995
3
bds
|
1
ba
|
949
sqft
|
built
1975
5262 E Brookstown Dr, Baton Rouge, LA 70805
$621
Cash flow
28.9%
Cash-on-Cash Return
29.8%
Cap rate
3.6%
Rent to Value Ratio
Active
$699,000
3
bds
|
2
ba
|
2,258
sqft
|
built
2017
2020 Elissalde St, Baton Rouge, LA 70808
$-2,625
Cash flow
-19.6%
Cash-on-Cash Return
1.8%
Cap rate
0.2%
Rent to Value Ratio

Active
$1,495,000
5
bds
|
4
ba
|
5,662
sqft
|
built
1974
6644 Pikes Ln, Baton Rouge, LA 70808
$-3,634
Cash flow
-12.7%
Cash-on-Cash Return
3.4%
Cap rate
0.4%
Rent to Value Ratio
Active
$182,500
3
bds
|
1
ba
|
1,075
sqft
|
built
1965
6872 Clinton Ave, Baton Rouge, LA 70805
$-197
Cash flow
-5.6%
Cash-on-Cash Return
5.0%
Cap rate
0.6%
Rent to Value Ratio
Active
$675,000
5
bds
|
4
ba
|
4,015
sqft
|
built
1988
4826 Beech Harbor Ave, Baton Rouge, LA 70817
$-894
Cash flow
-6.9%
Cash-on-Cash Return
4.7%
Cap rate
0.6%
Rent to Value Ratio

Active
$329,000
2
bds
|
2
ba
|
1,152
sqft
|
built
1913
666 N 7th St, Baton Rouge, LA 70802
$-550
Cash flow
-8.7%
Cash-on-Cash Return
4.3%
Cap rate
0.5%
Rent to Value Ratio

Active
$685,000
3
bds
|
4
ba
|
3,015
sqft
|
built
2012
9848 Grenwich Ave, Baton Rouge, LA 70809
$-766
Cash flow
-5.8%
Cash-on-Cash Return
4.9%
Cap rate
0.6%
Rent to Value Ratio
Active
$300,000
3
bds
|
2
ba
|
1,507
sqft
|
built
1950
819 Wiltz Dr, Baton Rouge, LA 70806
$-191
Cash flow
-3.3%
Cash-on-Cash Return
5.5%
Cap rate
0.7%
Rent to Value Ratio