Baton Rouge, LA Investment Properties for Sale
Browse homes for sale and investment properties in Baton Rouge, LA. Refine your search by price, property type, or more.
Best cash flowing properties in Baton Rouge, LA

Active
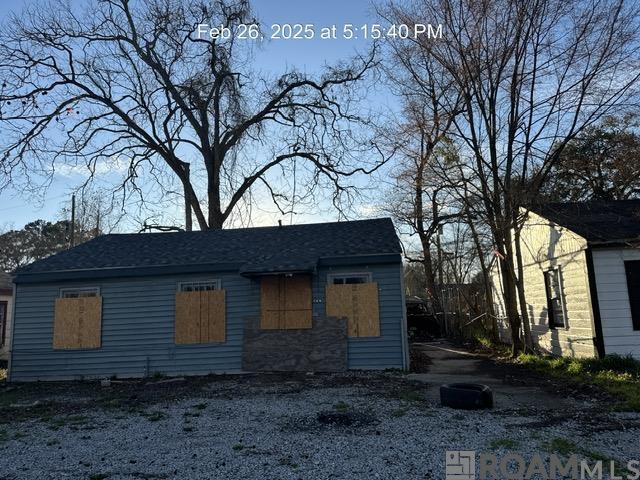
$19,999
3
bds
|
2
ba
|
1,558
sqft
|
built
1970
4723 Madison Ave, Baton Rouge, LA 70802
$828
Cash flow
48.2%
Cash-on-Cash Return
49.7%
Cap rate
6.0%
Rent to Value Ratio
Active
$12,500
2
bds
|
1
ba
|
700
sqft
|
built
1974
5169 Annette St, Baton Rouge, LA 70805
$759
Cash flow
70.7%
Cash-on-Cash Return
72.9%
Cap rate
8.8%
Rent to Value Ratio
980 out of 1,263 properties for sale in Baton Rouge, LA
Limited Results Shown
Create a free account, or log in to reveal all property listings and enjoy the complete experience.
Active
$350,000
3
bds
|
0
ba
|
3,214
sqft
|
built
1980
1532 Sharlo Ave, Baton Rouge, LA 70820
$-770
Cash flow
-11.5%
Cash-on-Cash Return
3.0%
Cap rate
0.4%
Rent to Value Ratio
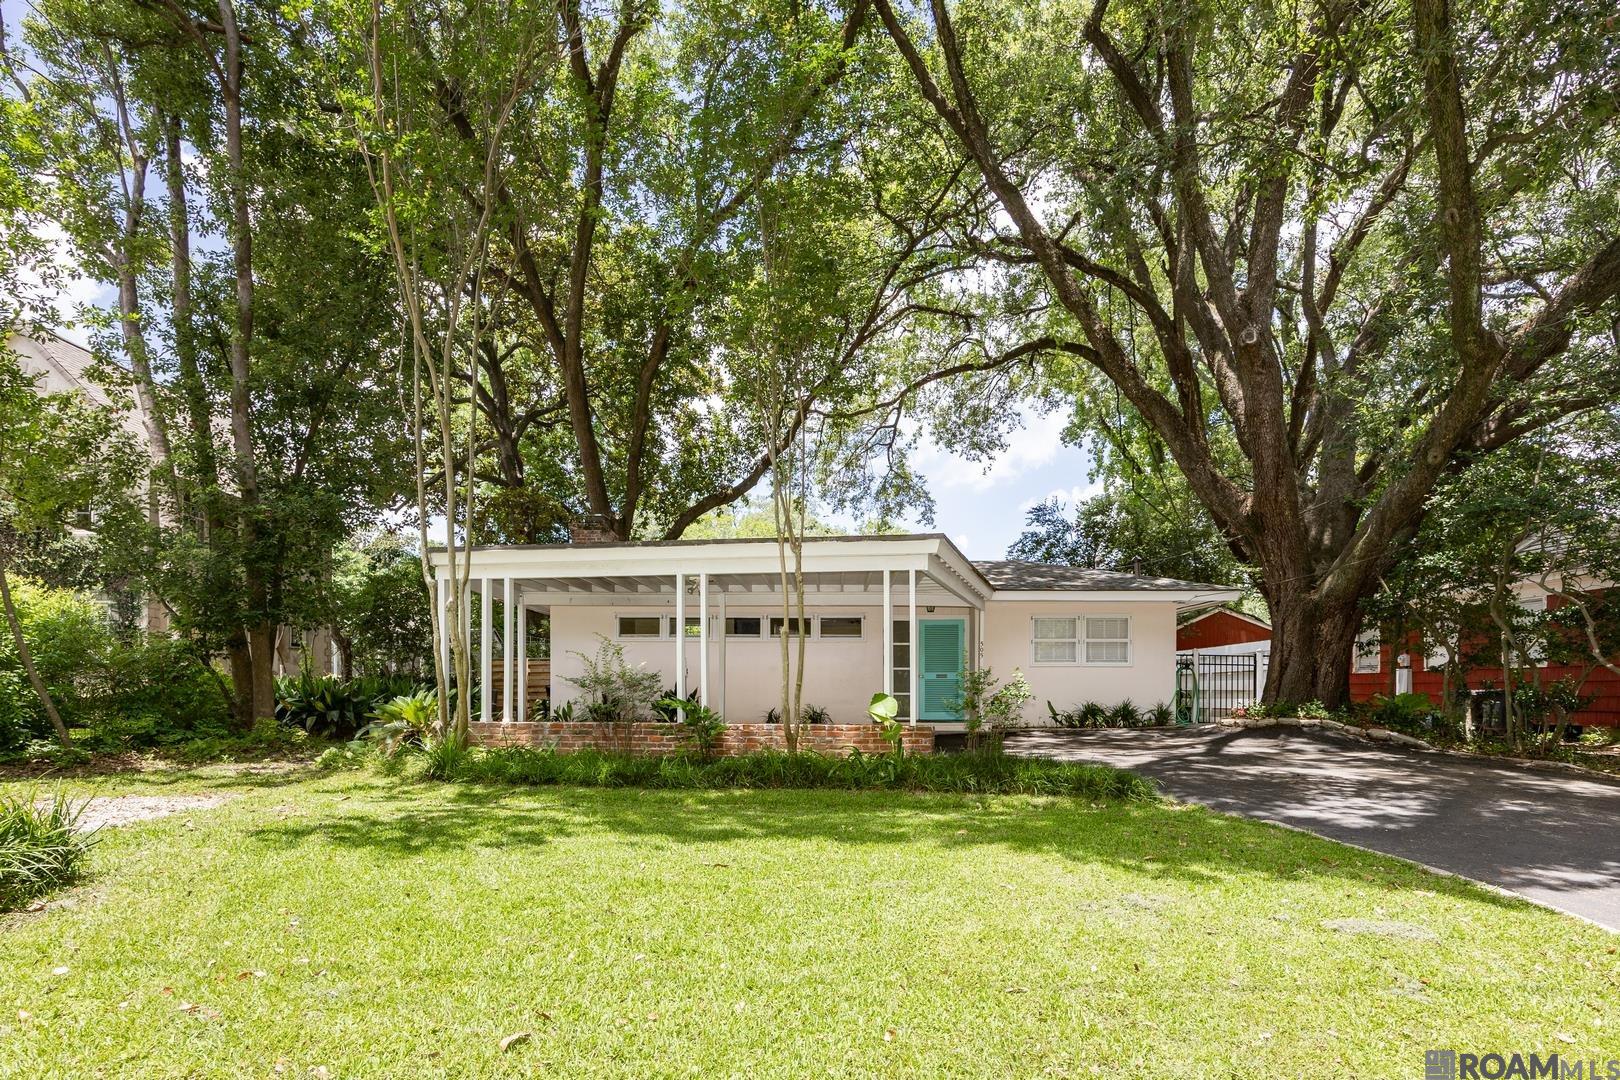
Active
$354,000
2
bds
|
2
ba
|
1,775
sqft
|
built
1950
505 Delgado Dr, Baton Rouge, LA 70808
$-295
Cash flow
-4.3%
Cash-on-Cash Return
4.7%
Cap rate
0.6%
Rent to Value Ratio
Active
$299,000
3
bds
|
2
ba
|
1,663
sqft
|
built
2012
7935 Seville Ct, Baton Rouge, LA 70820
$72
Cash flow
1.3%
Cash-on-Cash Return
6.0%
Cap rate
0.8%
Rent to Value Ratio
Active
$505,000
4
bds
|
3
ba
|
3,288
sqft
|
built
1968
4075 N Bluebonnet Rd, Baton Rouge, LA 70809
$-646
Cash flow
-6.7%
Cash-on-Cash Return
4.1%
Cap rate
0.5%
Rent to Value Ratio
Active
$285,000
4
bds
|
2
ba
|
1,773
sqft
|
built
2022
11202 E Big Bend Ave, Baton Rouge, LA 70814
$-245
Cash flow
-4.5%
Cash-on-Cash Return
4.6%
Cap rate
0.6%
Rent to Value Ratio
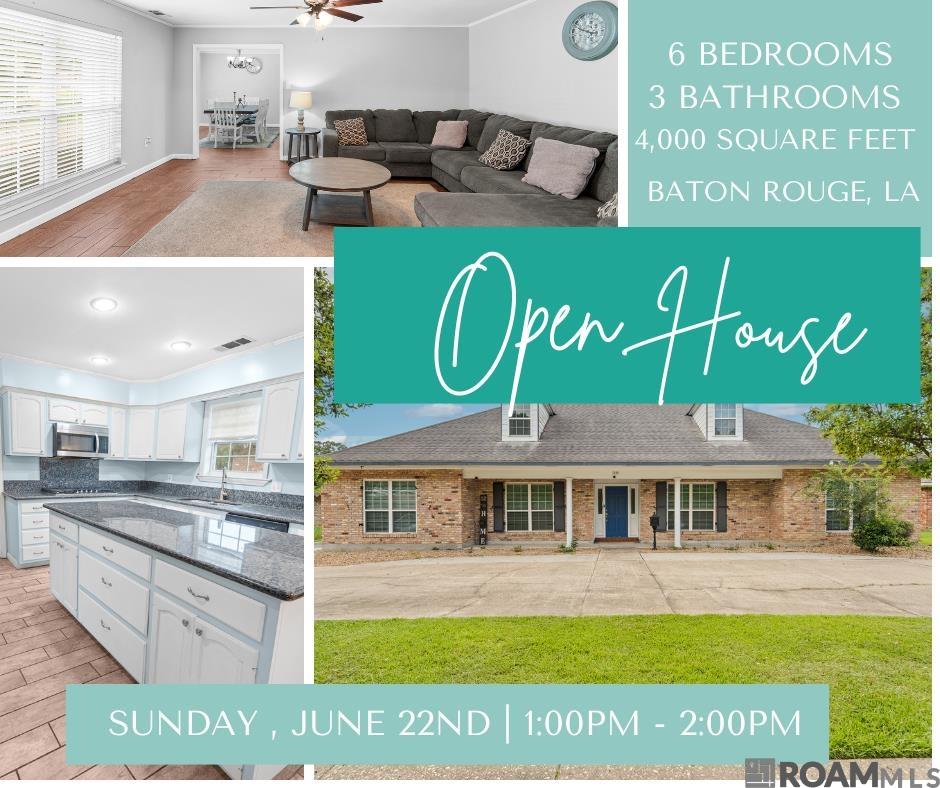
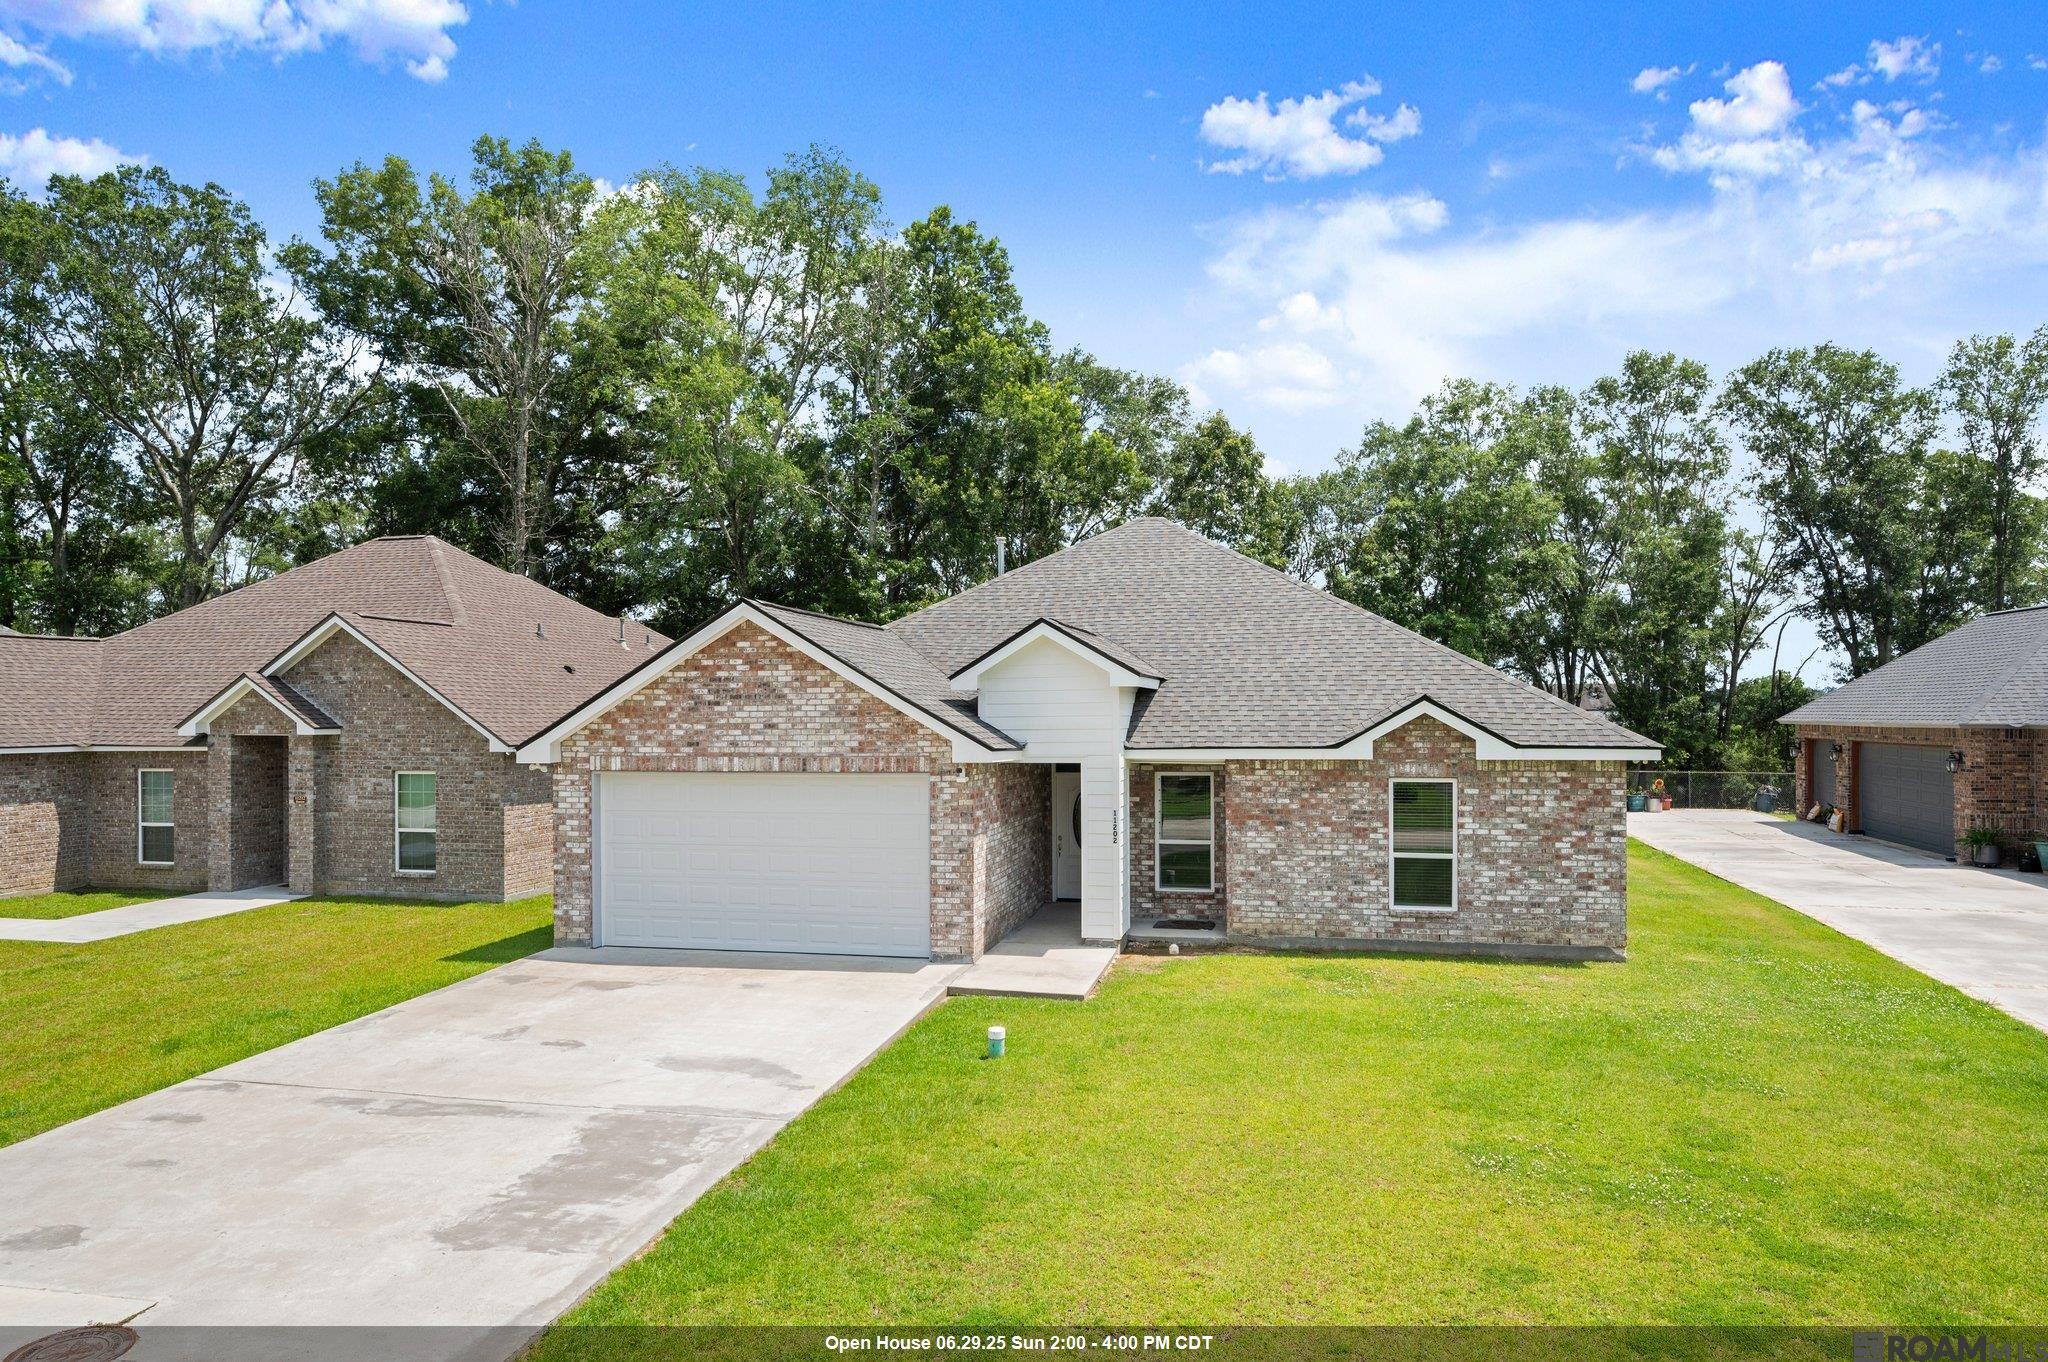
Active
$365,000
6
bds
|
3
ba
|
4,000
sqft
|
built
1965
1044 Sherwood Forest Blvd, Baton Rouge, LA 70815
$205
Cash flow
2.9%
Cash-on-Cash Return
6.4%
Cap rate
0.8%
Rent to Value Ratio
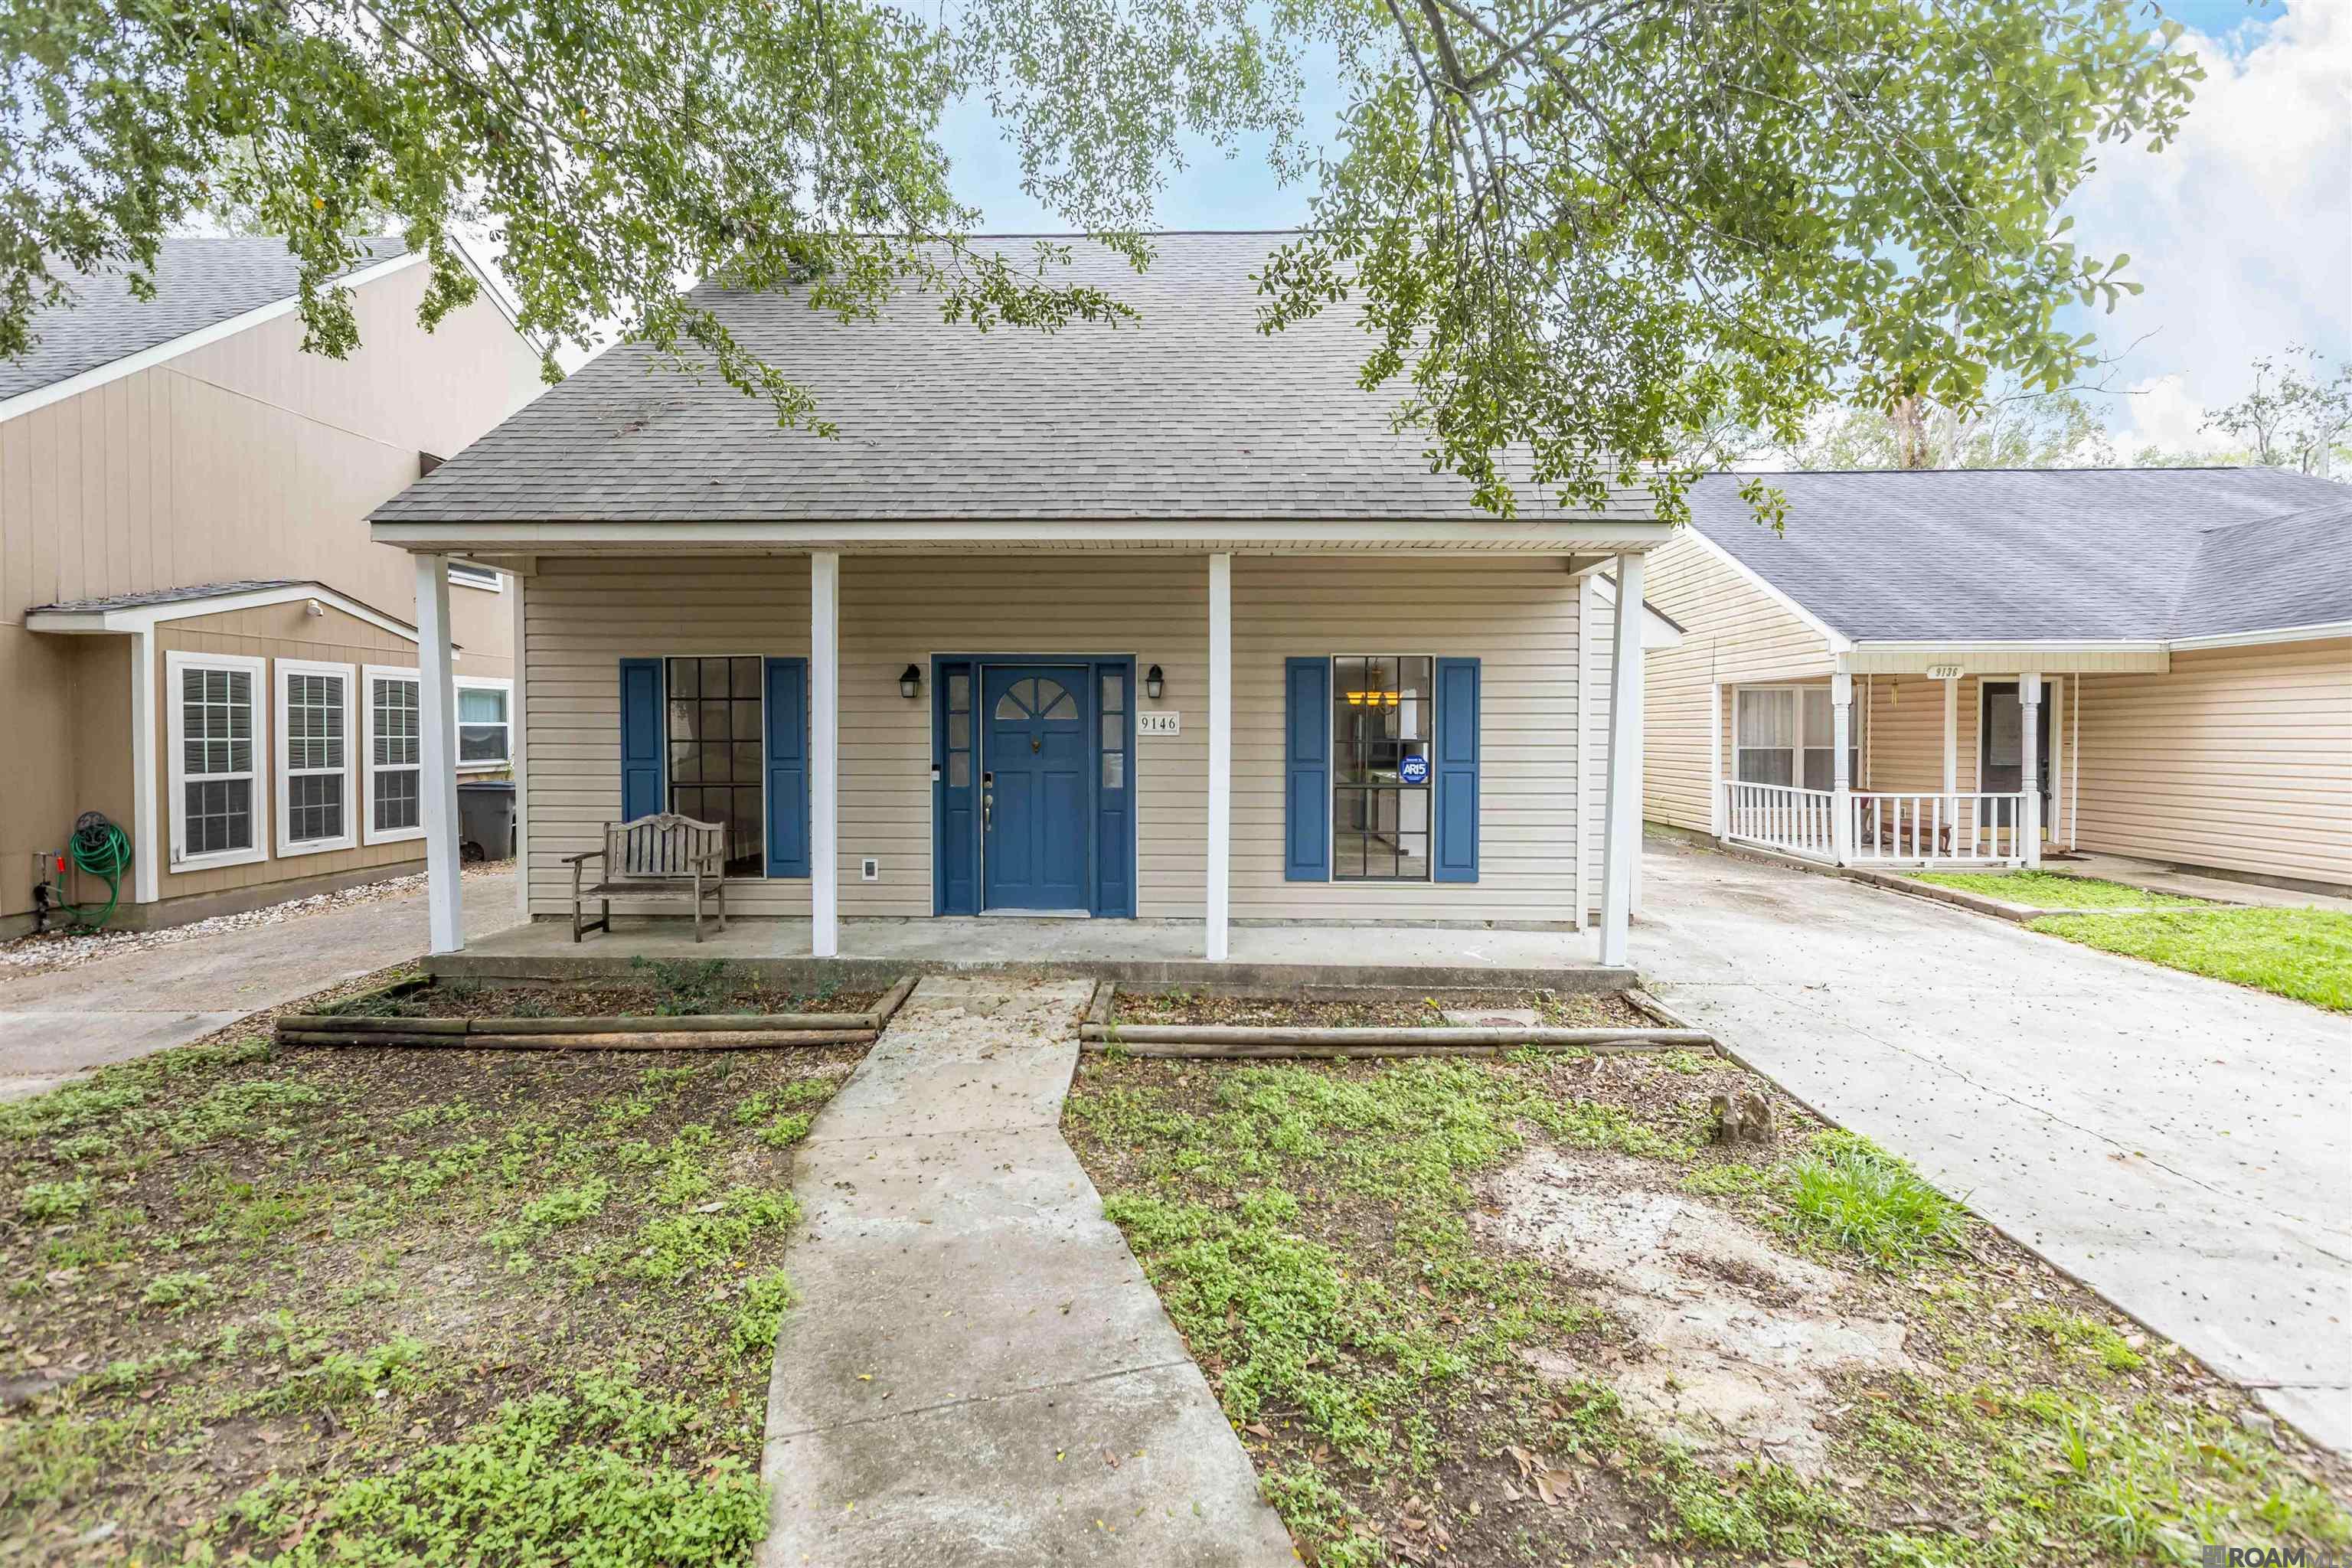
Active
$209,000
3
bds
|
2
ba
|
1,765
sqft
|
built
1987
9146 Fox Run Ave, Baton Rouge, LA 70808
$253
Cash flow
6.3%
Cash-on-Cash Return
7.1%
Cap rate
0.9%
Rent to Value Ratio
Active
$395,000
5
bds
|
5
ba
|
2,769
sqft
|
built
1970
633 Oak Hills Pkwy, Baton Rouge, LA 70810
$46
Cash flow
0.6%
Cash-on-Cash Return
5.8%
Cap rate
0.7%
Rent to Value Ratio
Active
$145,000
3
bds
|
2
ba
|
1,000
sqft
|
built
1972
4778 Broadway St, Baton Rouge, LA 70805
$-65
Cash flow
-2.3%
Cash-on-Cash Return
5.1%
Cap rate
0.6%
Rent to Value Ratio
Active
$250,000
3
bds
|
2
ba
|
1,438
sqft
|
built
2006
8942 Westlake Ave, Baton Rouge, LA 70810
$86
Cash flow
1.8%
Cash-on-Cash Return
6.1%
Cap rate
0.8%
Rent to Value Ratio
Active
$215,000
3
bds
|
2
ba
|
1,468
sqft
|
built
1970
3584 Courtland Dr, Baton Rouge, LA 70814
$87
Cash flow
2.1%
Cash-on-Cash Return
6.2%
Cap rate
0.7%
Rent to Value Ratio
Active
$655,000
4
bds
|
4
ba
|
4,238
sqft
|
built
2001
17630 Creek Hollow Rd, Baton Rouge, LA 70817
$-419
Cash flow
-3.3%
Cash-on-Cash Return
4.9%
Cap rate
0.6%
Rent to Value Ratio
Active
$349,000
3
bds
|
2
ba
|
1,783
sqft
|
built
2015
8365 Seville Ct, Baton Rouge, LA 70820
$-201
Cash flow
-3.0%
Cash-on-Cash Return
5.0%
Cap rate
0.6%
Rent to Value Ratio
Active
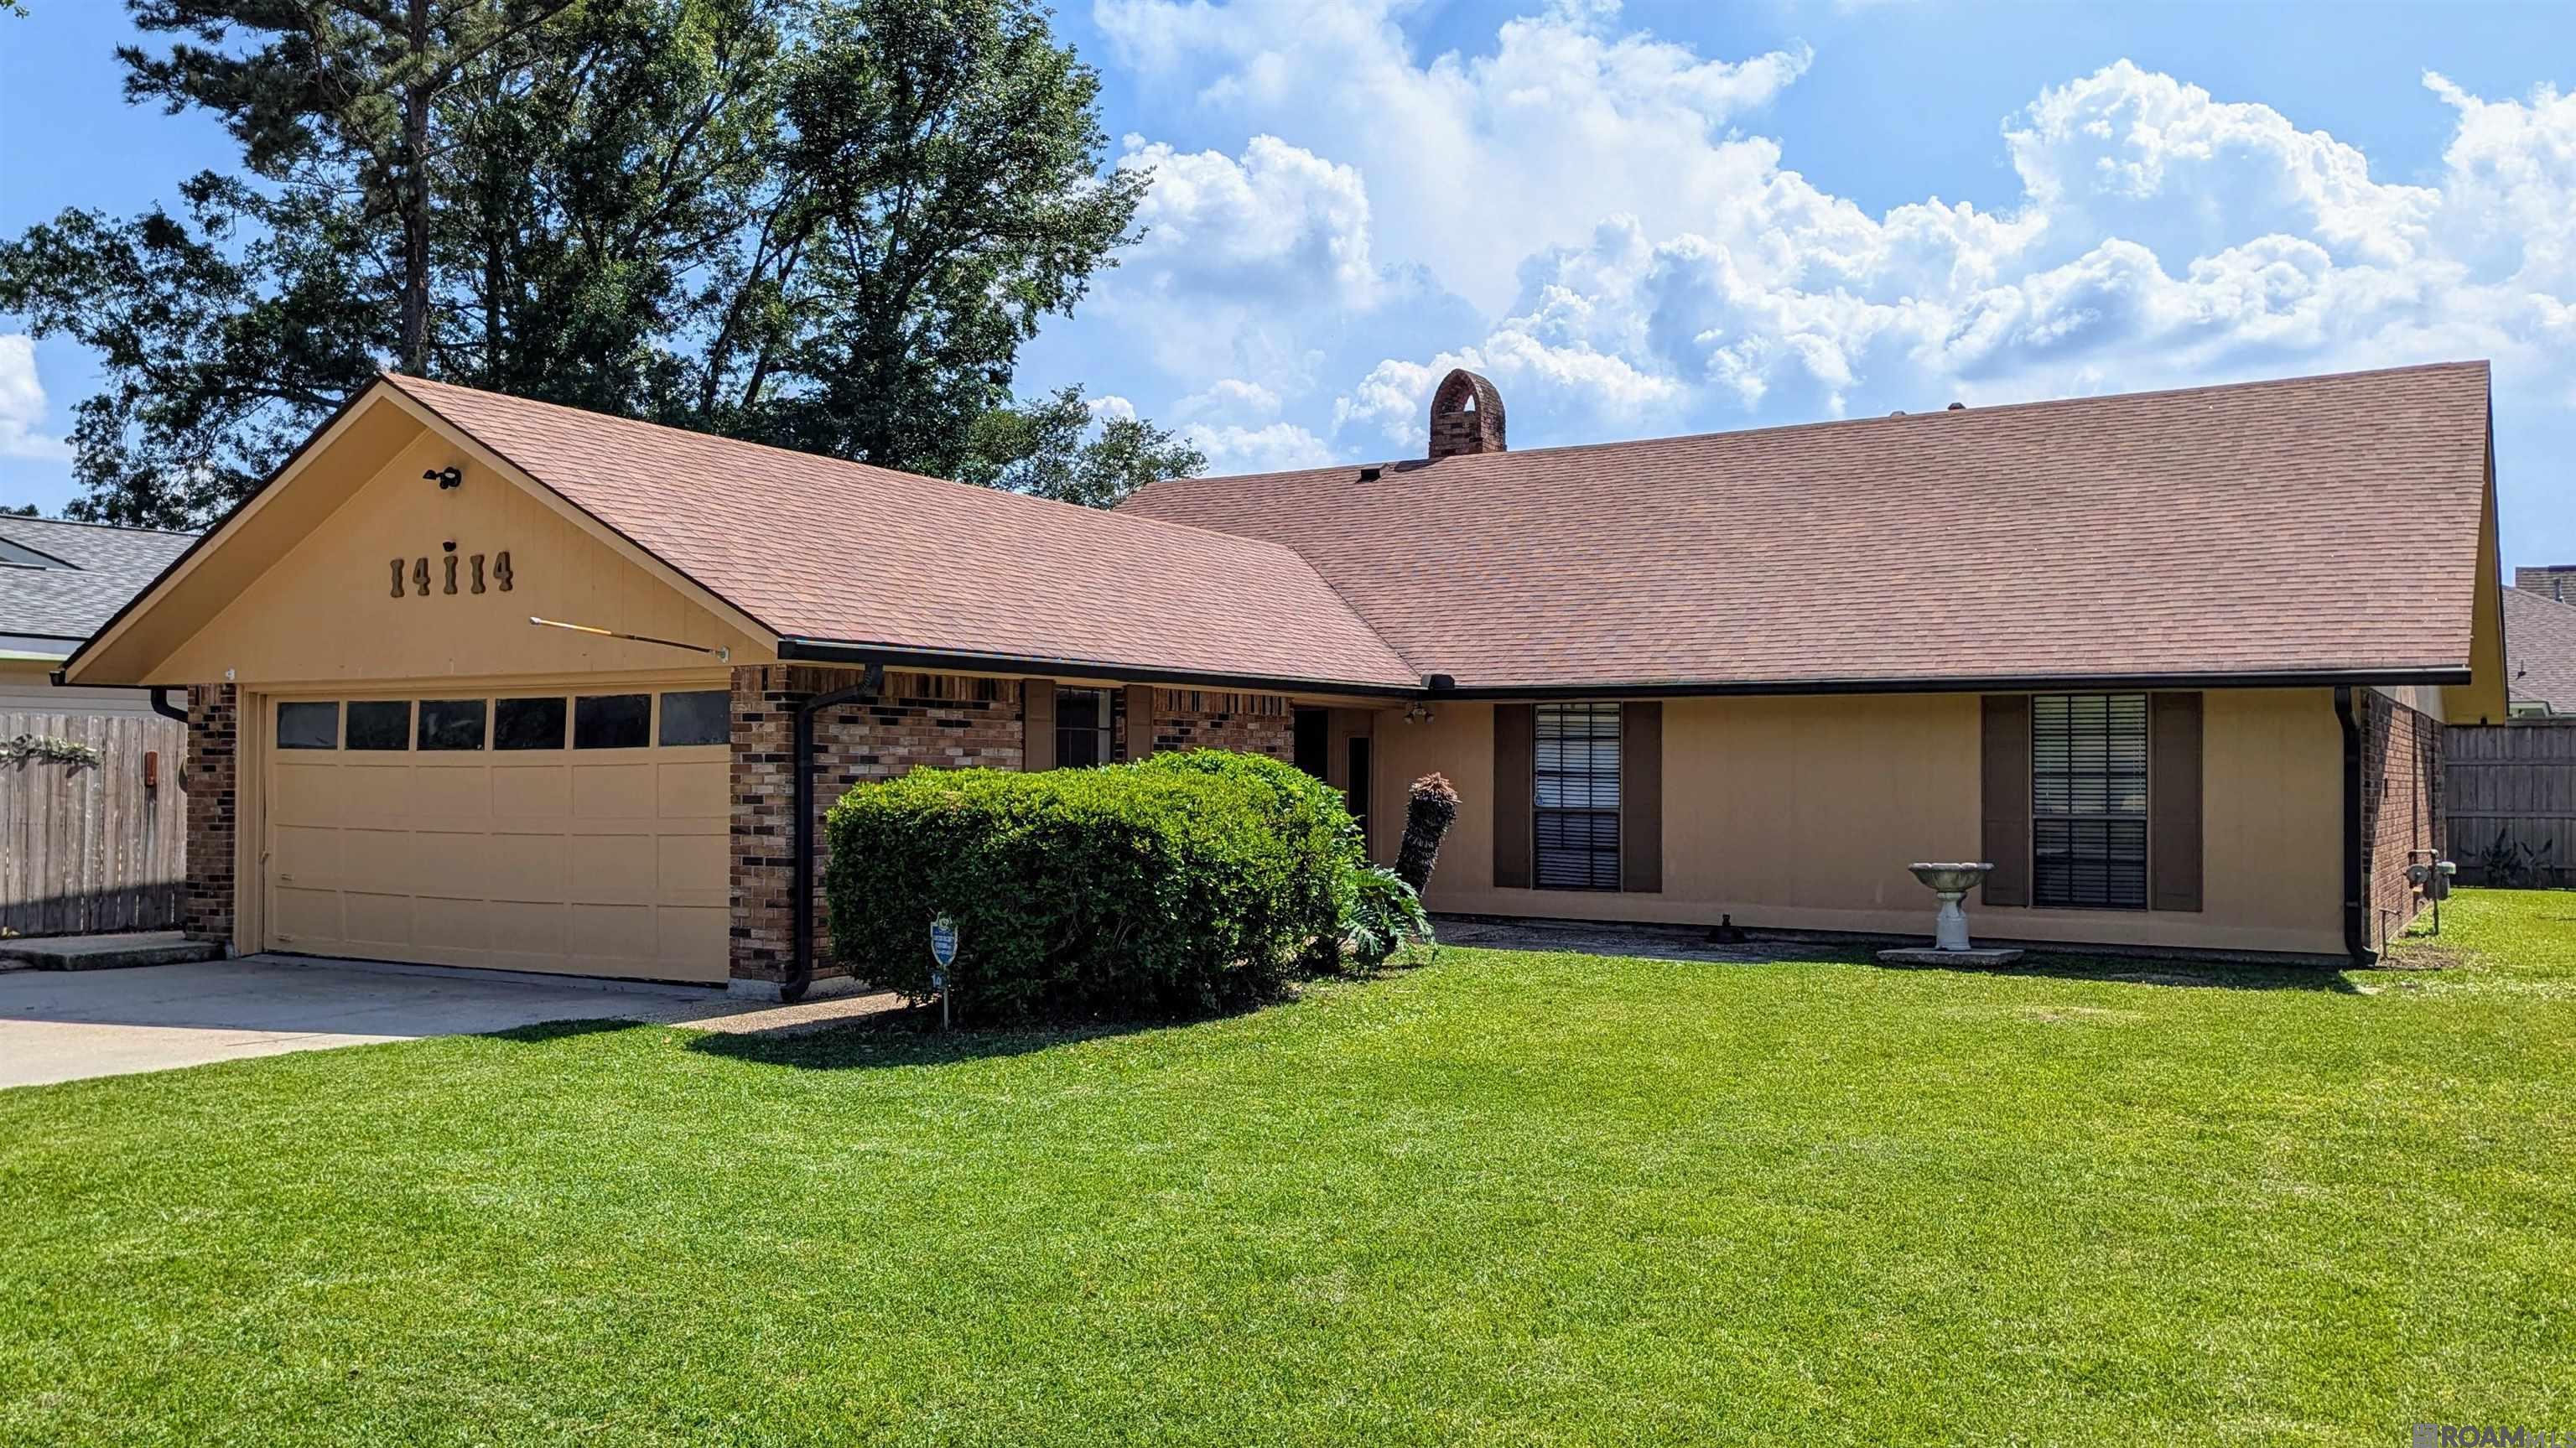
$249,900
3
bds
|
2
ba
|
1,978
sqft
|
built
1978
14114 Pinehurst Ave, Baton Rouge, LA 70817
$175
Cash flow
3.7%
Cash-on-Cash Return
6.5%
Cap rate
0.8%
Rent to Value Ratio
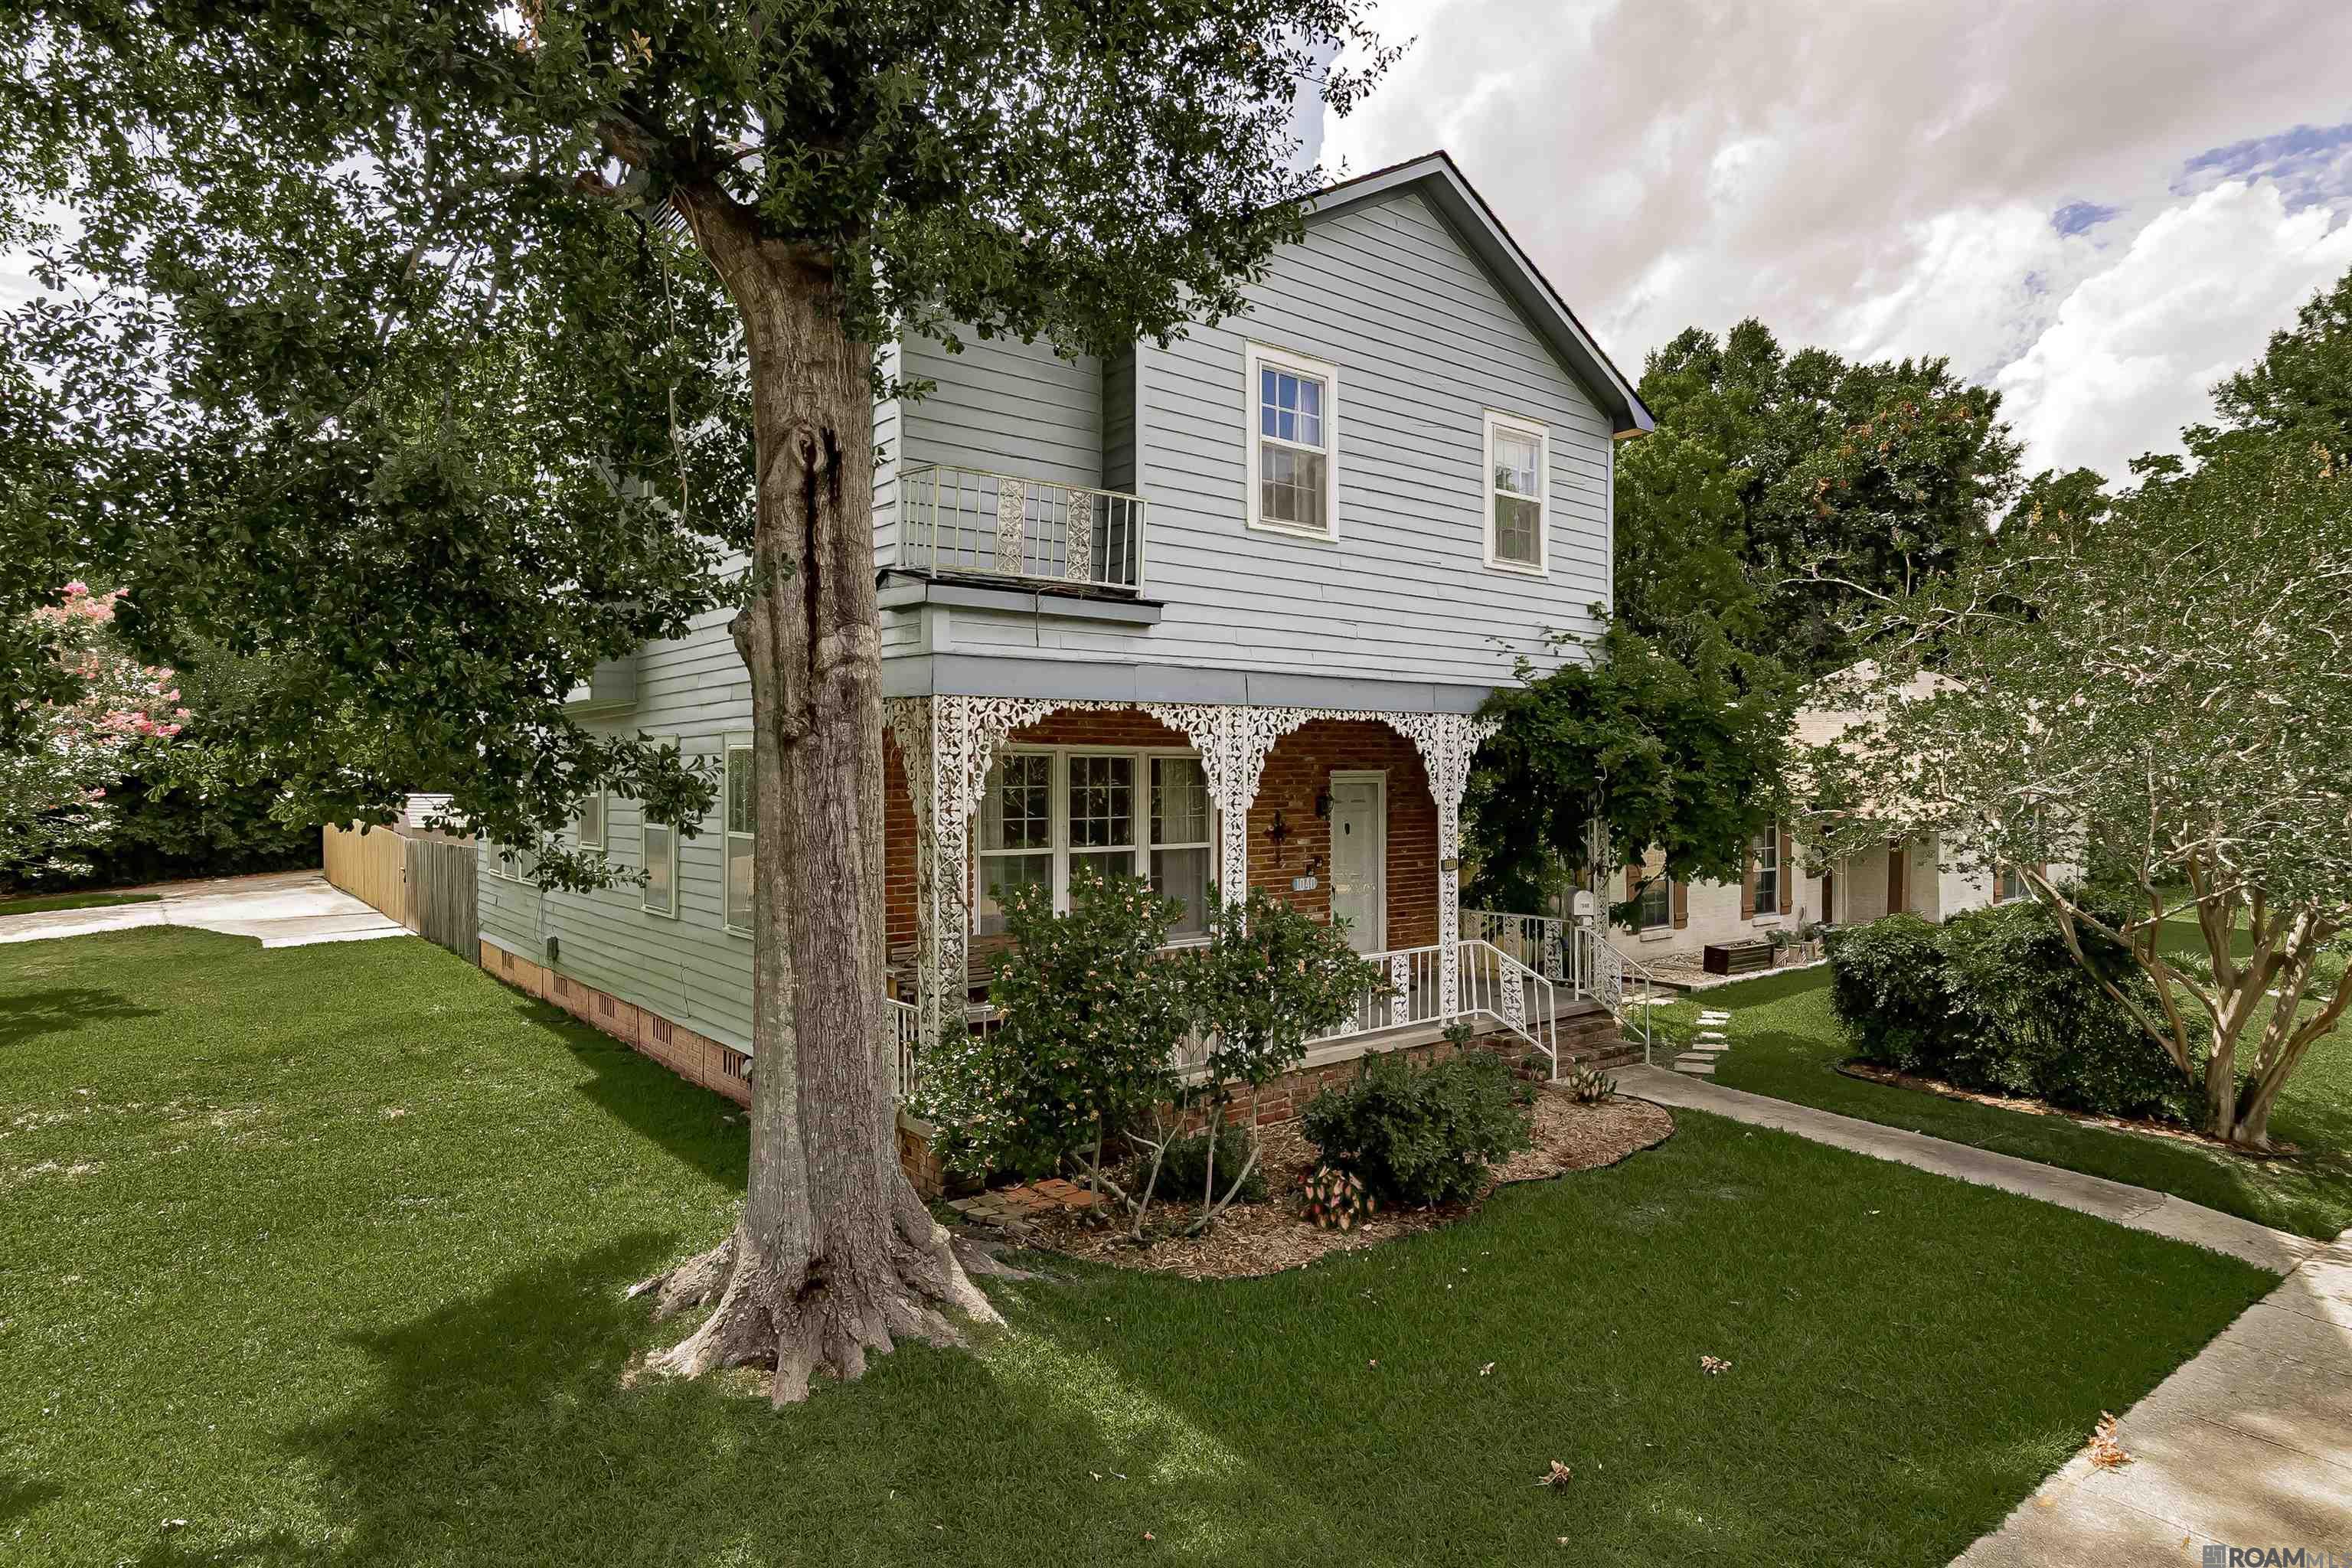
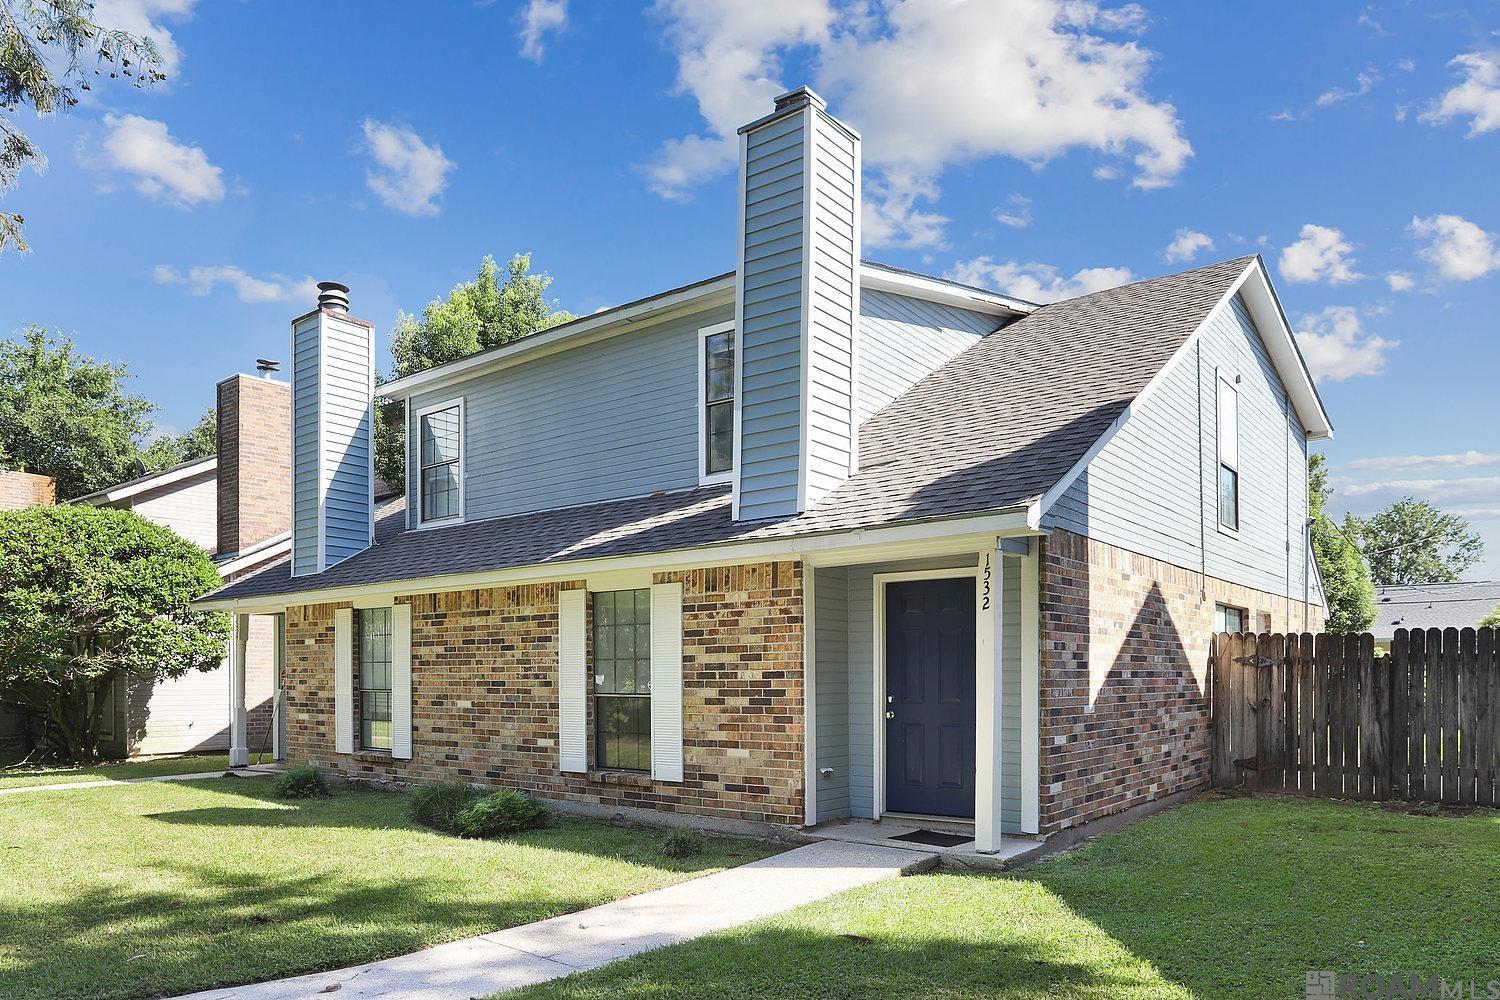
Active
$355,000
5
bds
|
3
ba
|
2,924
sqft
|
built
1910
1040 S Eugene St, Baton Rouge, LA 70806
$-438
Cash flow
-6.4%
Cash-on-Cash Return
4.2%
Cap rate
0.5%
Rent to Value Ratio
Active
$204,900
3
bds
|
2
ba
|
2,143
sqft
|
built
1962
1337 Savanna View Dr, Baton Rouge, LA 70810
$410
Cash flow
10.4%
Cash-on-Cash Return
8.1%
Cap rate
1.0%
Rent to Value Ratio
Active
$165,000
3
bds
|
2
ba
|
1,371
sqft
|
built
1960
2627 Edgewood Dr, Baton Rouge, LA 70802
$-22
Cash flow
-0.7%
Cash-on-Cash Return
5.5%
Cap rate
0.7%
Rent to Value Ratio
Pending
$59,900
2
bds
|
1
ba
|
985
sqft
|
built
1985
2855 Navajo St, Baton Rouge, LA 70805
$690
Cash flow
13.4%
Cash-on-Cash Return
13.8%
Cap rate
1.7%
Rent to Value Ratio
Active
$205,000
4
bds
|
2
ba
|
1,621
sqft
|
built
1990
11994 Old Hammond Hwy, Baton Rouge, LA 70816
$134
Cash flow
3.4%
Cash-on-Cash Return
6.5%
Cap rate
0.8%
Rent to Value Ratio
Active
$549,000
4
bds
|
3
ba
|
3,094
sqft
|
built
1995
9230 Blueridge Ave, Baton Rouge, LA 70809
$-942
Cash flow
-9.0%
Cash-on-Cash Return
3.6%
Cap rate
0.4%
Rent to Value Ratio
Active
$385,000
3
bds
|
2
ba
|
1,545
sqft
|
built
1949
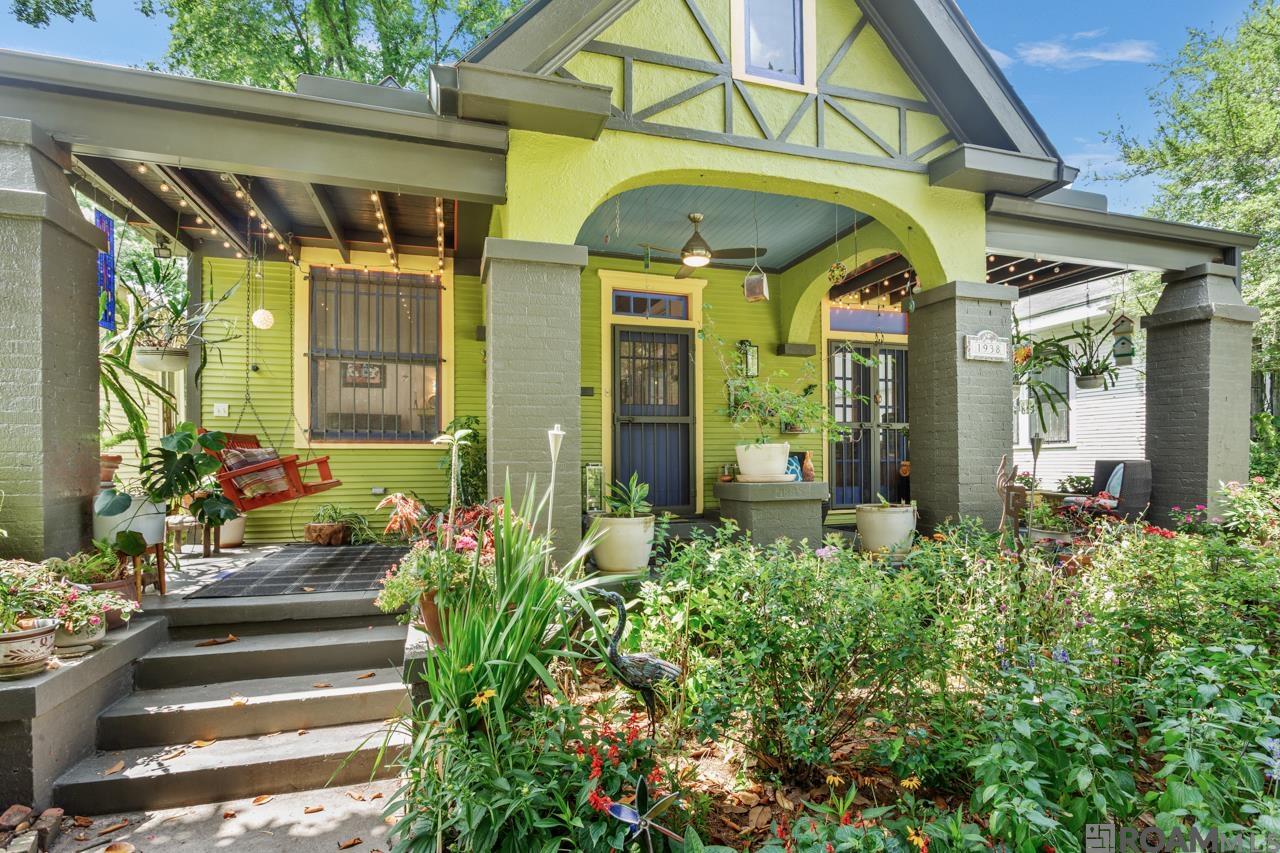
1938 Wisteria St, Baton Rouge, LA 70806
$-580
Cash flow
-7.9%
Cash-on-Cash Return
3.9%
Cap rate
0.5%
Rent to Value Ratio
Active
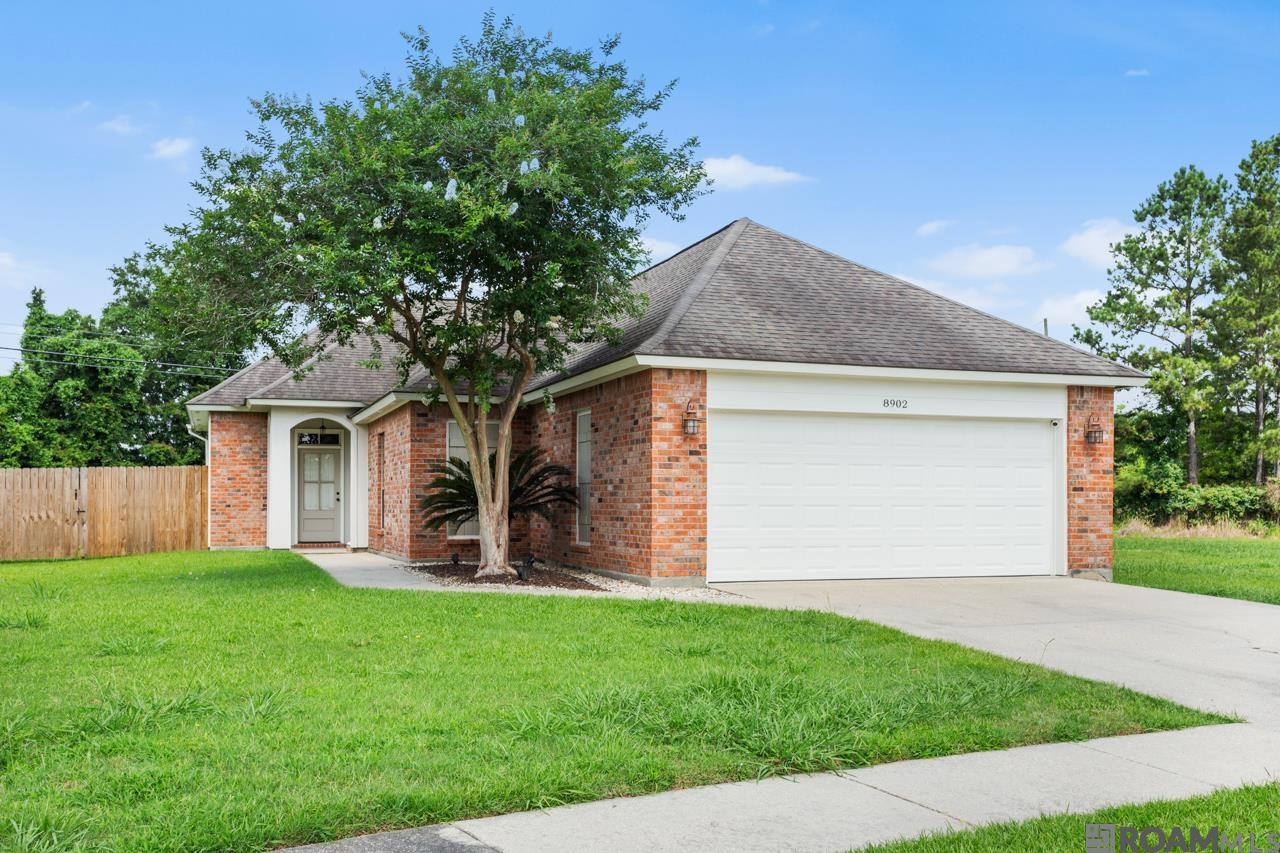
$254,400
3
bds
|
2
ba
|
1,444
sqft
|
built
2006
8902 Westlake Ave, Baton Rouge, LA 70810
$-45
Cash flow
-0.9%
Cash-on-Cash Return
5.5%
Cap rate
0.7%
Rent to Value Ratio
Active
$325,000
4
bds
|
3
ba
|
2,801
sqft
|
built
1979
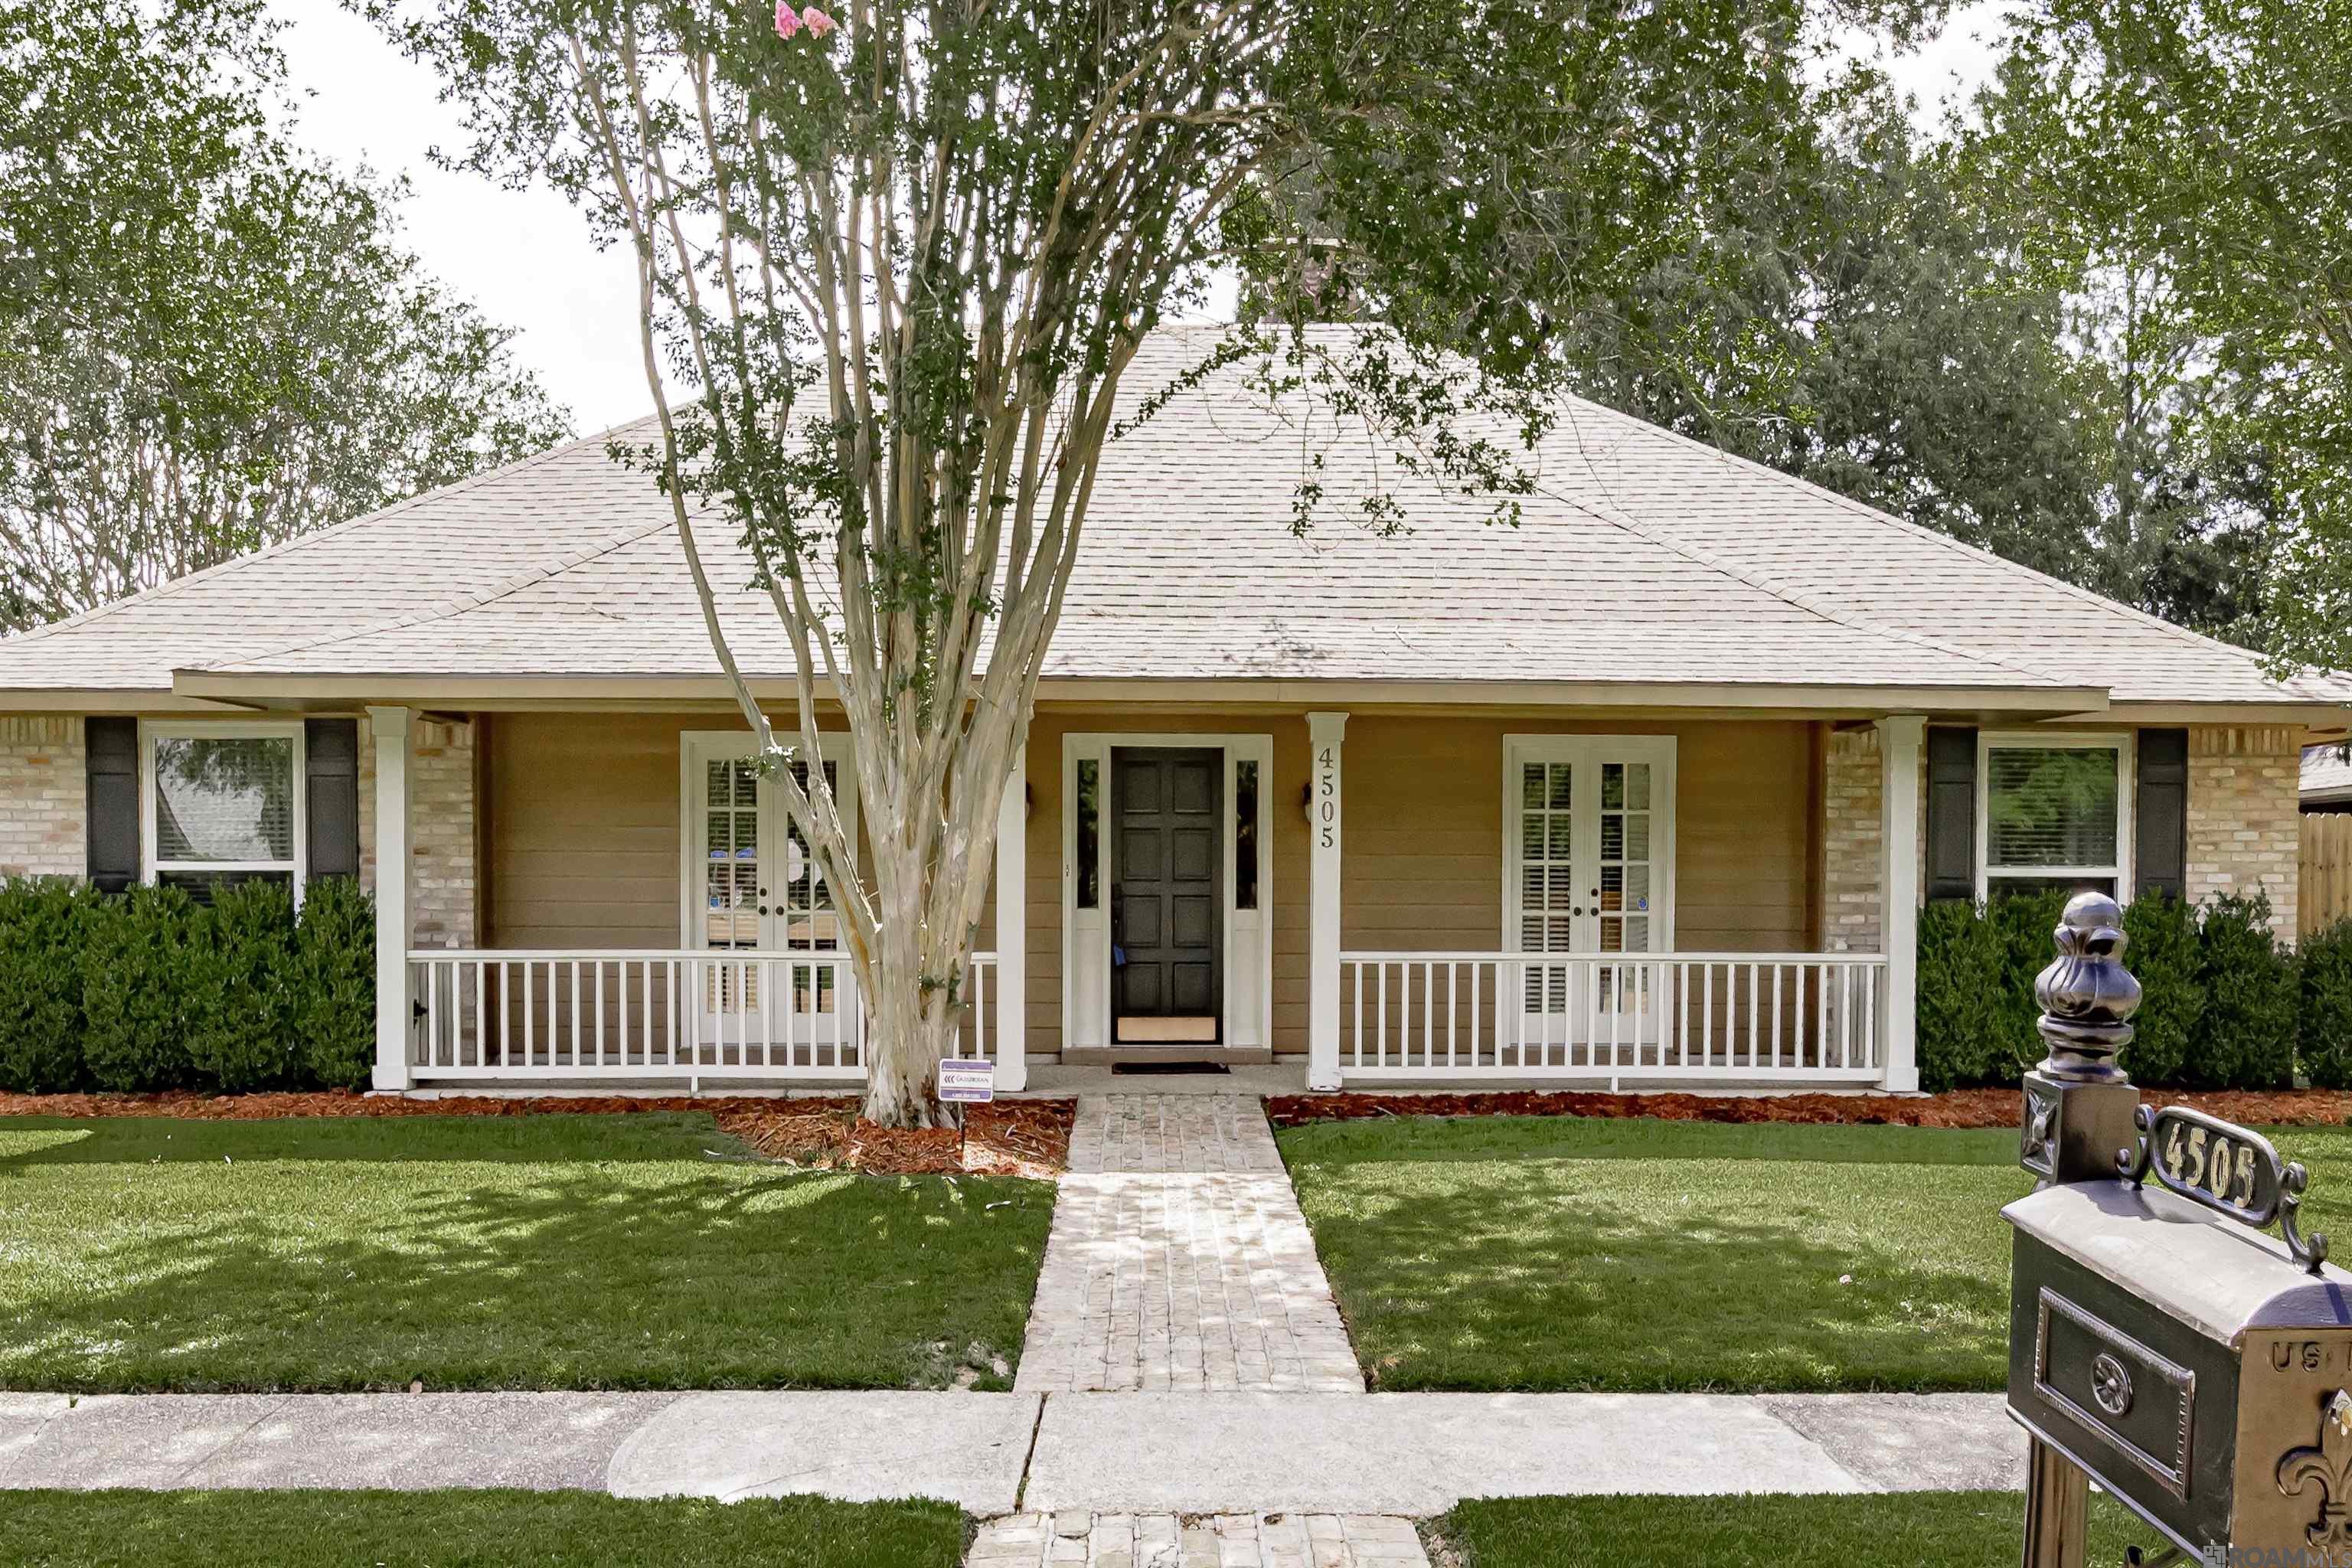
4505 Lake Sherwood Ave E, Baton Rouge, LA 70816
$144
Cash flow
2.3%
Cash-on-Cash Return
6.2%
Cap rate
0.8%
Rent to Value Ratio
Pending
$145,000
3
bds
|
2
ba
|
1,477
sqft
|
built
1983
1514 Sharlo Ave, Baton Rouge, LA 70820
$378
Cash flow
13.6%
Cash-on-Cash Return
8.8%
Cap rate
1.1%
Rent to Value Ratio
Active
$835,000
3
bds
|
2
ba
|
2,970
sqft
|
built
2001
14421 Highland Rd, Baton Rouge, LA 70810
$-846
Cash flow
-5.3%
Cash-on-Cash Return
4.5%
Cap rate
0.5%
Rent to Value Ratio
Active
$12,500
2
bds
|
1
ba
|
700
sqft
|
built
1974
5169 Annette St, Baton Rouge, LA 70805
$759
Cash flow
70.7%
Cash-on-Cash Return
72.9%
Cap rate
8.8%
Rent to Value Ratio
Active
$19,999
3
bds
|
2
ba
|
1,558
sqft
|
built
1970
4723 Madison Ave, Baton Rouge, LA 70802
$828
Cash flow
48.2%
Cash-on-Cash Return
49.7%
Cap rate
6.0%
Rent to Value Ratio
Active
$77,900
4
bds
|
1
ba
|
1,552
sqft
|
built
1983
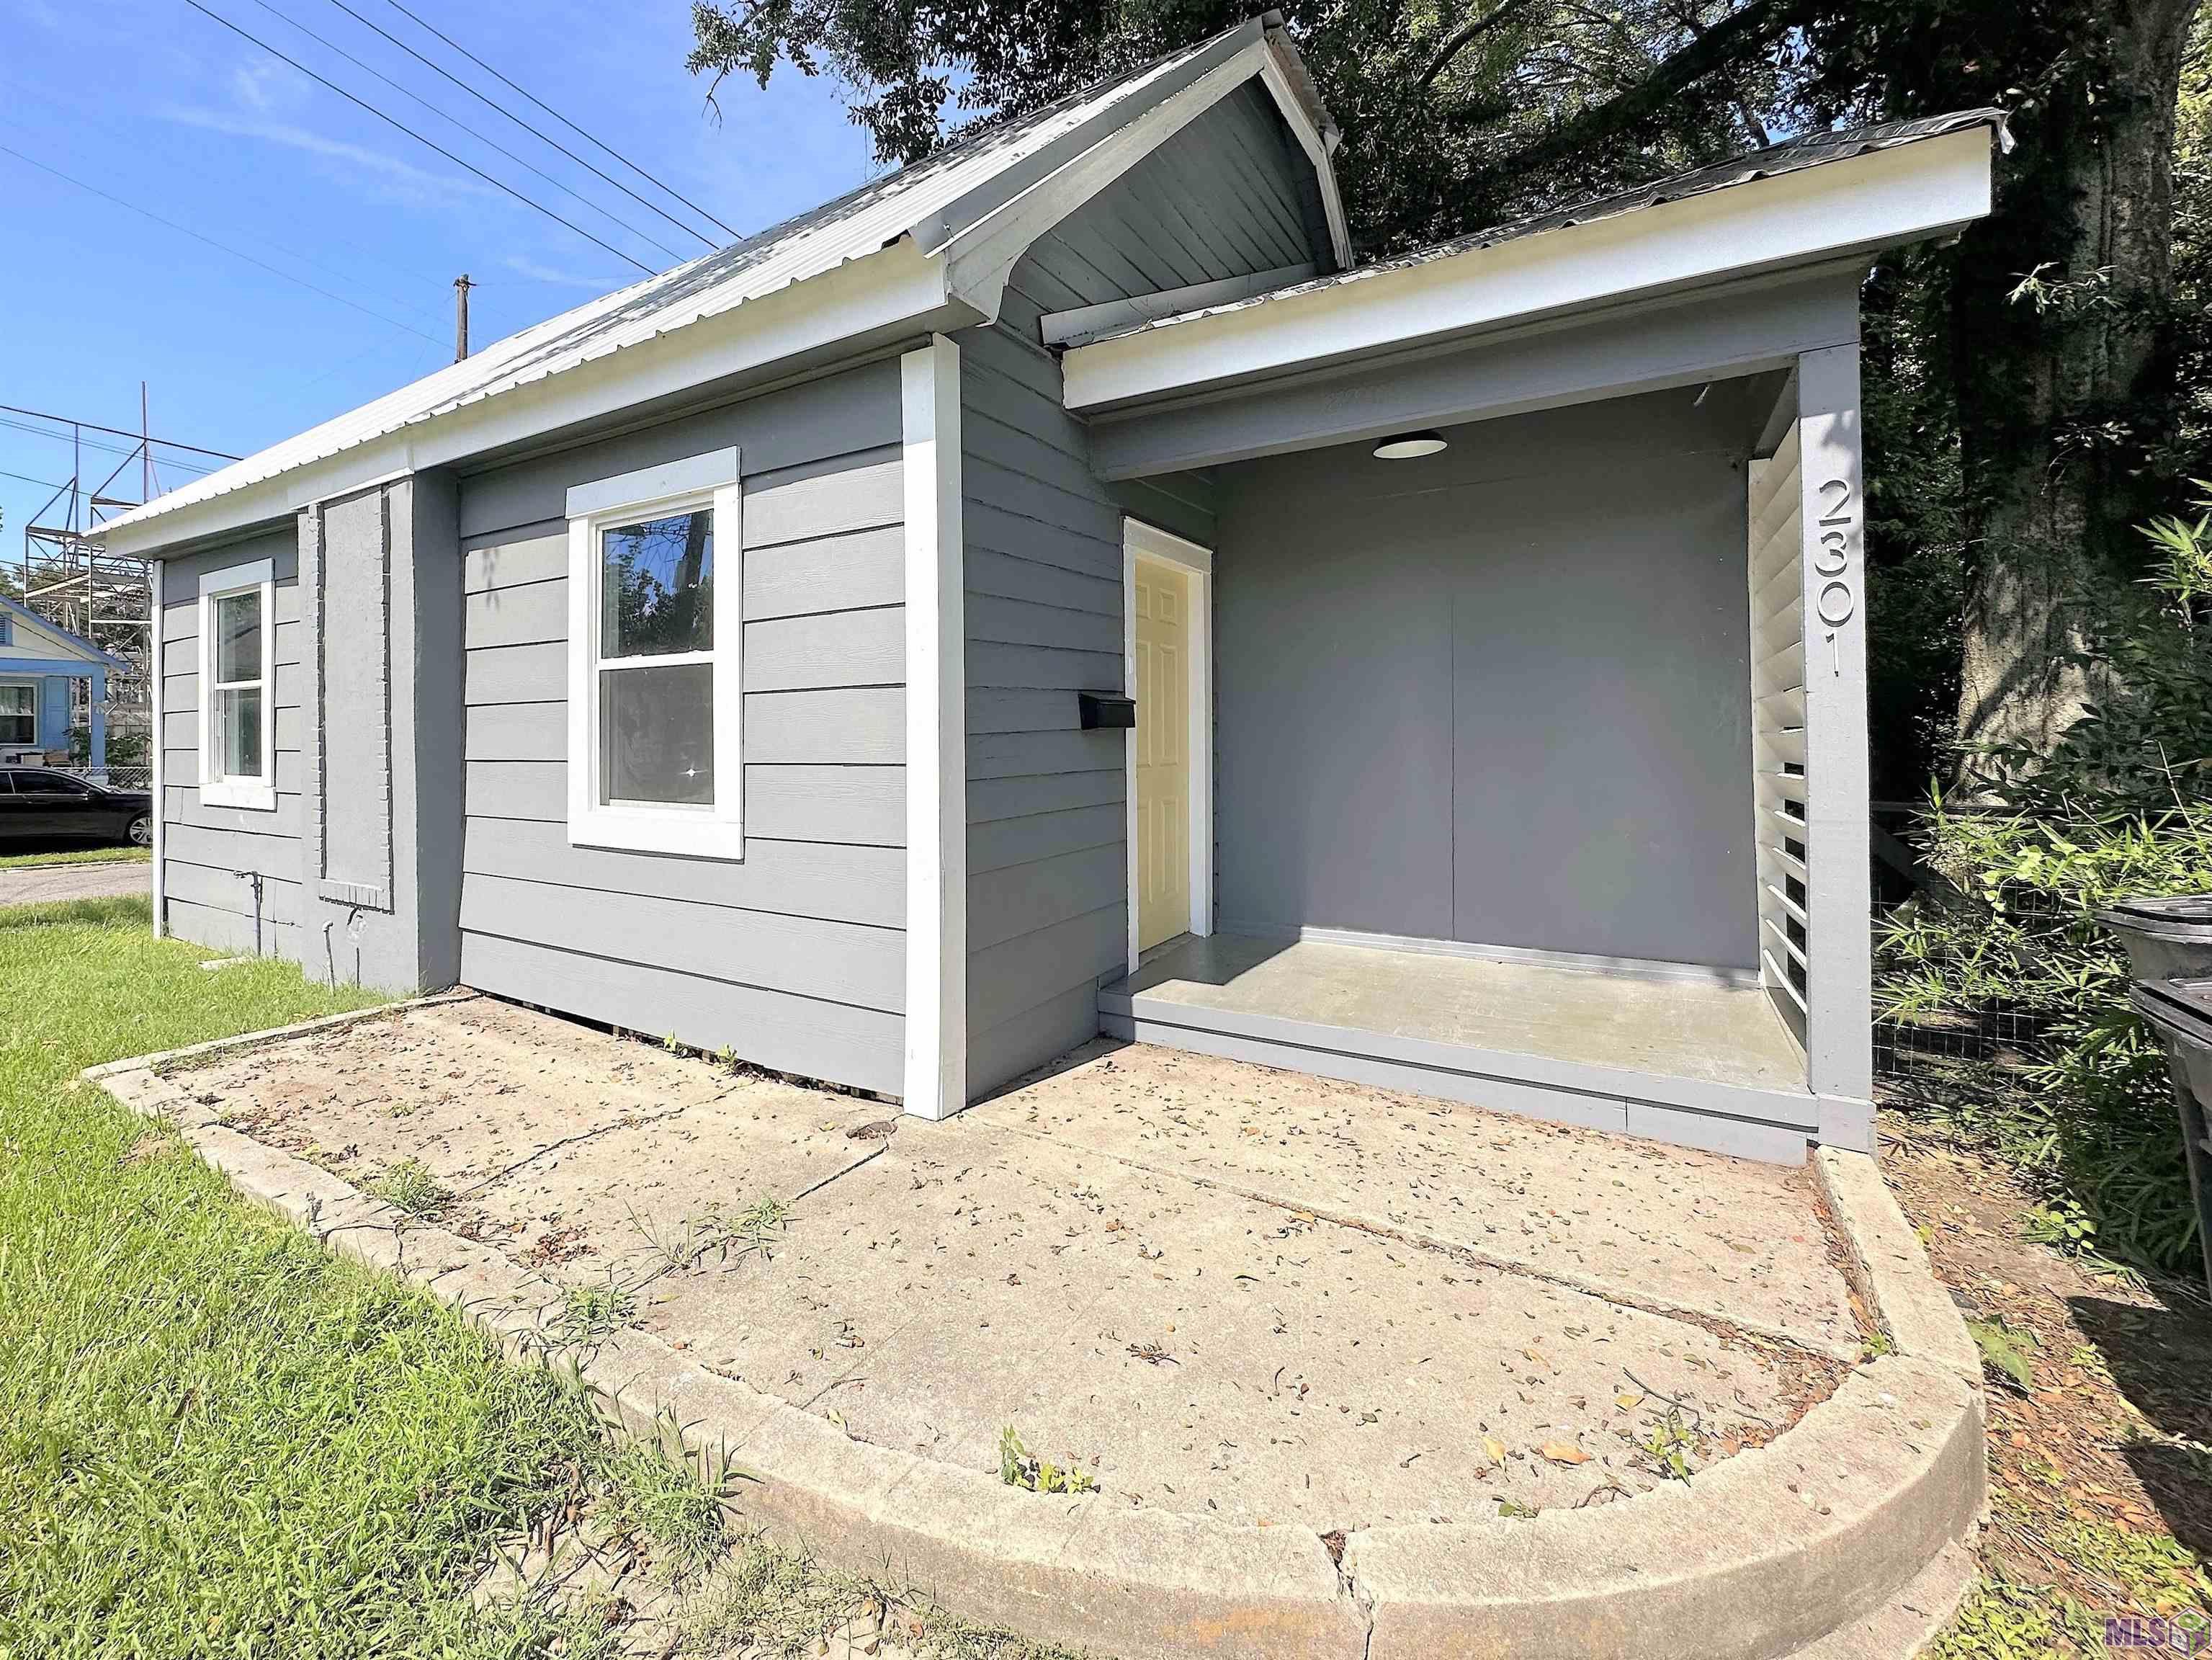
2301 N 20th St, Baton Rouge, LA 70802
$459
Cash flow
30.7%
Cash-on-Cash Return
12.8%
Cap rate
1.5%
Rent to Value Ratio
Active
$75,000
3
bds
|
2
ba
|
1,790
sqft
|
built
1949
2029 Gracie St, Baton Rouge, LA 70802
$404
Cash flow
28.1%
Cash-on-Cash Return
12.1%
Cap rate
1.5%
Rent to Value Ratio
Active
$565,900
3
bds
|
3
ba
|
2,580
sqft
|
built
1992
10037 Ginger Place Dr, Baton Rouge, LA 70817
$-478
Cash flow
-4.4%
Cash-on-Cash Return
4.7%
Cap rate
0.6%
Rent to Value Ratio
Active
$280,000
bds
|
0
ba
|
3,450
sqft
|
built
4726 Earl Gros Ave, Baton Rouge, LA 70820
$-221
Cash flow
-4.1%
Cash-on-Cash Return
4.7%
Cap rate
0.6%
Rent to Value Ratio
Active
$895,000
4
bds
|
4
ba
|
3,376
sqft
|
built
2021
3257 Pointe Marie Dr, Baton Rouge, LA 70820
$-816
Cash flow
-4.8%
Cash-on-Cash Return
4.6%
Cap rate
0.6%
Rent to Value Ratio
Active
$537,400
4
bds
|
3
ba
|
2,260
sqft
|
built
2021
14238 Haile Way, Baton Rouge, LA 70817
$-475
Cash flow
-4.6%
Cash-on-Cash Return
4.6%
Cap rate
0.6%
Rent to Value Ratio
Active
$305,000
4
bds
|
3
ba
|
2,586
sqft
|
built
1978
10218 N Magna Carta Pl, Baton Rouge, LA 70815
$-403
Cash flow
-6.9%
Cash-on-Cash Return
4.1%
Cap rate
0.7%
Rent to Value Ratio

Active
$1,075,000
4
bds
|
4
ba
|
3,809
sqft
|
built
1991
17627 Masters Pointe Ct, Baton Rouge, LA 70810
$-1,835
Cash flow
-8.9%
Cash-on-Cash Return
3.6%
Cap rate
0.5%
Rent to Value Ratio

Active
$45,000
2
bds
|
1
ba
|
781
sqft
|
built
1975
3339 Wenonah St, Baton Rouge, LA 70805
$552
Cash flow
14.3%
Cash-on-Cash Return
14.7%
Cap rate
1.8%
Rent to Value Ratio
Active
$228,000
3
bds
|
2
ba
|
1,741
sqft
|
built
1969
3923 Aletha Dr, Baton Rouge, LA 70814
$439
Cash flow
10.0%
Cash-on-Cash Return
8.0%
Cap rate
1.0%
Rent to Value Ratio
Active
$143,000
3
bds
|
1
ba
|
1,412
sqft
|
built
1954
2635 79th Ave, Baton Rouge, LA 70807
$427
Cash flow
15.6%
Cash-on-Cash Return
9.3%
Cap rate
1.1%
Rent to Value Ratio
Active
$144,800
3
bds
|
2
ba
|
1,570
sqft
|
built
1970
2731 Michelli Dr, Baton Rouge, LA 70805
$419
Cash flow
15.1%
Cash-on-Cash Return
9.1%
Cap rate
1.1%
Rent to Value Ratio
Active
$532,500
3
bds
|
2
ba
|
2,041
sqft
|
built
2022
3064 Pointe Marie Dr, Baton Rouge, LA 70820
$-205
Cash flow
-2.0%
Cash-on-Cash Return
5.2%
Cap rate
0.7%
Rent to Value Ratio