Baton Rouge, LA Investment Properties for Sale
Browse homes for sale and investment properties in Baton Rouge, LA. Refine your search by price, property type, or more.
Best cash flowing properties in Baton Rouge, LA
Active
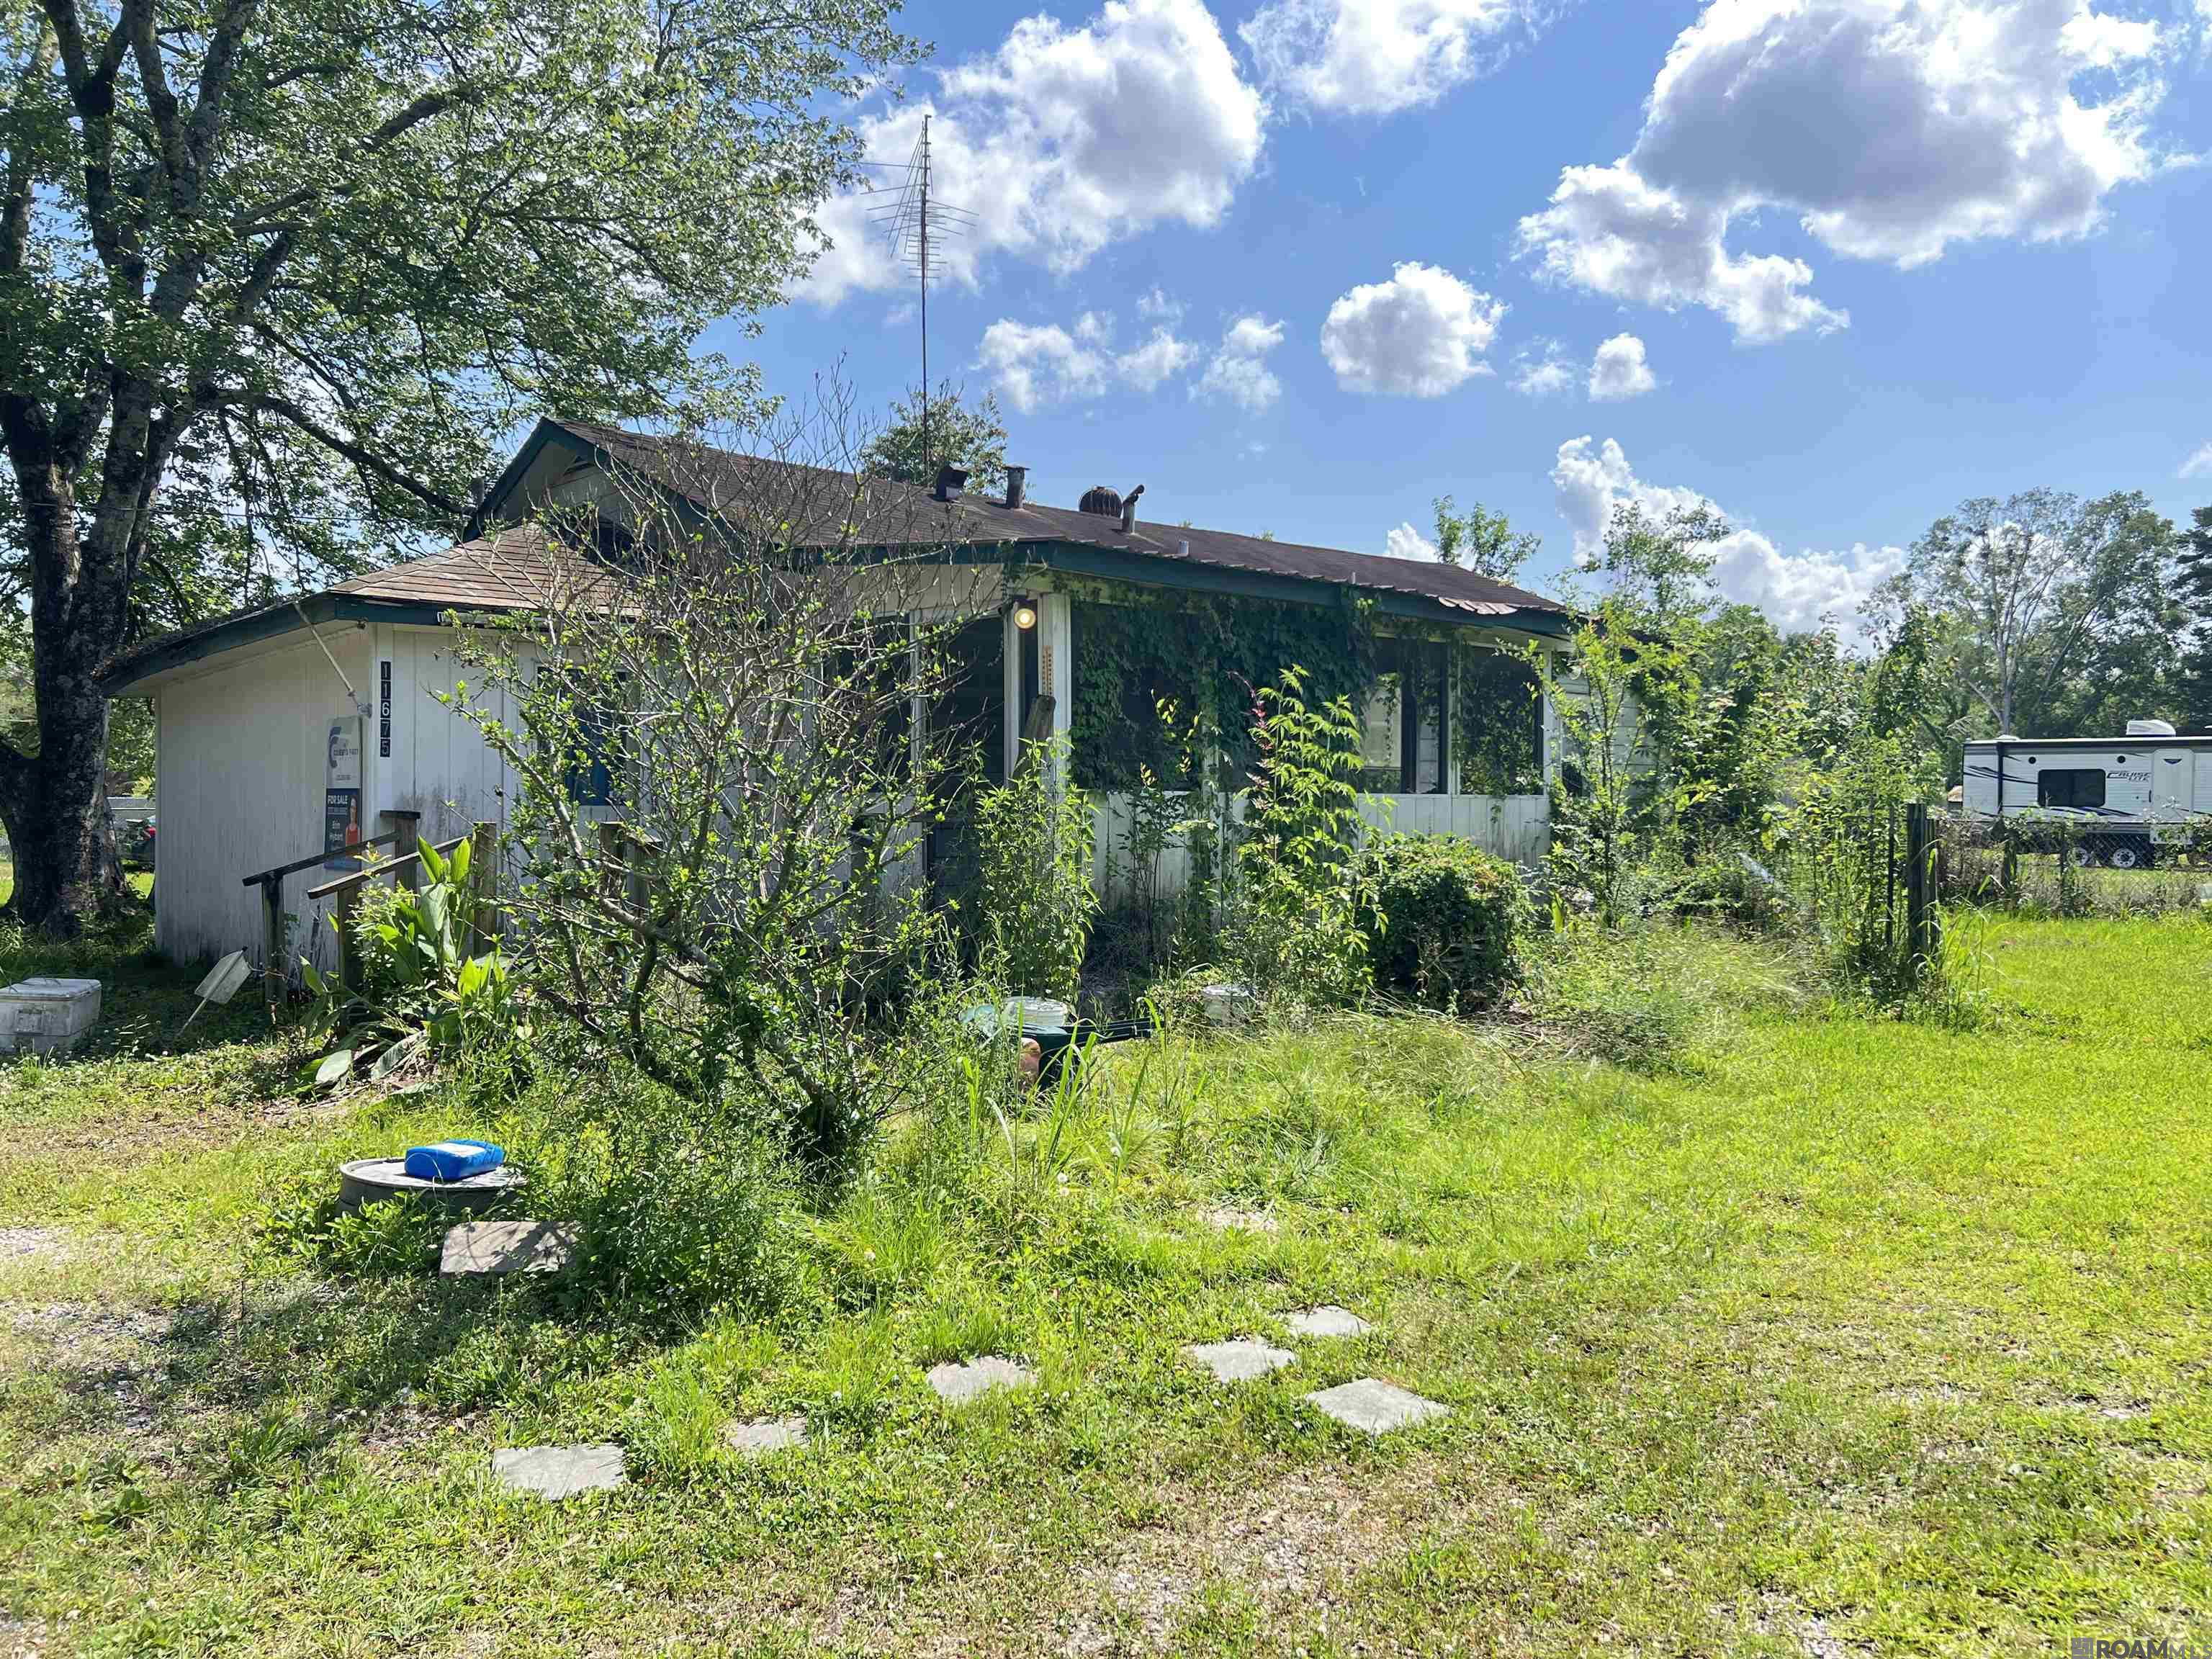
$49,990
2
bds
|
1
ba
|
830
sqft
|
built
1975
11675 Ellen Dr, Baton Rouge, LA 70811
$897
Cash flow
20.9%
Cash-on-Cash Return
21.5%
Cap rate
2.6%
Rent to Value Ratio
Active
$85,500
4
bds
|
2
ba
|
1,795
sqft
|
built
1971
3725 Winbourne Ave, Baton Rouge, LA 70805
$518
Cash flow
31.6%
Cash-on-Cash Return
13.6%
Cap rate
1.6%
Rent to Value Ratio
986 out of 1,271 properties for sale in Baton Rouge, LA
Limited Results Shown
Create a free account, or log in to reveal all property listings and enjoy the complete experience.
Active
$299,500
3
bds
|
2
ba
|
1,894
sqft
|
built
1975
2413 Guilford Dr, Baton Rouge, LA 70808
$-188
Cash flow
-3.3%
Cash-on-Cash Return
5.5%
Cap rate
0.7%
Rent to Value Ratio
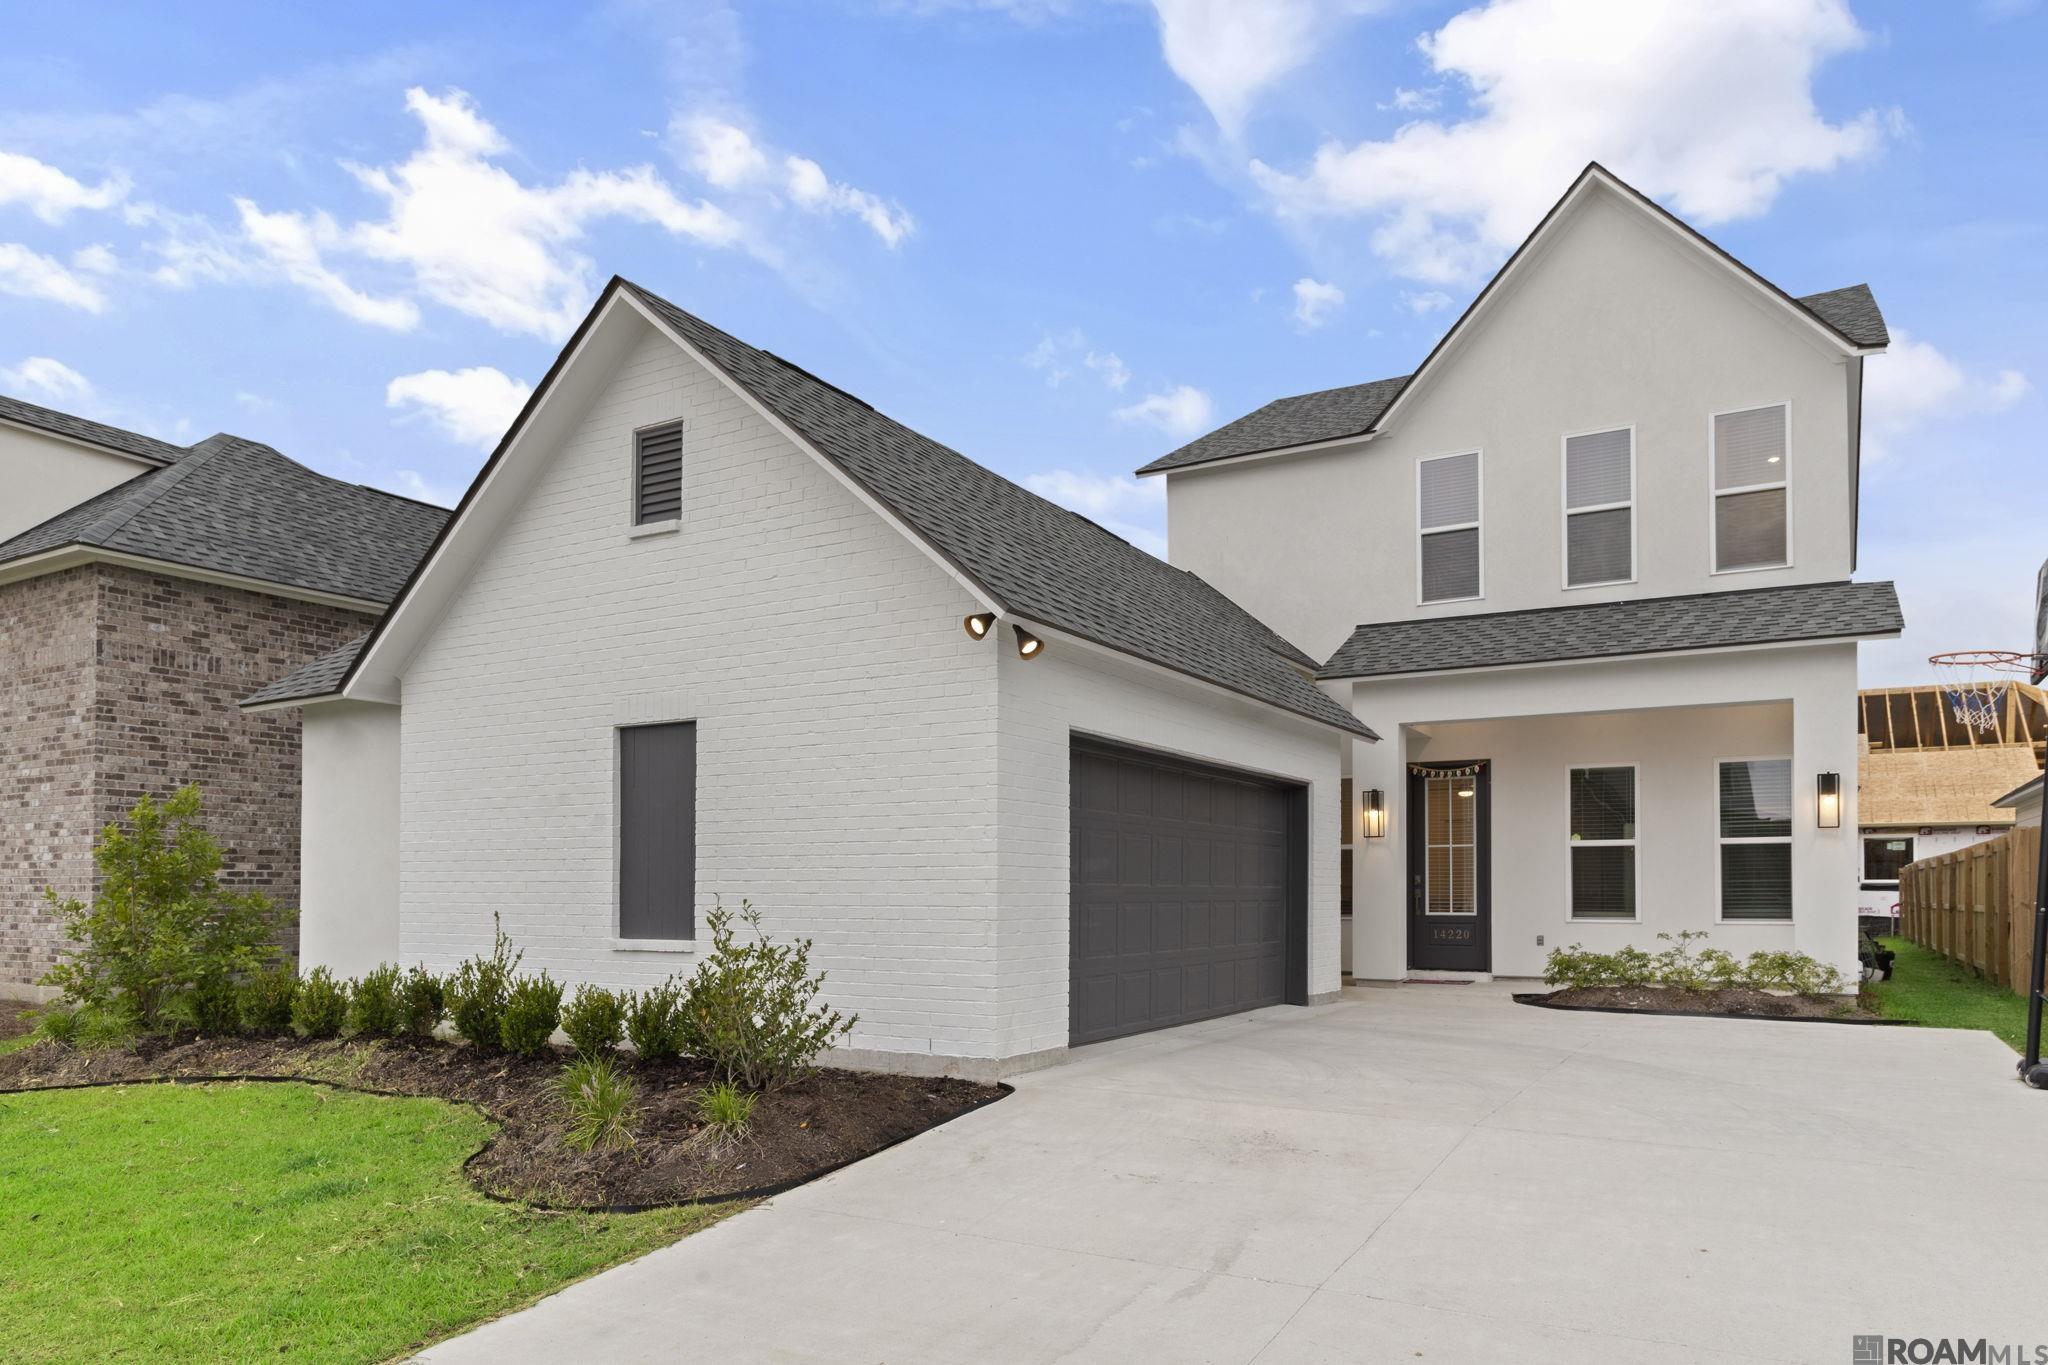
Active
$449,999
5
bds
|
3
ba
|
2,793
sqft
|
built
2024
14220 Wally Way, Baton Rouge, LA 70810
$-1,267
Cash flow
-14.7%
Cash-on-Cash Return
2.9%
Cap rate
0.4%
Rent to Value Ratio
Active
$320,000
3
bds
|
3
ba
|
1,987
sqft
|
built
1979
16724 Shady Arbor Ln, Baton Rouge, LA 70817
$-166
Cash flow
-2.7%
Cash-on-Cash Return
5.7%
Cap rate
0.7%
Rent to Value Ratio
Active
$2,075,000
5
bds
|
6
ba
|
6,028
sqft
|
built
2018
1958 Ingleside Dr, Baton Rouge, LA 70808
$-5,898
Cash flow
-14.8%
Cash-on-Cash Return
2.9%
Cap rate
0.3%
Rent to Value Ratio
Active
$370,000
3
bds
|
2
ba
|
2,294
sqft
|
built
1999
18733 W Lake Terrace Dr, Baton Rouge, LA 70817
$-433
Cash flow
-6.1%
Cash-on-Cash Return
4.9%
Cap rate
0.6%
Rent to Value Ratio
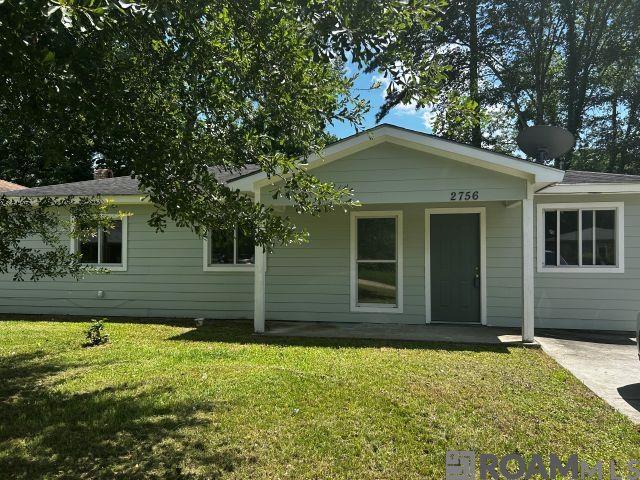
Active
$155,000
4
bds
|
2
ba
|
1,220
sqft
|
built
1976
2756 74th Ave, Baton Rouge, LA 70807
$223
Cash flow
7.5%
Cash-on-Cash Return
8.0%
Cap rate
1.0%
Rent to Value Ratio
Active
$135,000
2
bds
|
6
ba
|
1,000
sqft
|
built
1980
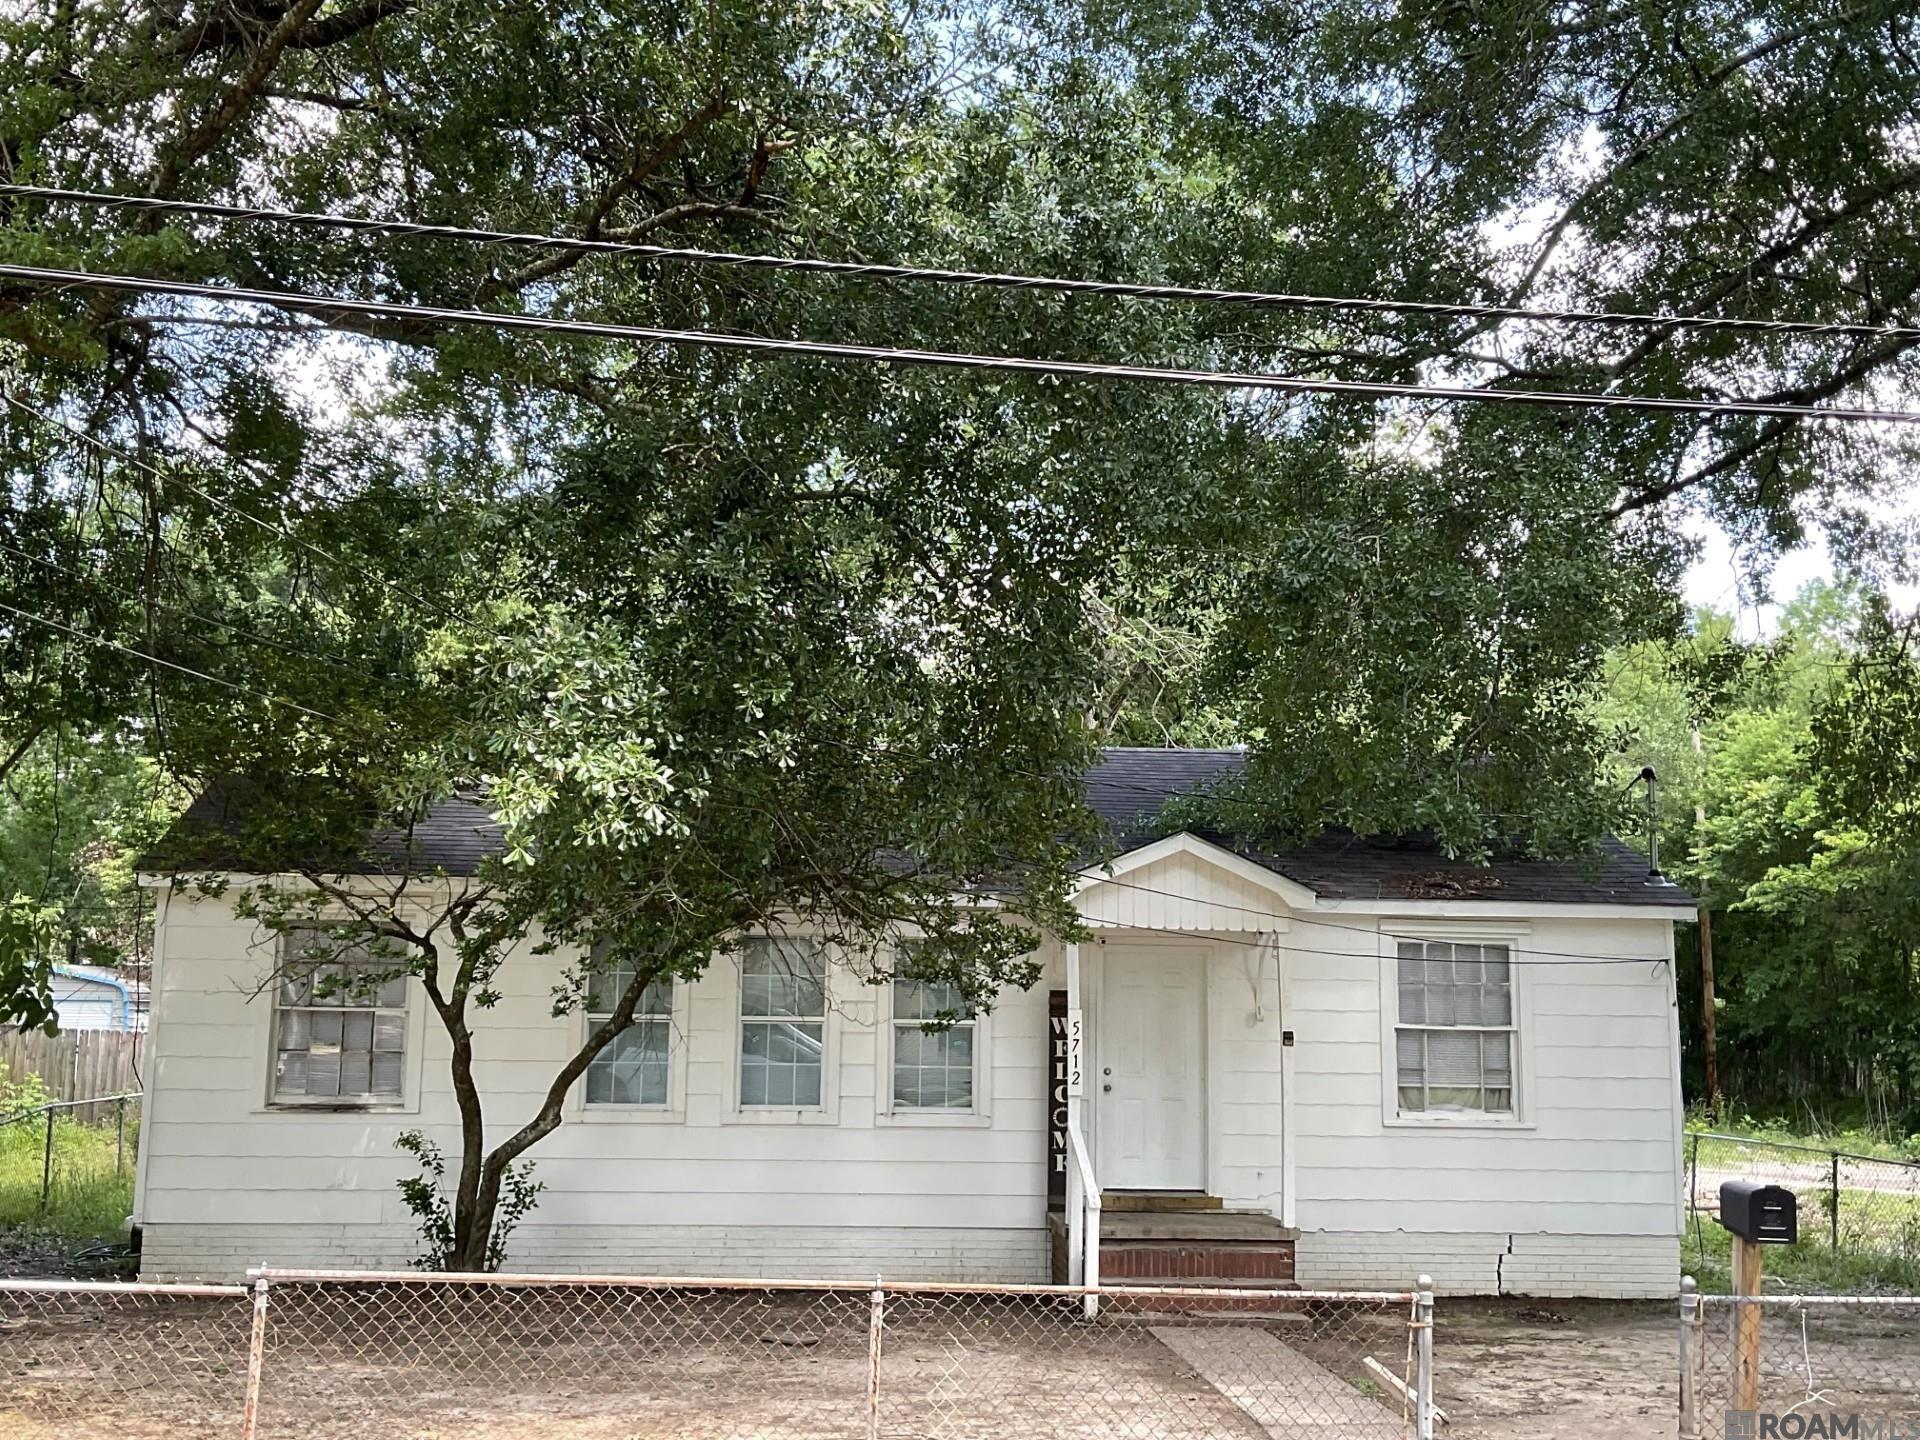
5736 Beechwood Dr, Baton Rouge, LA 70805
$121
Cash flow
4.7%
Cash-on-Cash Return
7.4%
Cap rate
0.9%
Rent to Value Ratio
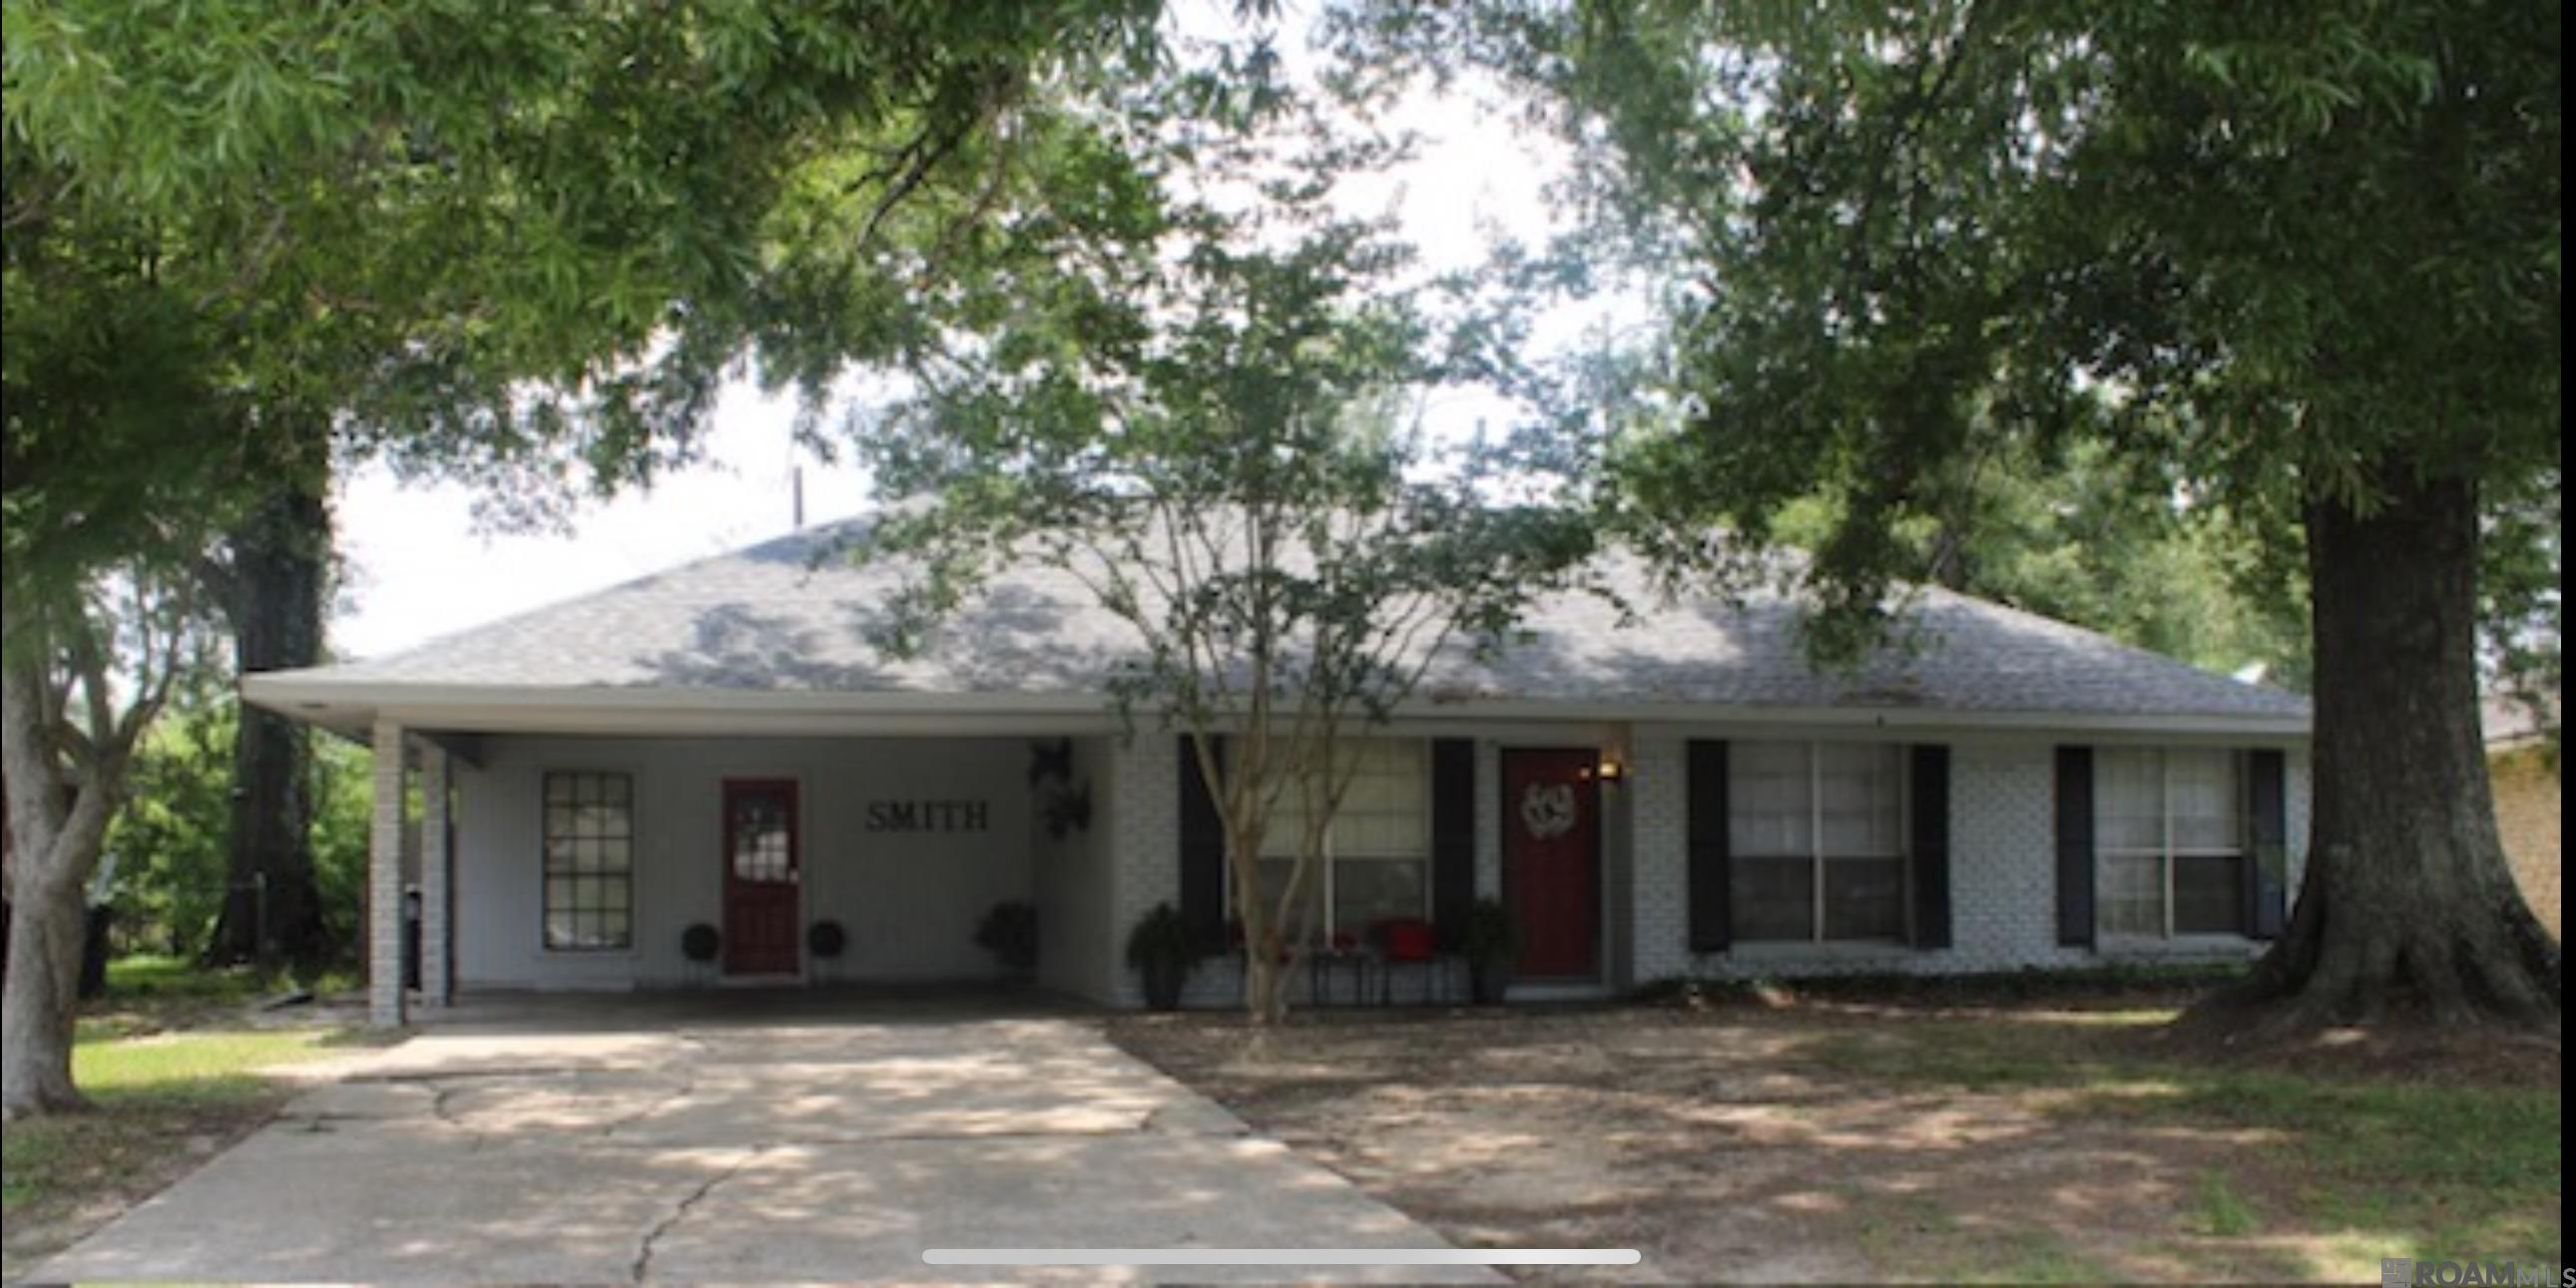
Active
$225,000
3
bds
|
2
ba
|
1,636
sqft
|
built
1974
308 Laurie Lynn Dr, Baton Rouge, LA 70819
$202
Cash flow
4.7%
Cash-on-Cash Return
7.4%
Cap rate
0.9%
Rent to Value Ratio
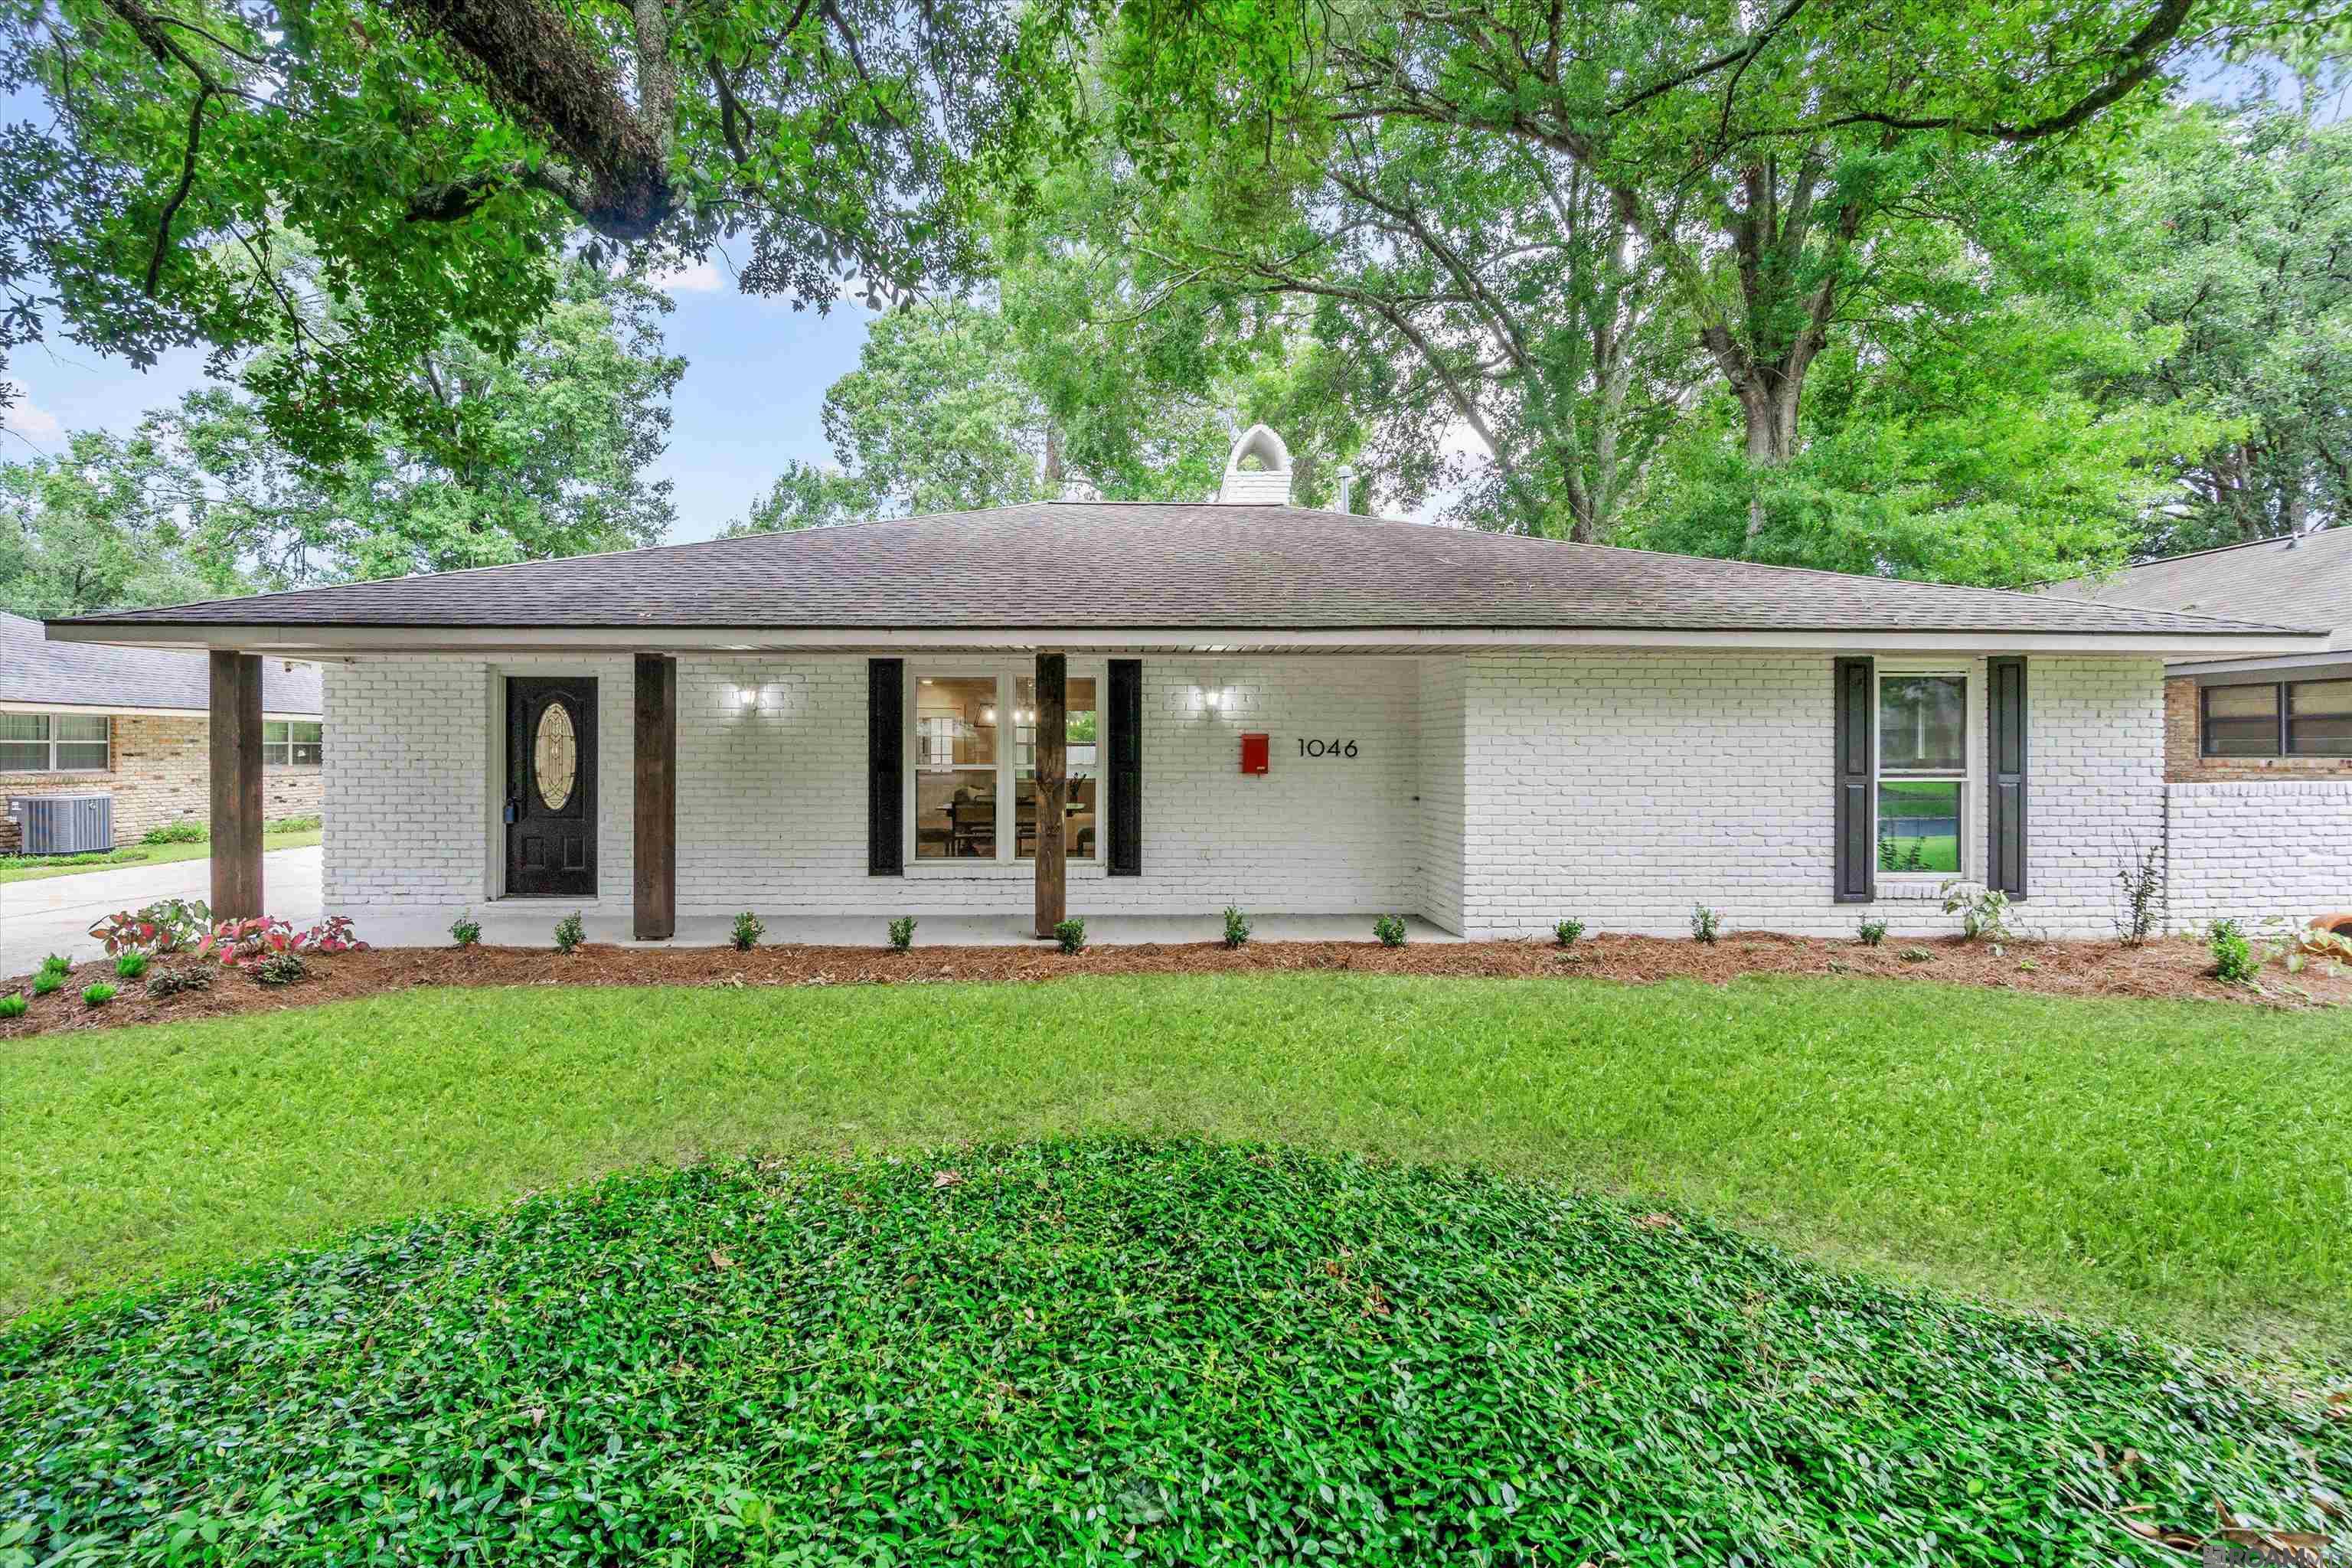
Active
$369,000
4
bds
|
2
ba
|
2,063
sqft
|
built
1970
1046 Colonial Dr, Baton Rouge, LA 70806
$0
Cash flow
0.0%
Cash-on-Cash Return
6.3%
Cap rate
0.8%
Rent to Value Ratio
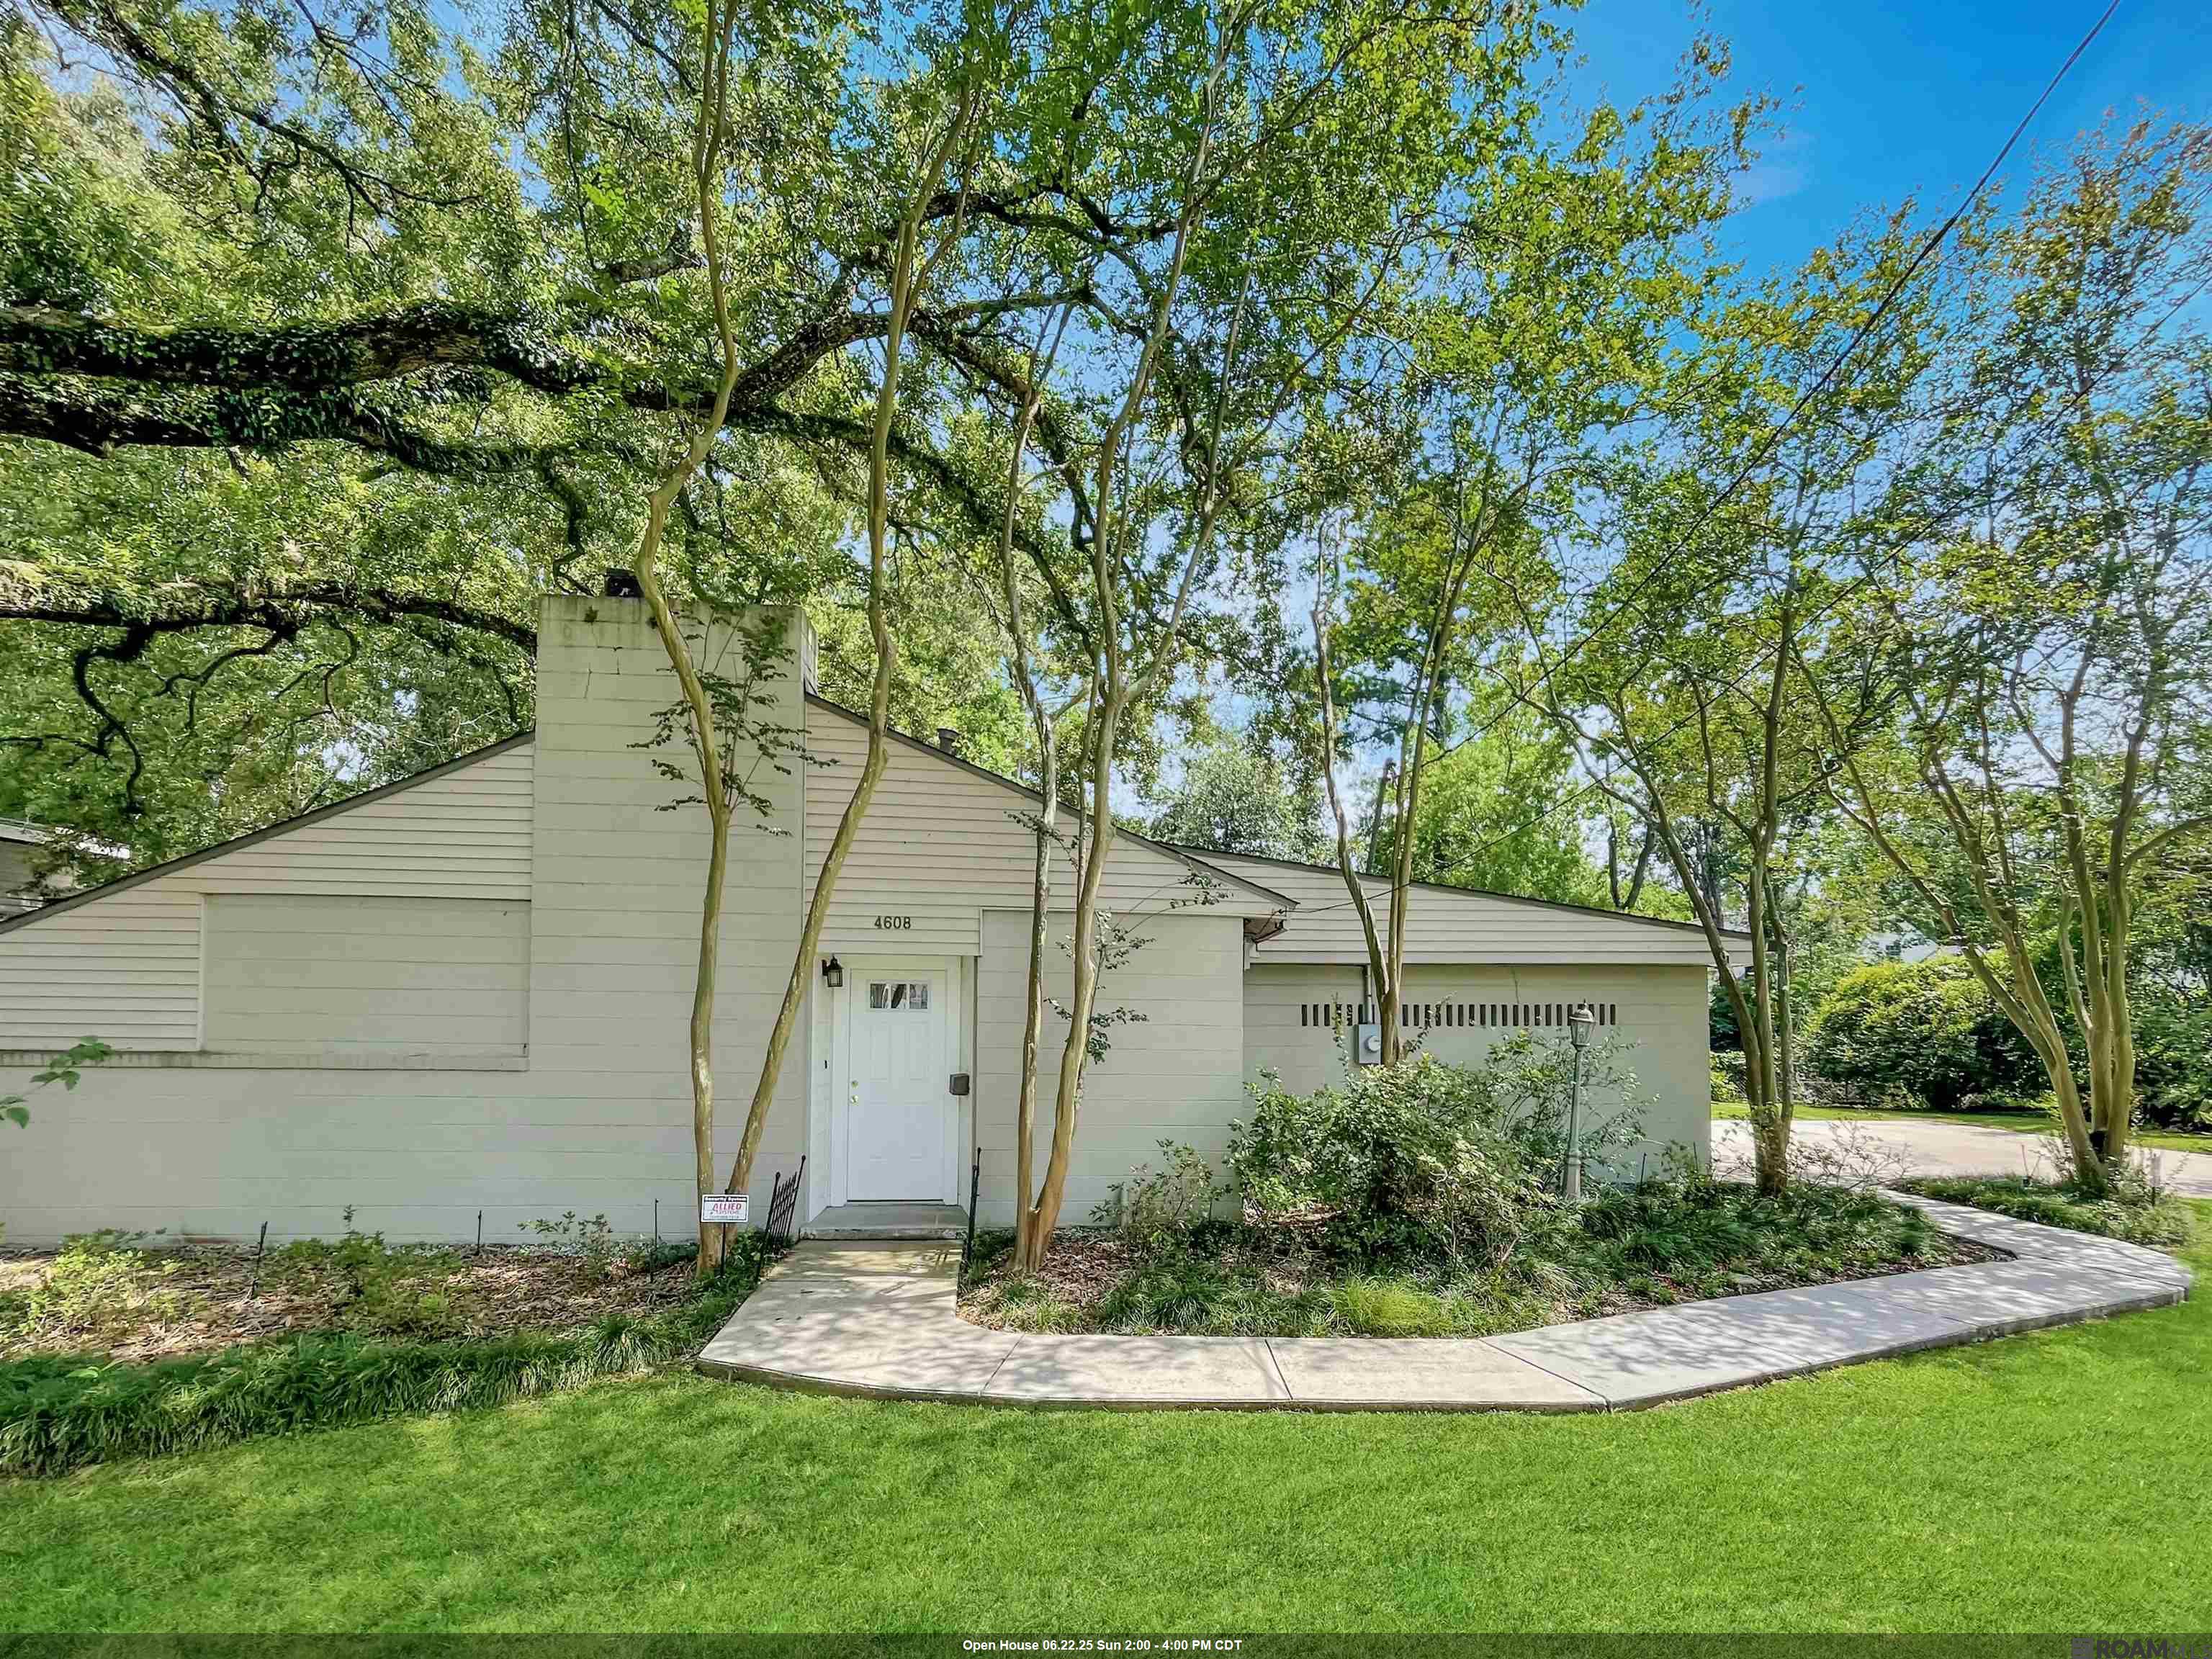
Active
$299,000
2
bds
|
2
ba
|
1,247
sqft
|
built
1956
4608 Capital Heights Ave, Baton Rouge, LA 70806
$-462
Cash flow
-8.1%
Cash-on-Cash Return
4.4%
Cap rate
0.5%
Rent to Value Ratio
Pending
$215,000
3
bds
|
2
ba
|
1,731
sqft
|
built
1974
7419 Oakmount Dr, Baton Rouge, LA 70817
$233
Cash flow
5.7%
Cash-on-Cash Return
7.6%
Cap rate
0.9%
Rent to Value Ratio
Active
$85,500
4
bds
|
2
ba
|
1,795
sqft
|
built
1971
3725 Winbourne Ave, Baton Rouge, LA 70805
$518
Cash flow
31.6%
Cash-on-Cash Return
13.6%
Cap rate
1.6%
Rent to Value Ratio

Active
$319,000
3
bds
|
2
ba
|
1,872
sqft
|
built
1998
18315 Lake Myrtle Dr, Baton Rouge, LA 70817
$-97
Cash flow
-1.6%
Cash-on-Cash Return
5.9%
Cap rate
0.7%
Rent to Value Ratio
Active
$945,000
4
bds
|
4
ba
|
3,642
sqft
|
built
2006
19452 Oak Park Ct, Baton Rouge, LA 70809
$-2,515
Cash flow
-13.9%
Cash-on-Cash Return
3.1%
Cap rate
0.4%
Rent to Value Ratio
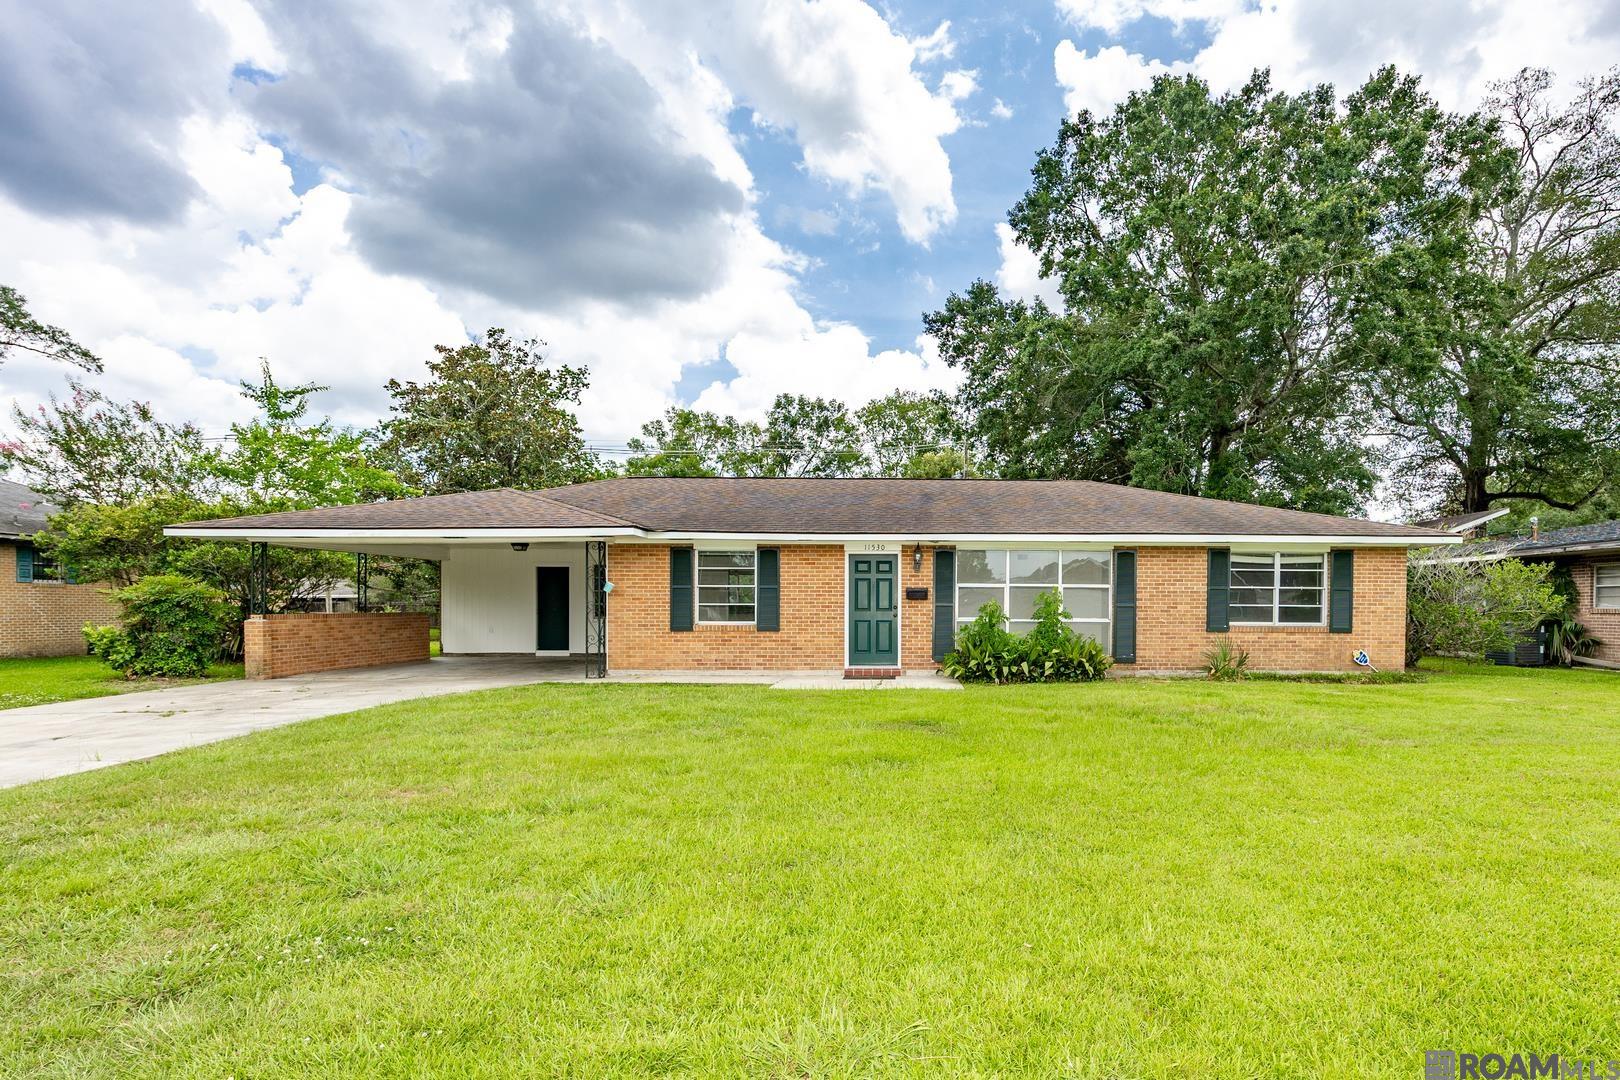
Pending
$199,000
3
bds
|
2
ba
|
1,702
sqft
|
built
1958
11530 Archery Dr, Baton Rouge, LA 70815
$62
Cash flow
1.6%
Cash-on-Cash Return
6.7%
Cap rate
0.8%
Rent to Value Ratio
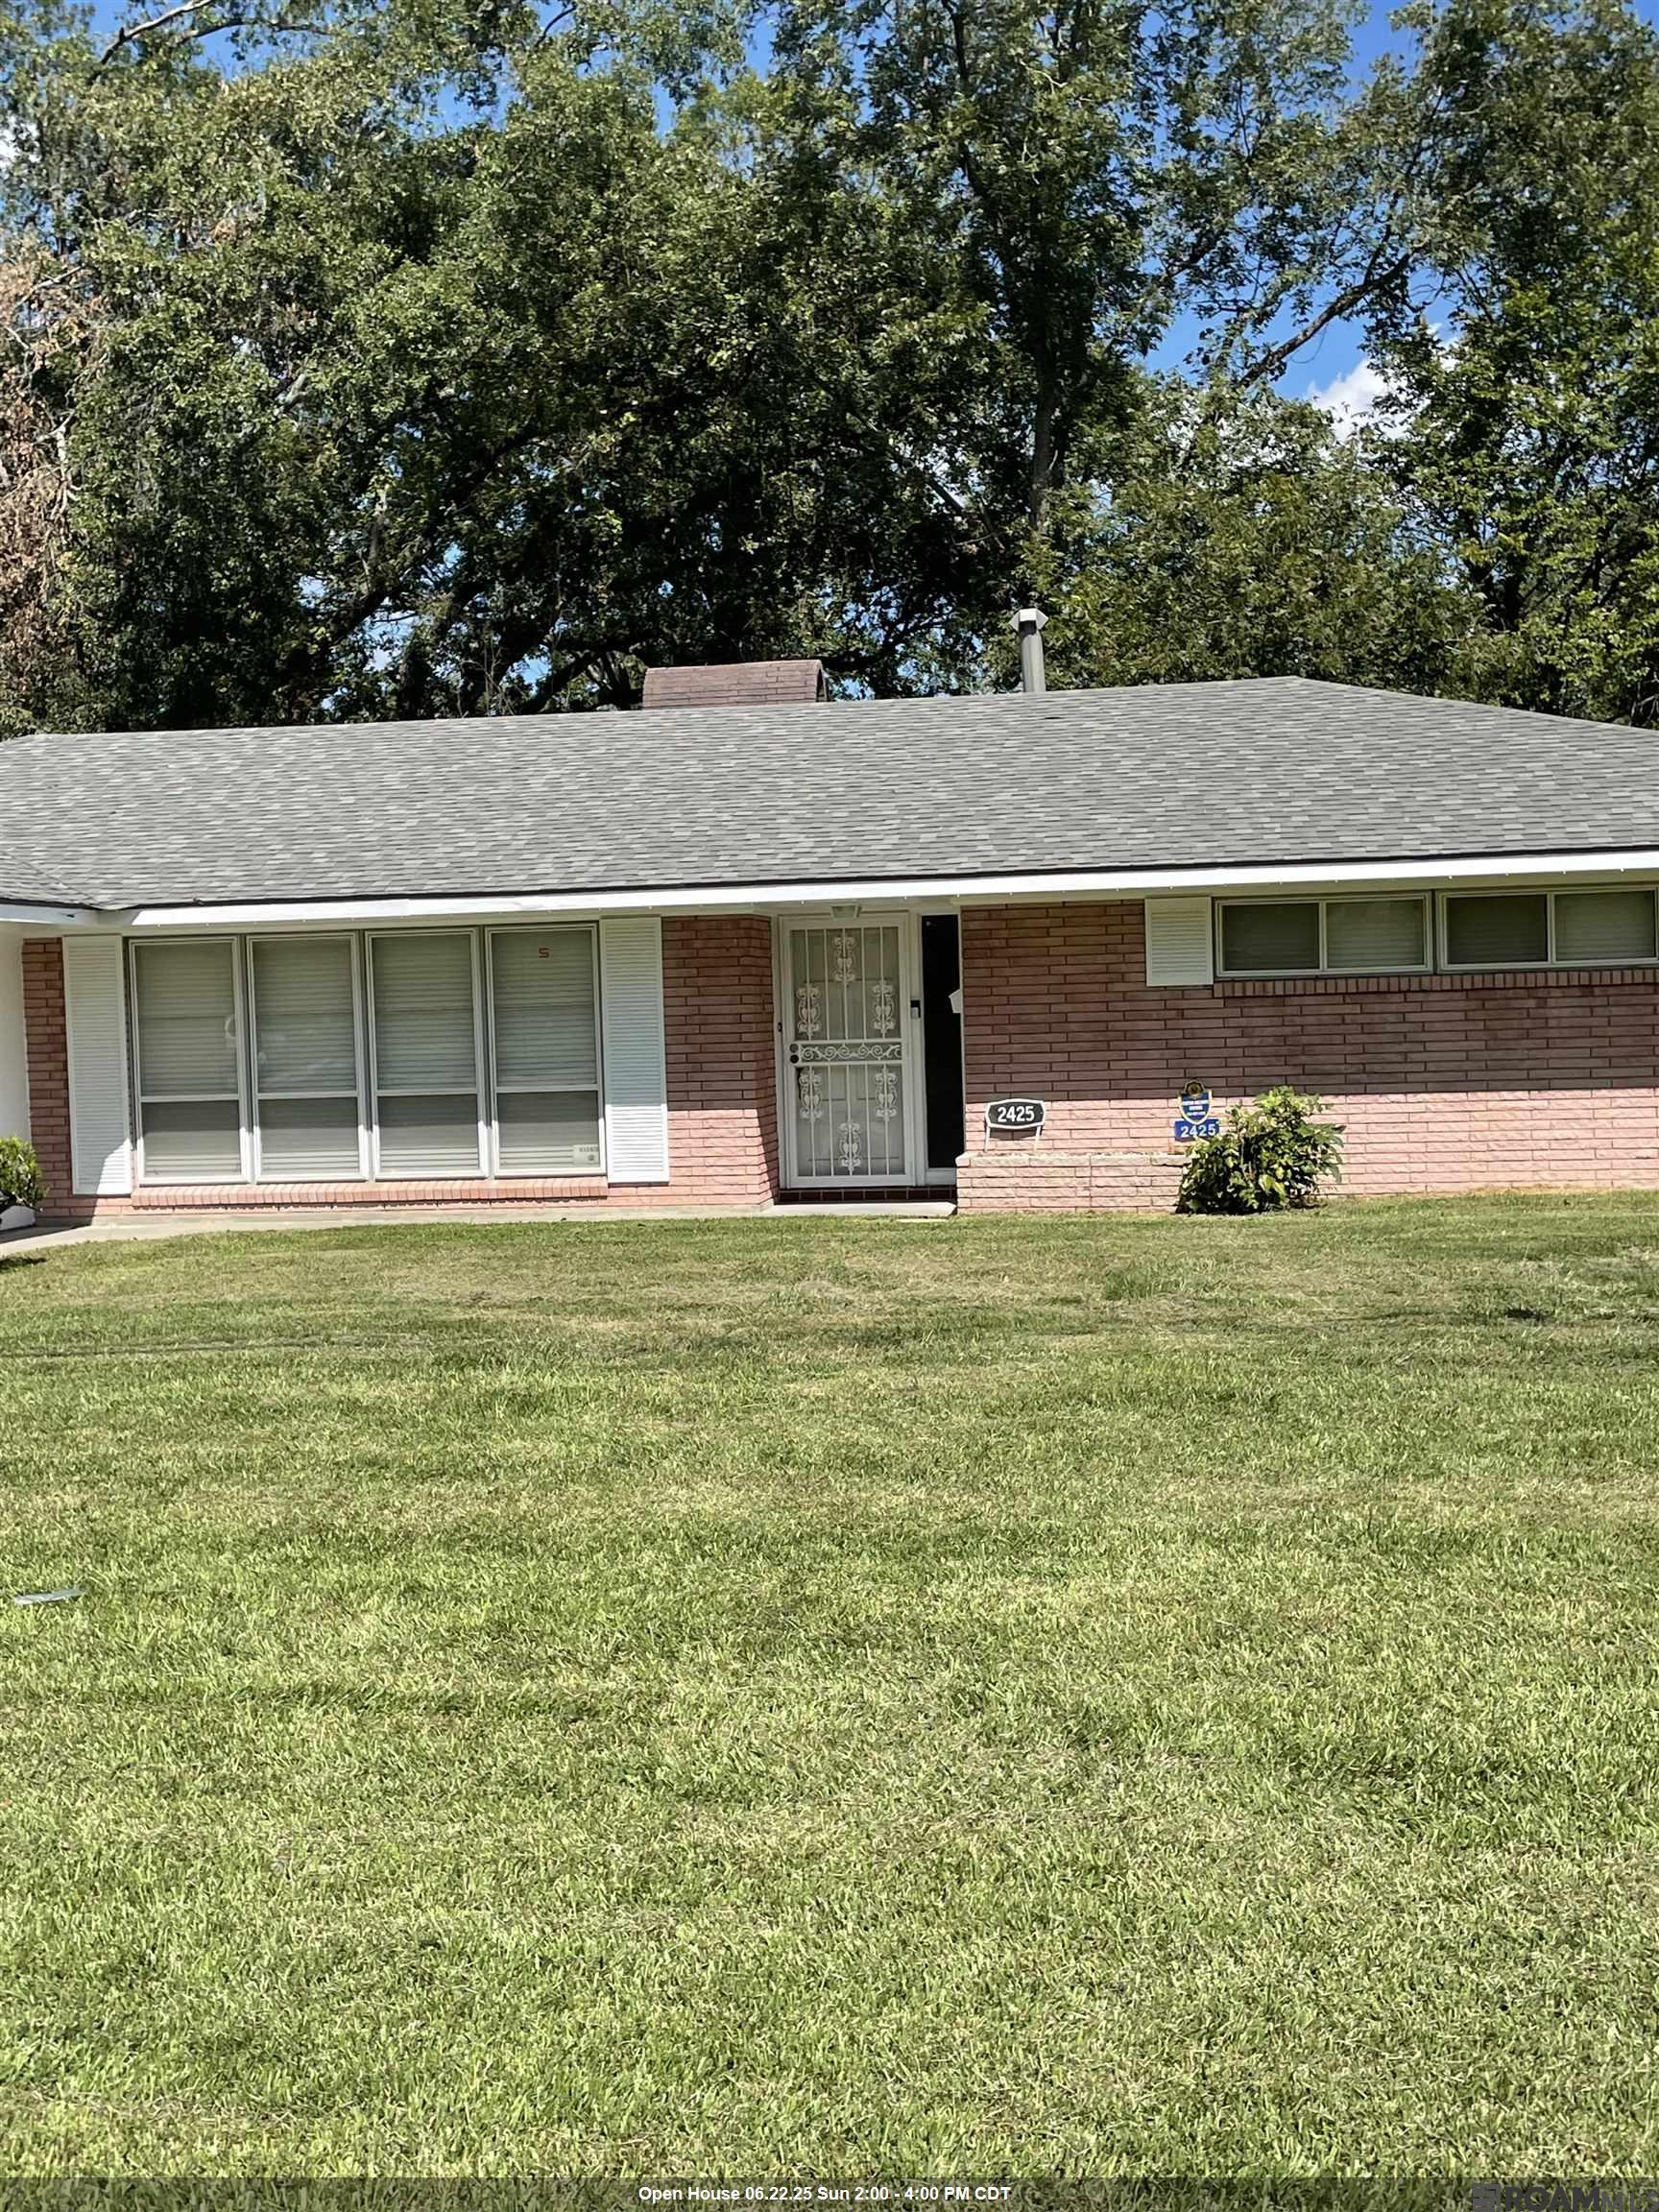
Active
$220,000
3
bds
|
3
ba
|
2,494
sqft
|
built
1960
2425 Harding Blvd, Baton Rouge, LA 70807
$228
Cash flow
5.4%
Cash-on-Cash Return
7.5%
Cap rate
0.9%
Rent to Value Ratio
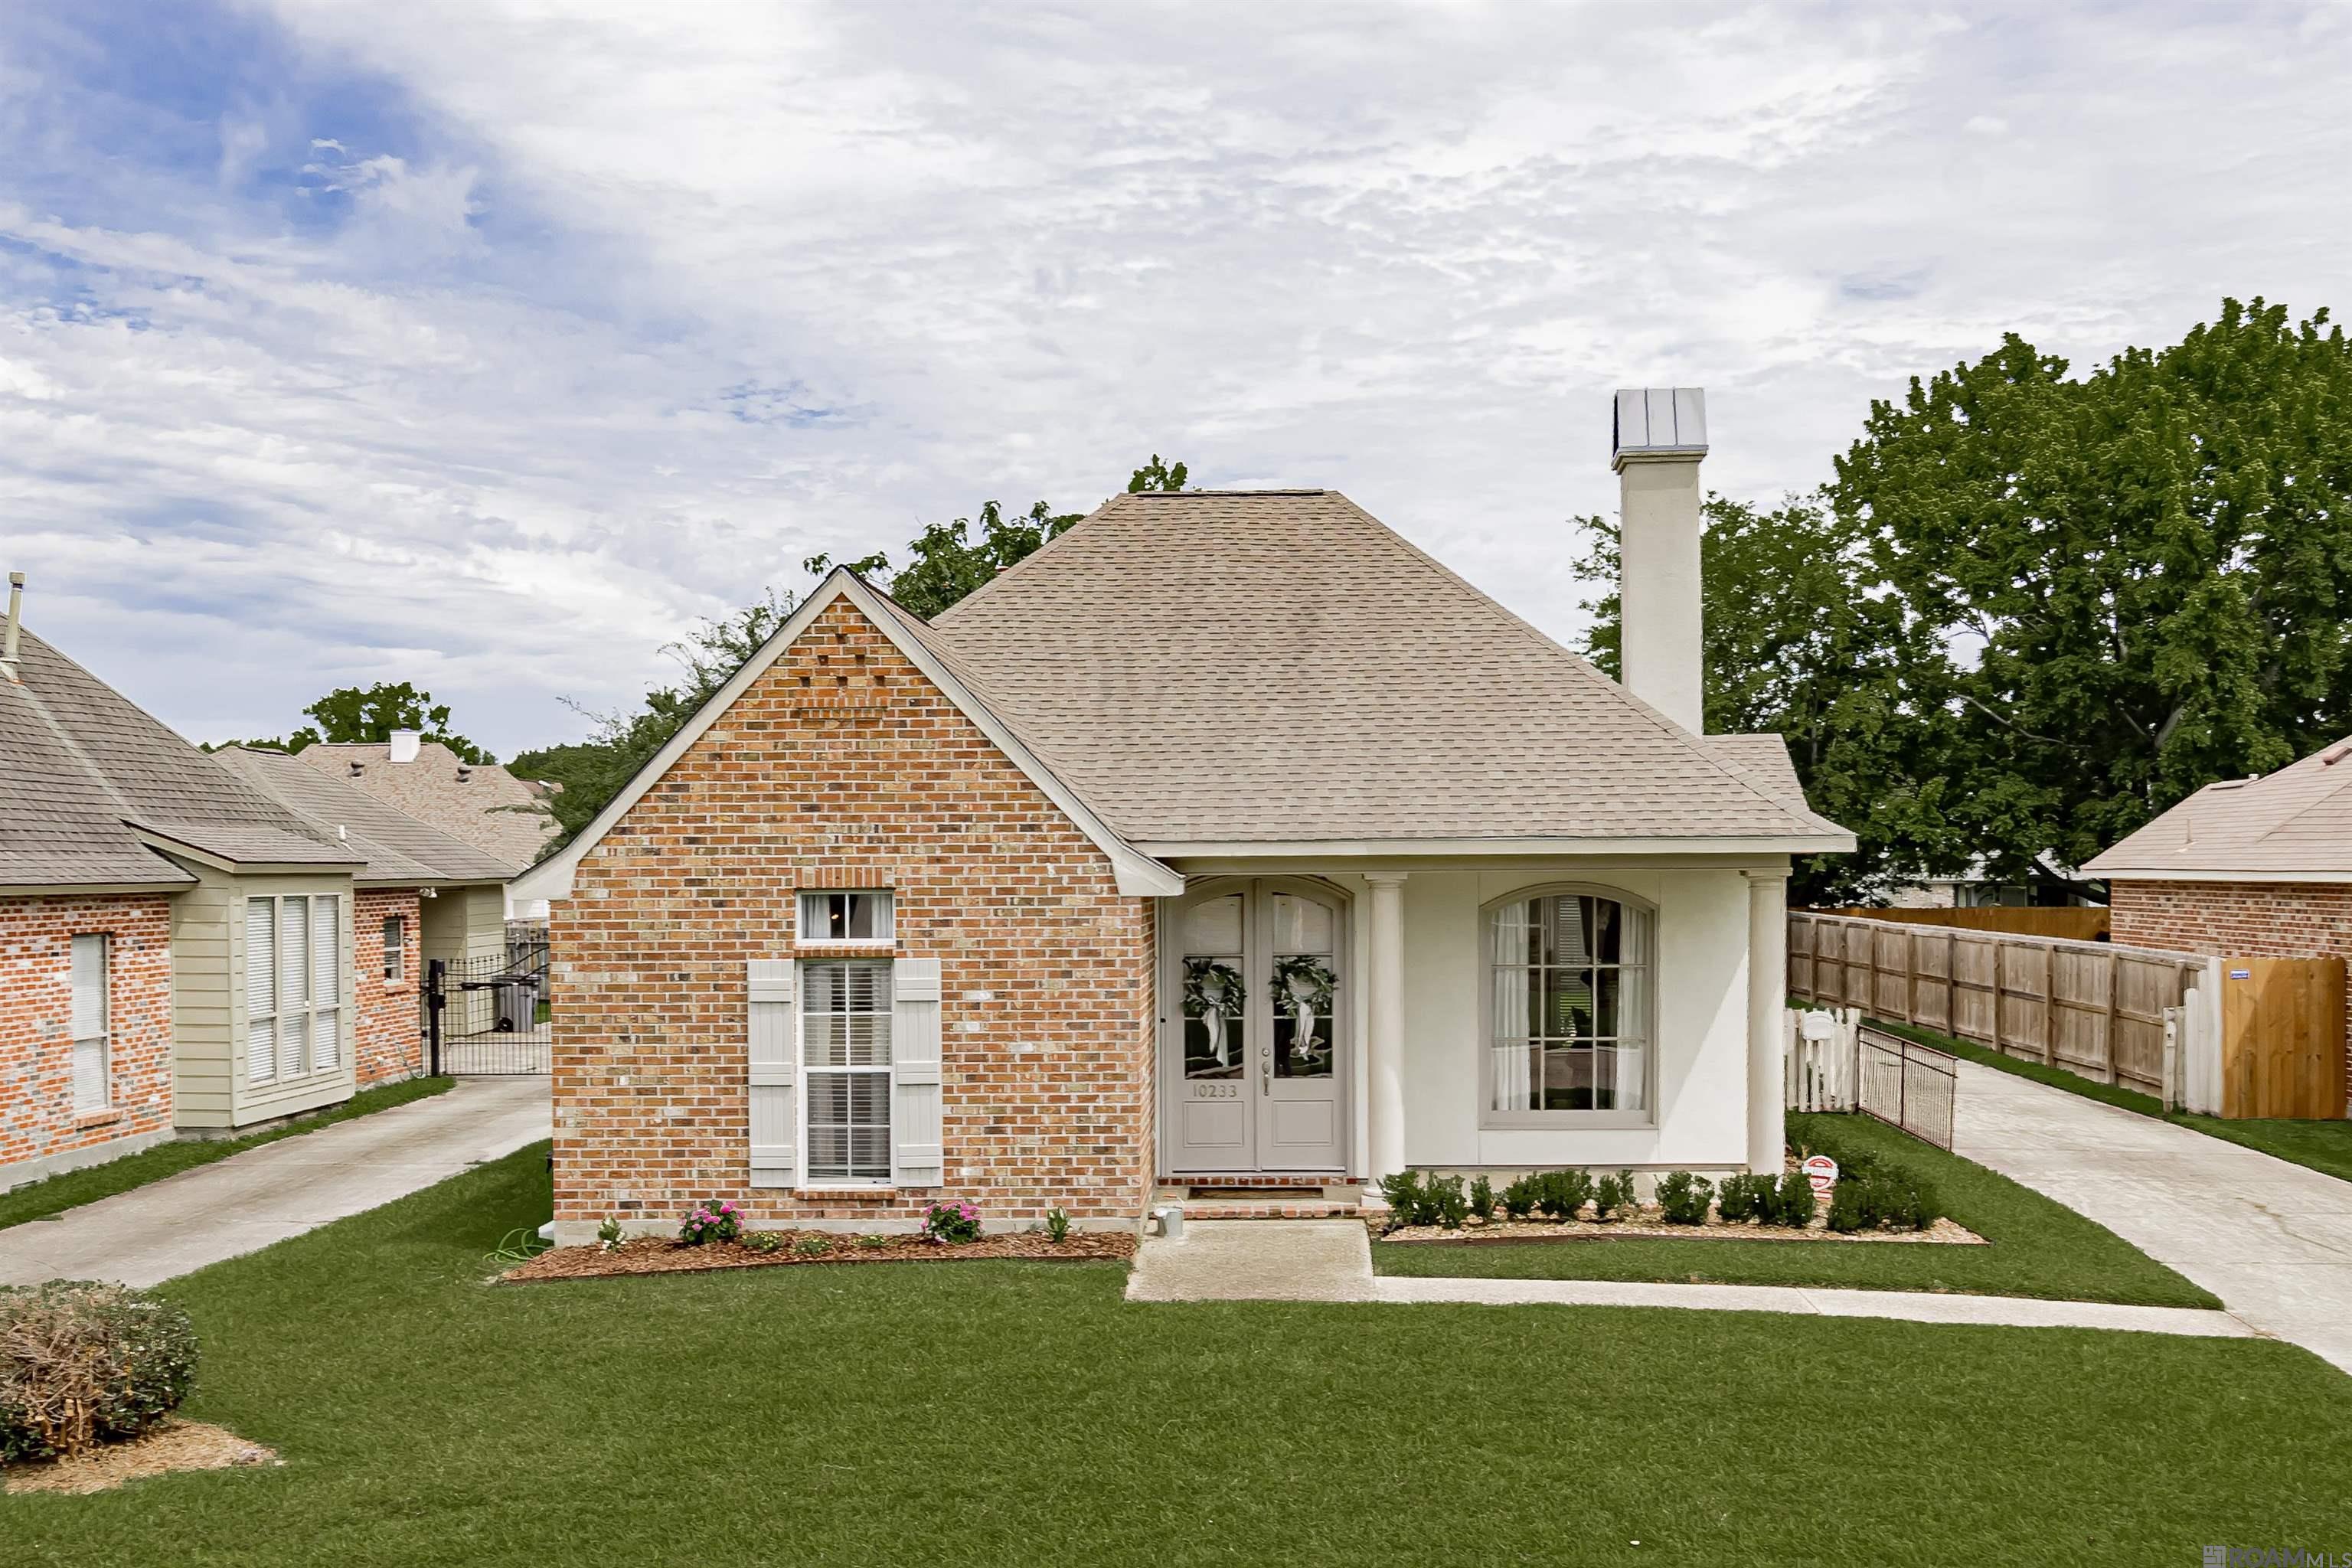
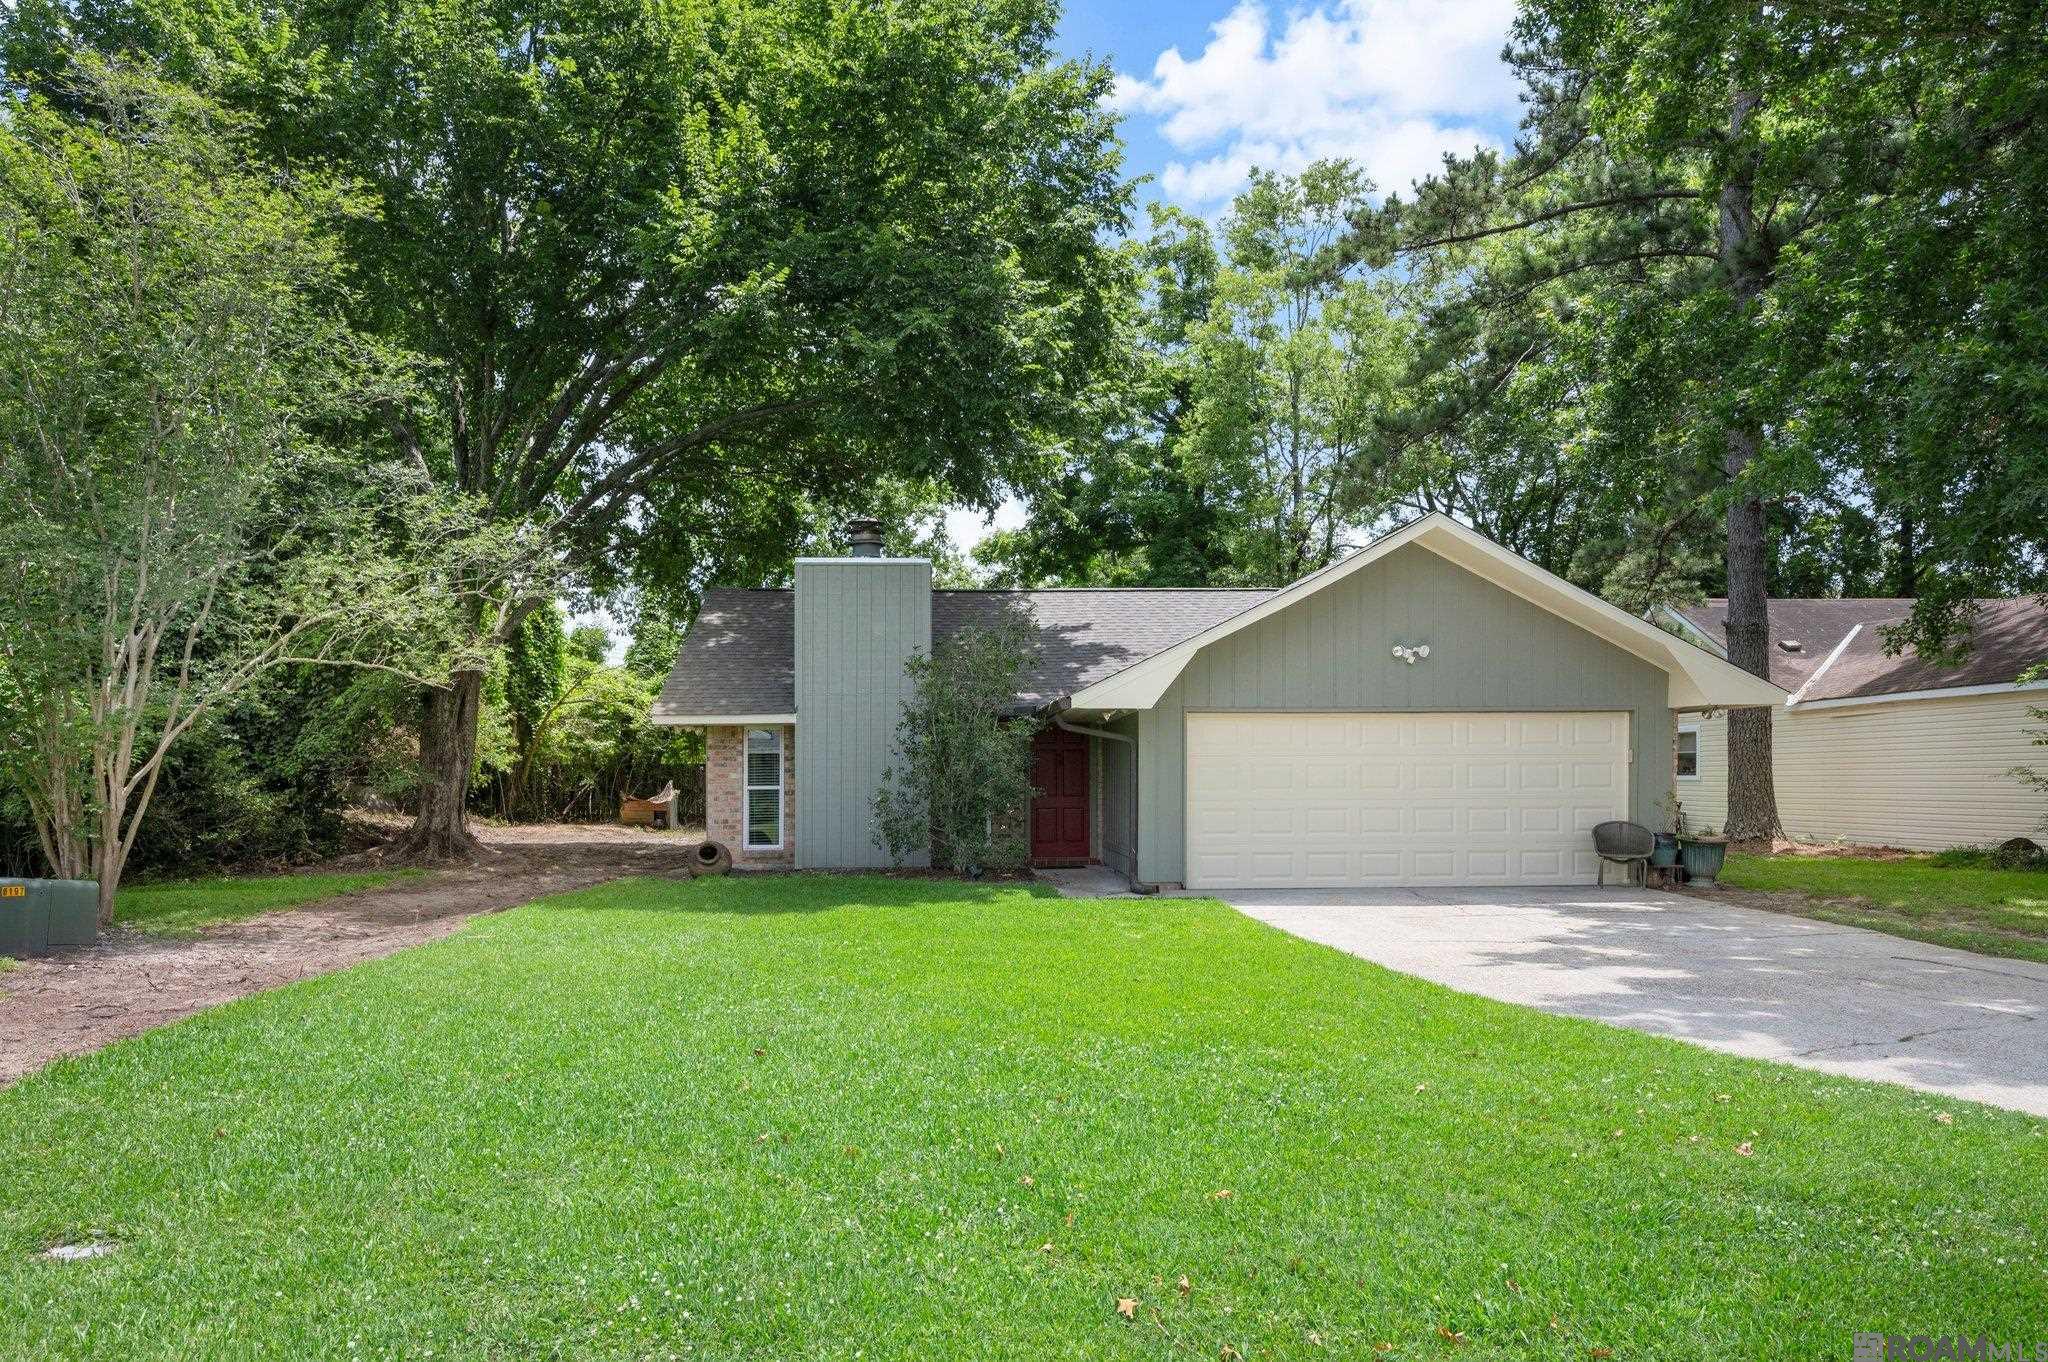
Pending
$312,000
3
bds
|
2
ba
|
1,587
sqft
|
built
2001
10233 Springpark Ave, Baton Rouge, LA 70810
$-149
Cash flow
-2.5%
Cash-on-Cash Return
5.7%
Cap rate
0.7%
Rent to Value Ratio
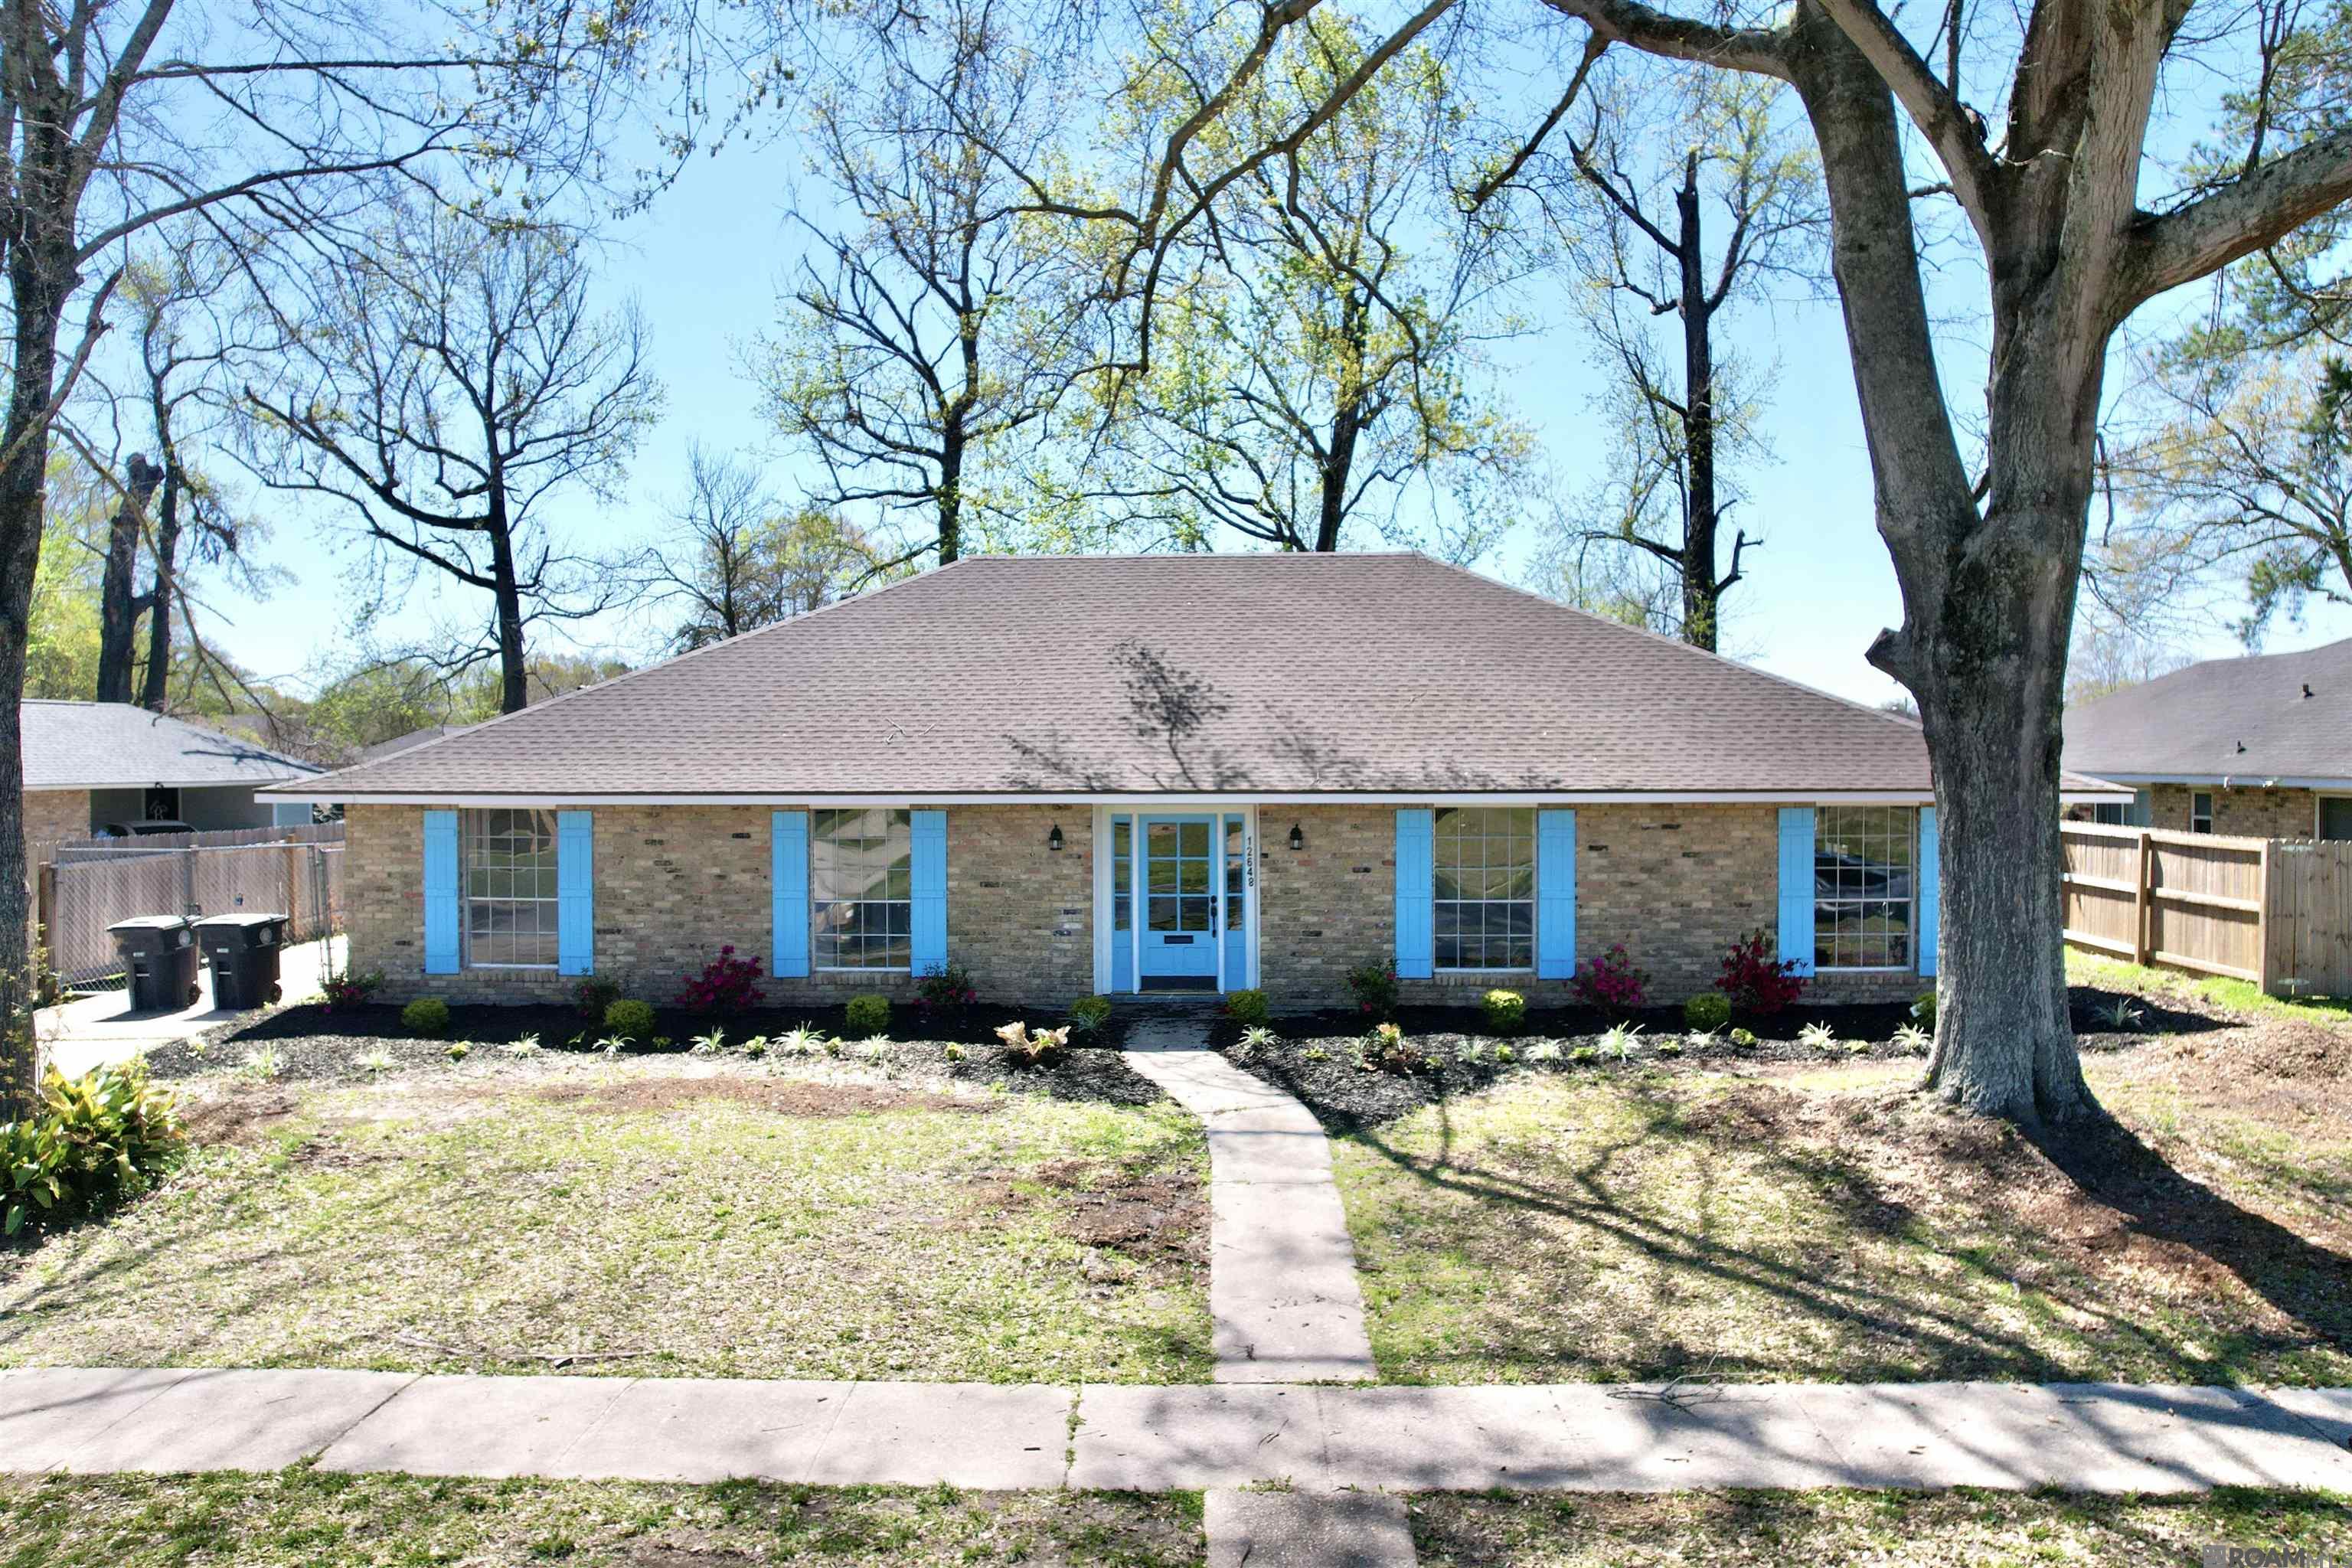
Active
$279,700
4
bds
|
3
ba
|
2,505
sqft
|
built
1966
12648 Mollylea Dr, Baton Rouge, LA 70815
$53
Cash flow
1.0%
Cash-on-Cash Return
6.5%
Cap rate
0.8%
Rent to Value Ratio

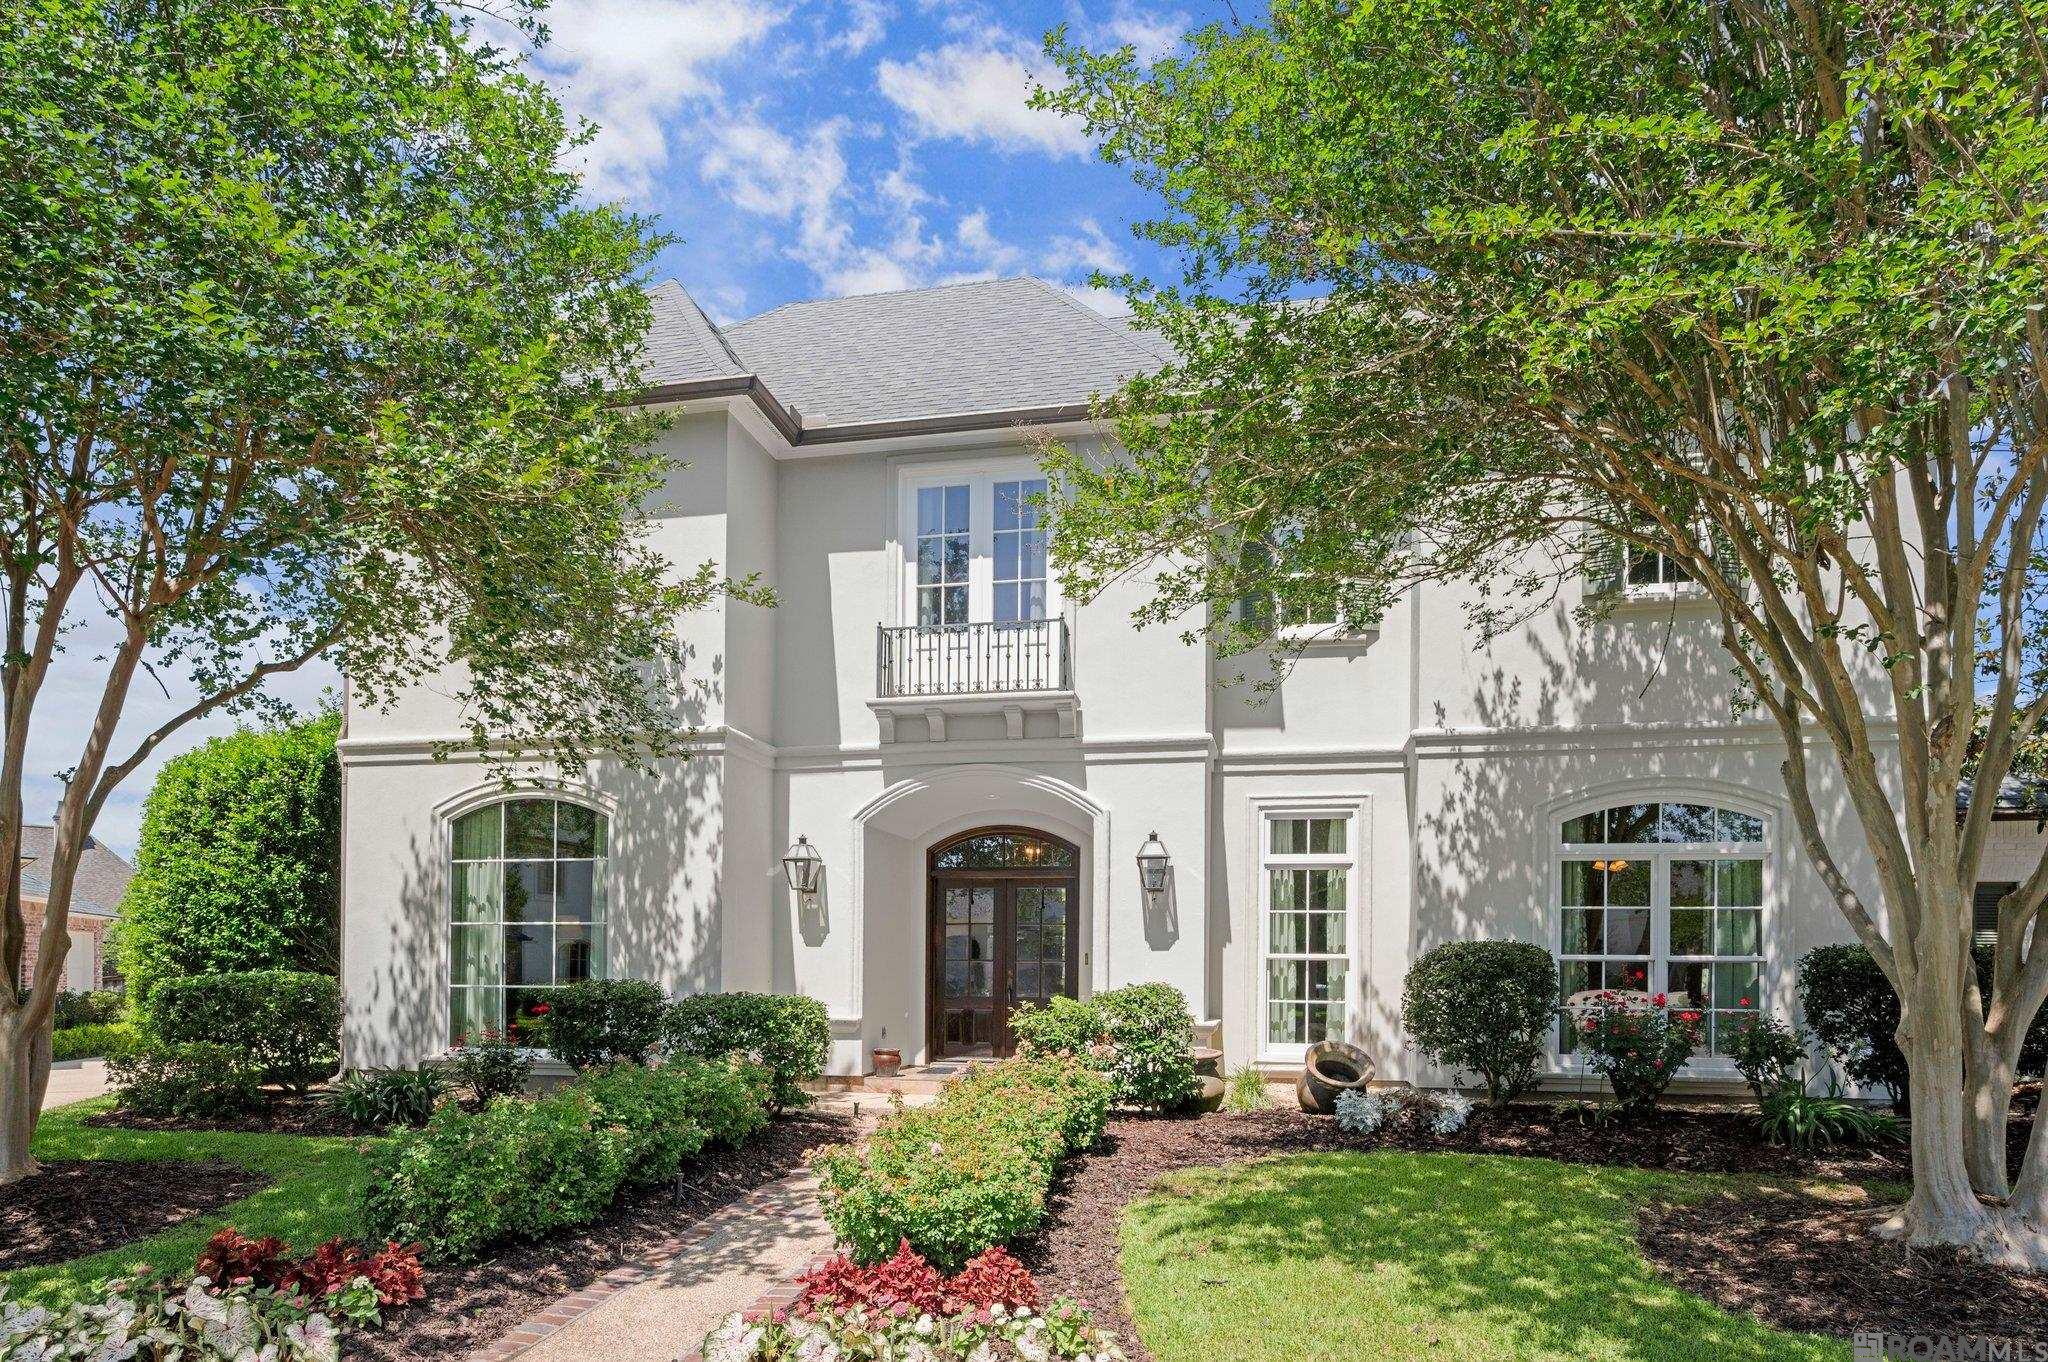
Active
$939,500
4
bds
|
3
ba
|
3,656
sqft
|
built
2022
2757 Chenal Ct, Baton Rouge, LA 70820
$500
Cash flow
2.8%
Cash-on-Cash Return
6.9%
Cap rate
0.9%
Rent to Value Ratio
Active
$49,990
2
bds
|
1
ba
|
830
sqft
|
built
1975
11675 Ellen Dr, Baton Rouge, LA 70811
$897
Cash flow
20.9%
Cash-on-Cash Return
21.5%
Cap rate
2.6%
Rent to Value Ratio
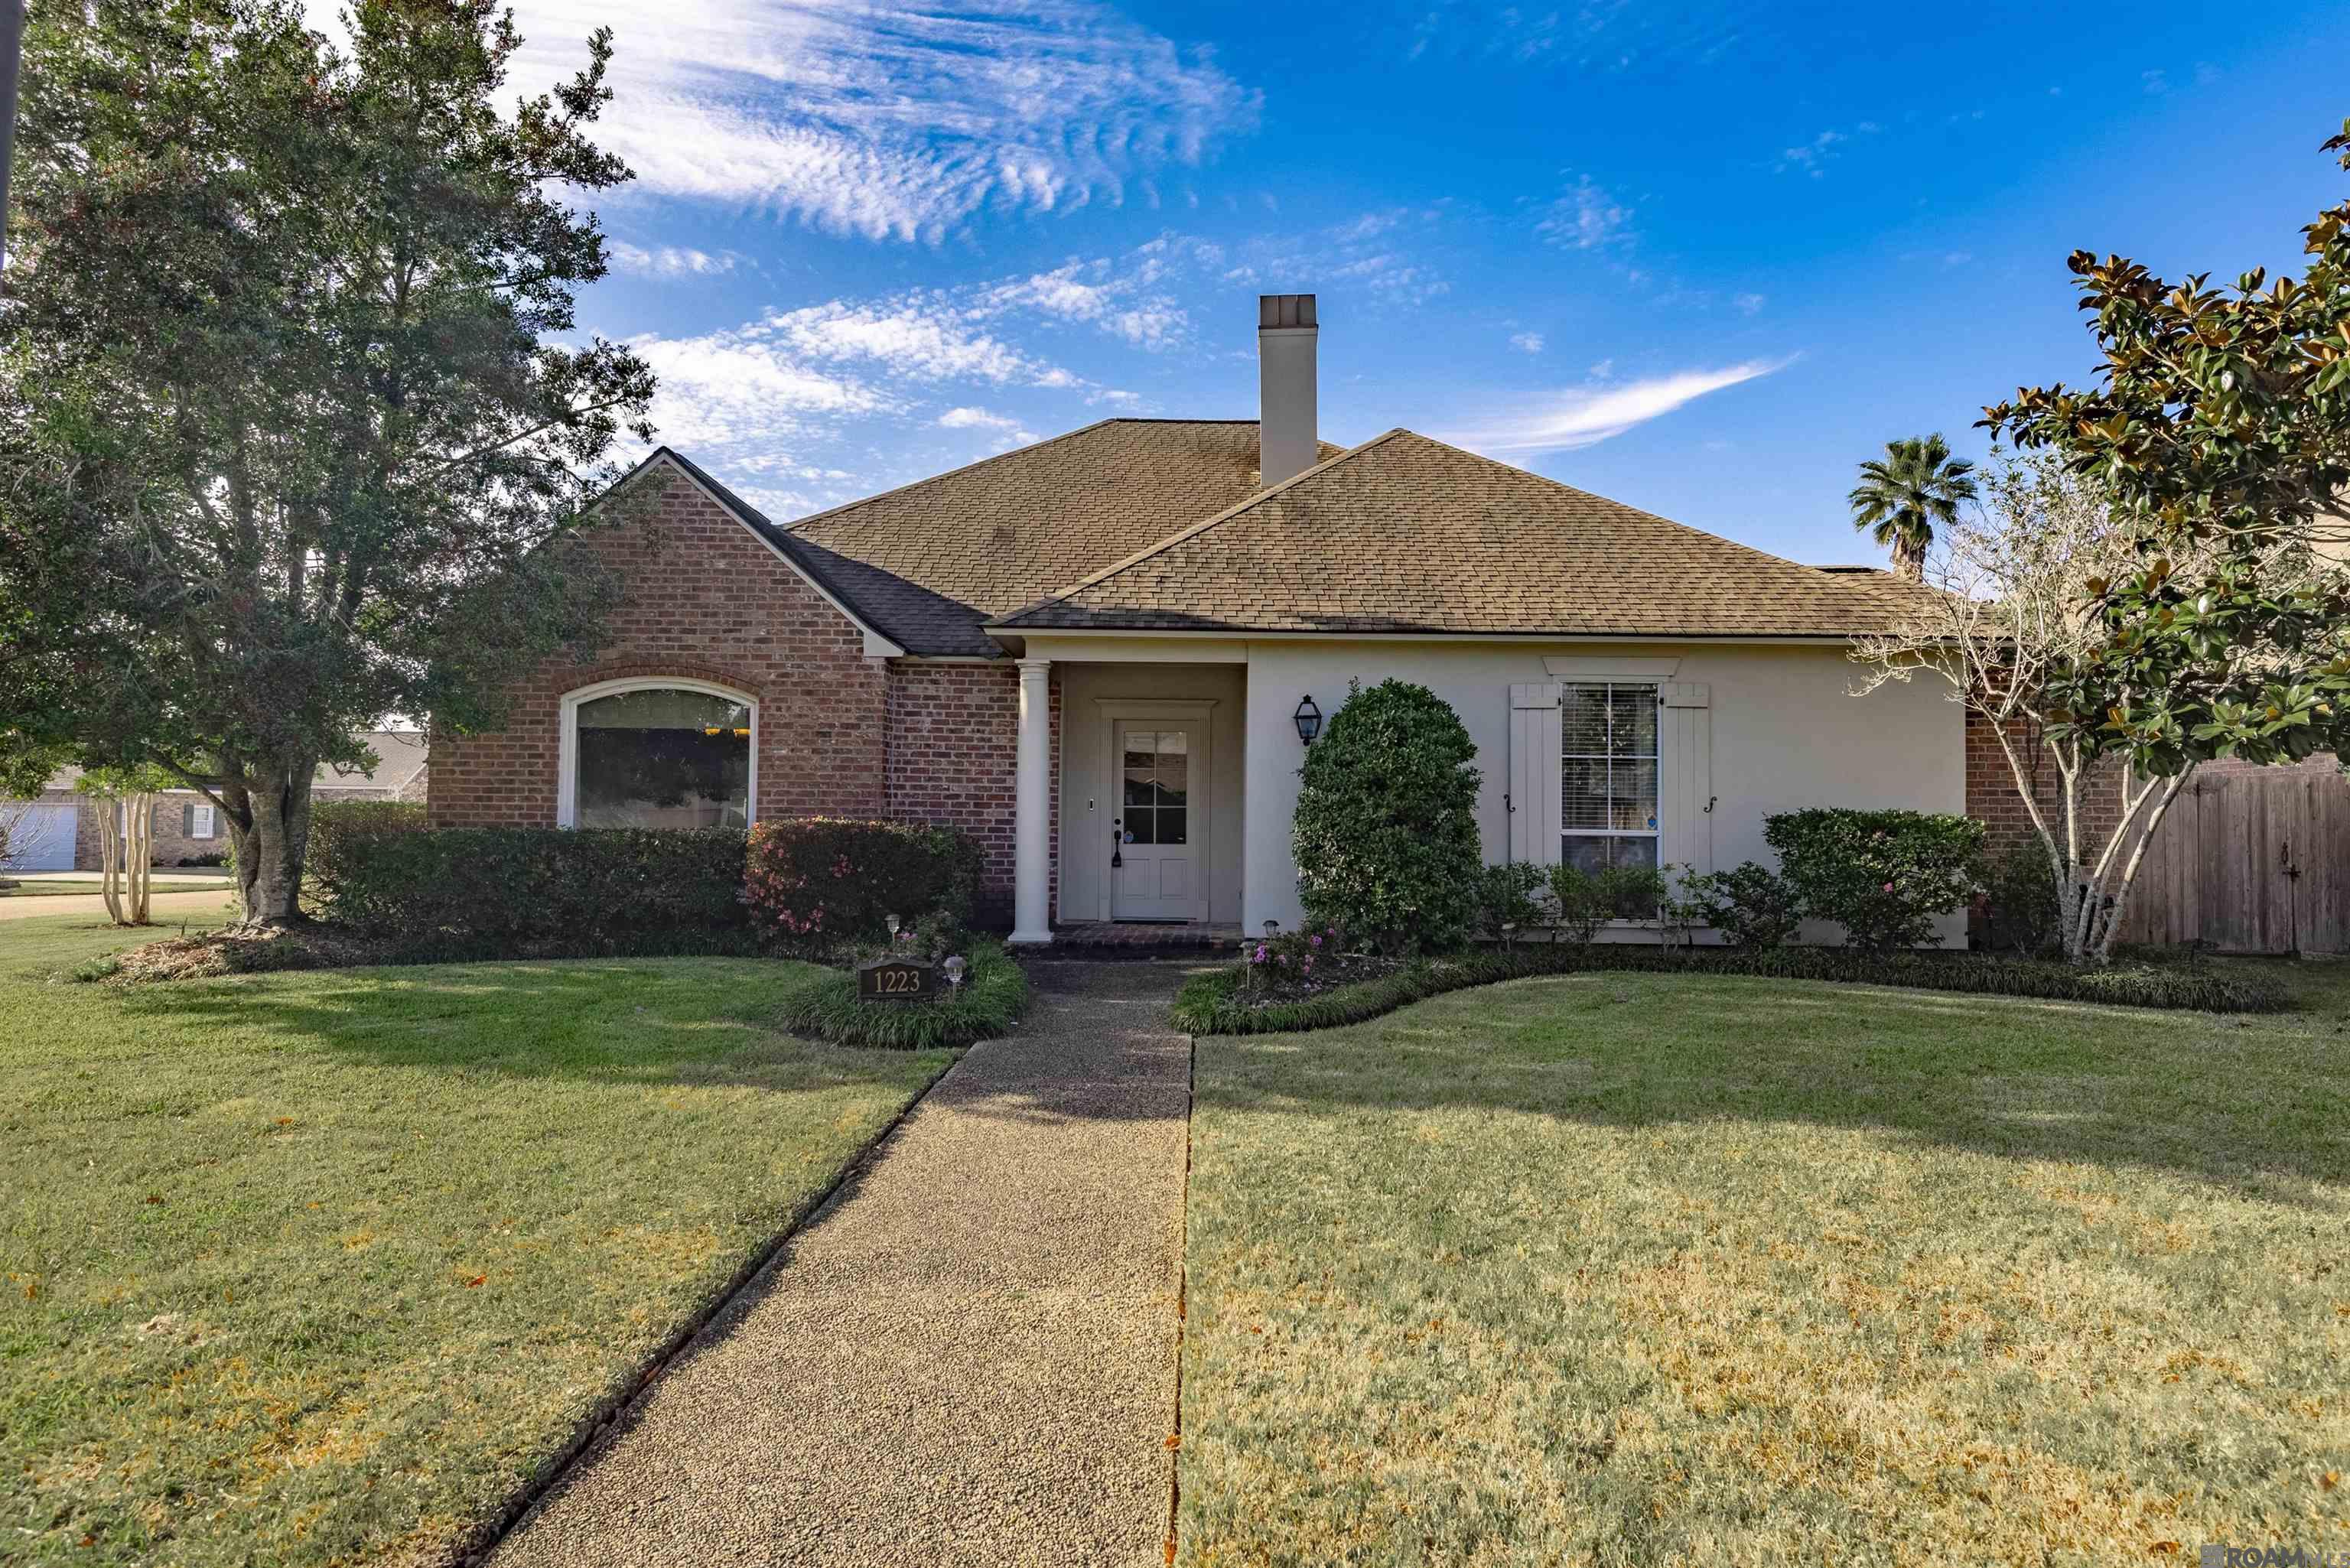
Active
$400,000
3
bds
|
3
ba
|
2,899
sqft
|
built
1995
1223 E Stanwick Pl, Baton Rouge, LA 70810
$39
Cash flow
0.5%
Cash-on-Cash Return
6.4%
Cap rate
0.8%
Rent to Value Ratio
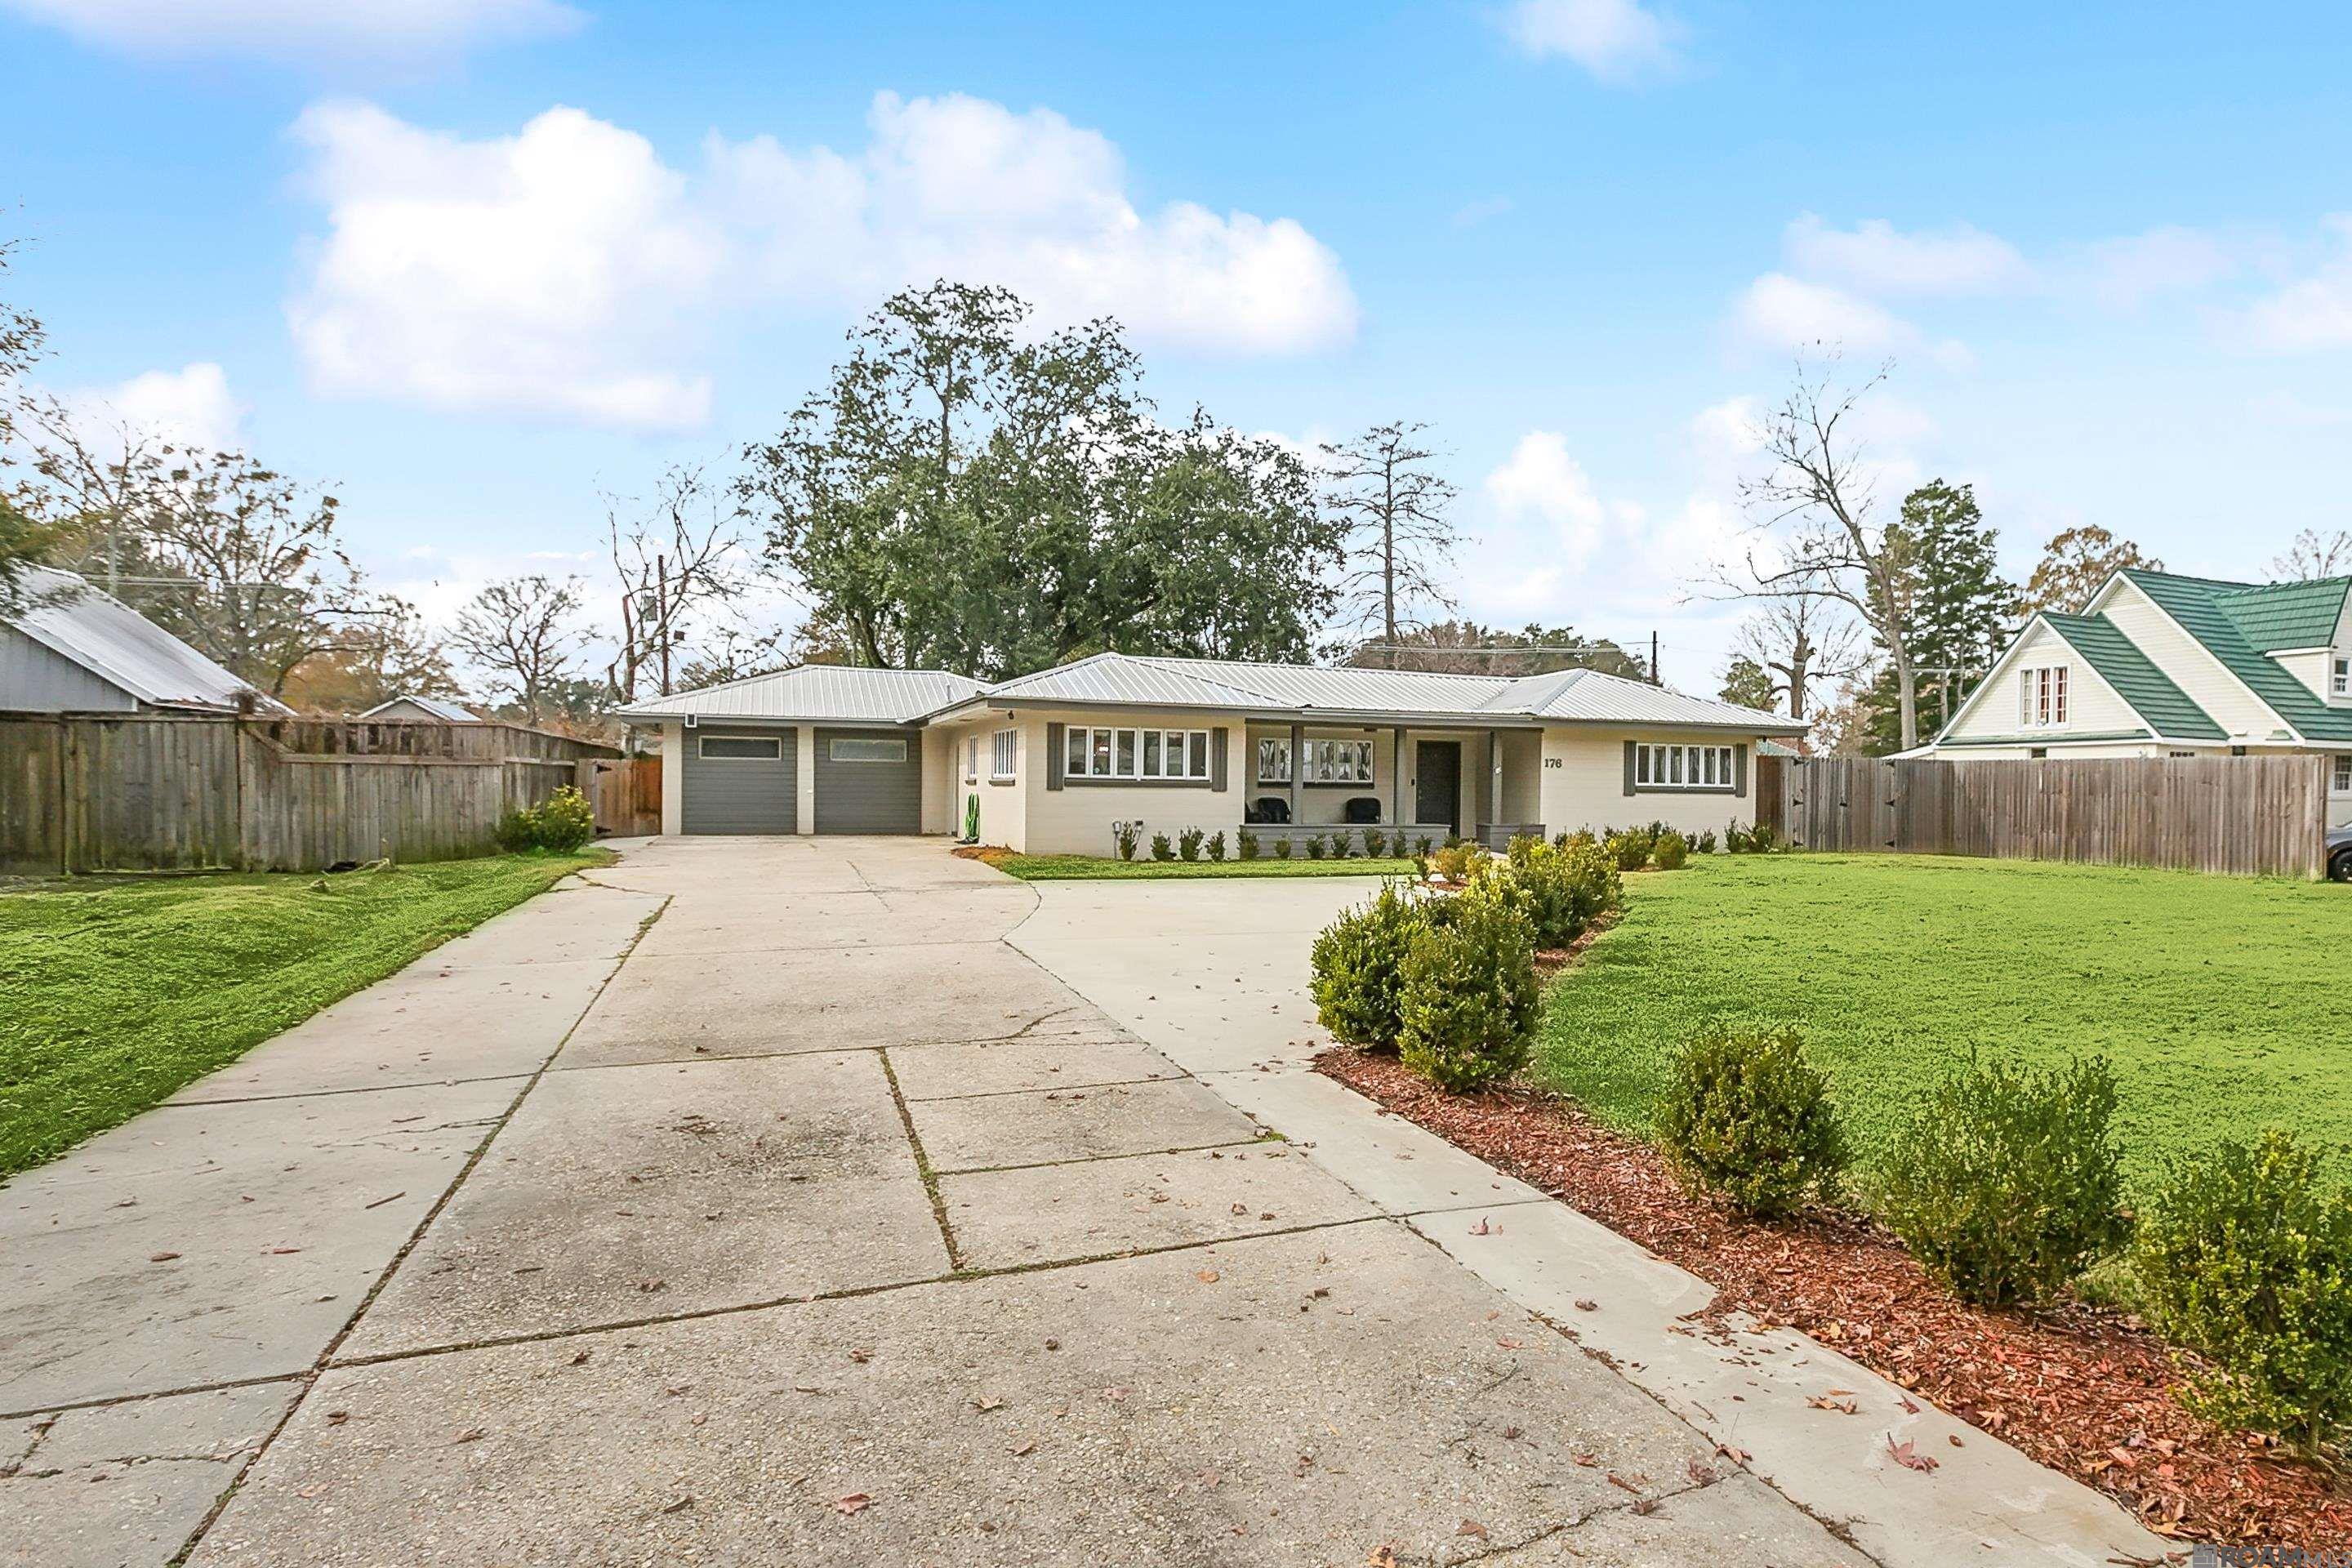
Active
$390,000
4
bds
|
3
ba
|
2,576
sqft
|
built
1970
176 S Donmoor Ave, Baton Rouge, LA 70806
$-110
Cash flow
-1.5%
Cash-on-Cash Return
5.9%
Cap rate
0.7%
Rent to Value Ratio
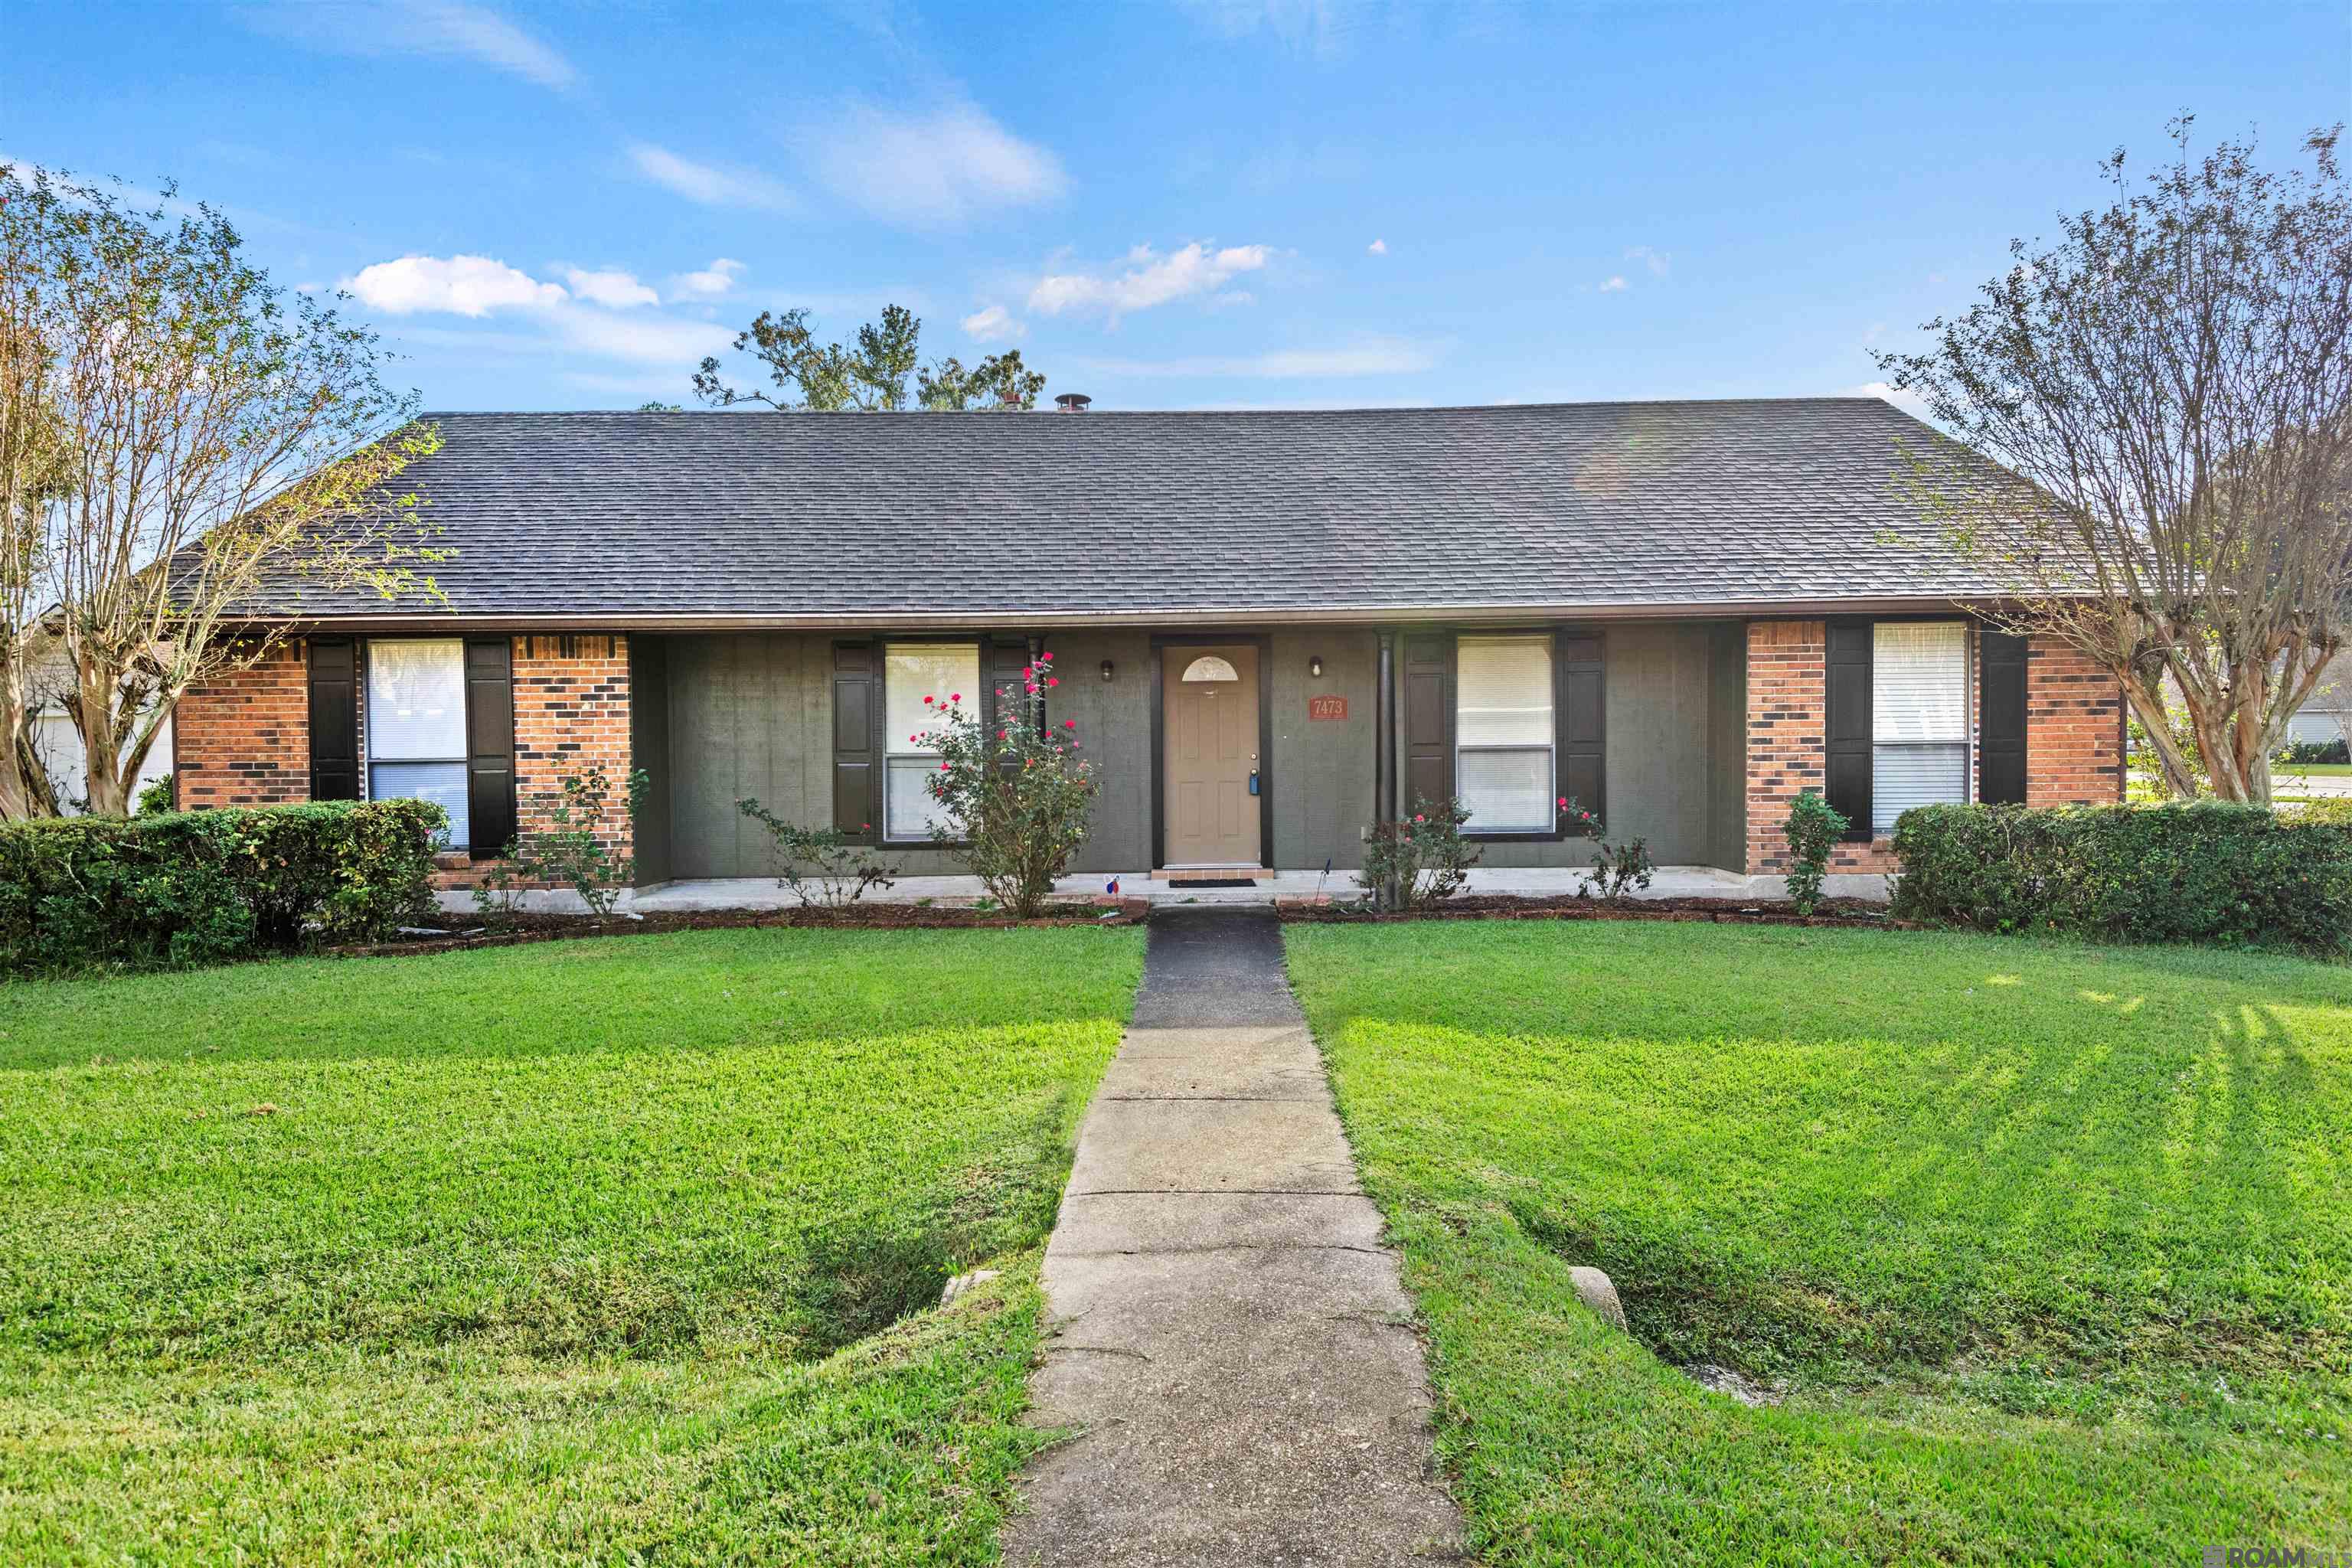
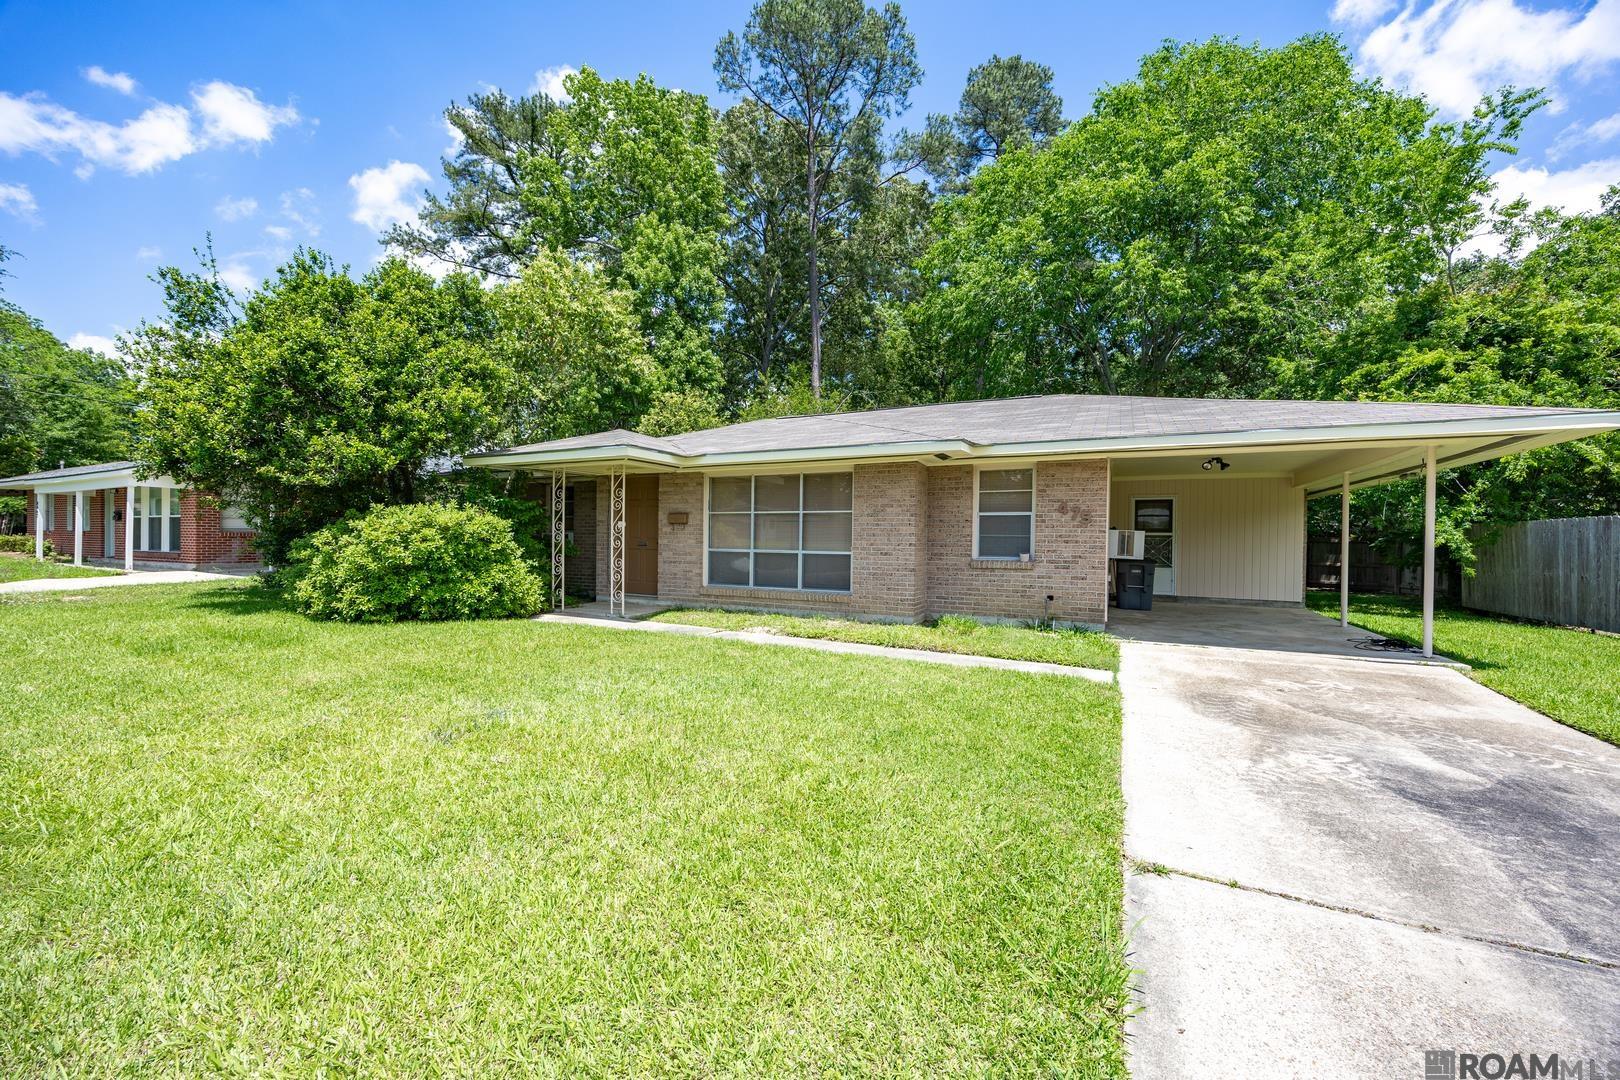
Active
$229,000
4
bds
|
2
ba
|
1,966
sqft
|
built
1978
7473 Pennhill Dr, Baton Rouge, LA 70817
$21
Cash flow
0.5%
Cash-on-Cash Return
6.4%
Cap rate
0.8%
Rent to Value Ratio
Active
$354,900
4
bds
|
3
ba
|
2,294
sqft
|
built
1989
3936 Indian Run Dr, Baton Rouge, LA 70816
$-65
Cash flow
-1.0%
Cash-on-Cash Return
6.1%
Cap rate
0.7%
Rent to Value Ratio

Active
$299,900
3
bds
|
2
ba
|
1,309
sqft
|
built
830 East Blvd, Baton Rouge, LA 70802
$-259
Cash flow
-4.5%
Cash-on-Cash Return
5.2%
Cap rate
0.6%
Rent to Value Ratio

Active
$236,000
3
bds
|
2
ba
|
1,502
sqft
|
built
2006
683 Fall Creek Dr, Baton Rouge, LA 70810
$-29
Cash flow
-0.6%
Cash-on-Cash Return
6.1%
Cap rate
0.8%
Rent to Value Ratio

Active
$189,900
2
bds
|
1
ba
|
1,085
sqft
|
built
1946
2639 Mc Grath Ave, Baton Rouge, LA 70806
$-97
Cash flow
-2.7%
Cash-on-Cash Return
5.7%
Cap rate
0.7%
Rent to Value Ratio
Active
$154,900
3
bds
|
1
ba
|
1,290
sqft
|
built
1957
8475 S Parkland Dr, Baton Rouge, LA 70806
$224
Cash flow
7.5%
Cash-on-Cash Return
8.0%
Cap rate
1.0%
Rent to Value Ratio

Active
$334,000
3
bds
|
2
ba
|
1,768
sqft
|
built
2014
7907 Valencia Ct, Baton Rouge, LA 70820
$-91
Cash flow
-1.4%
Cash-on-Cash Return
6.0%
Cap rate
0.7%
Rent to Value Ratio
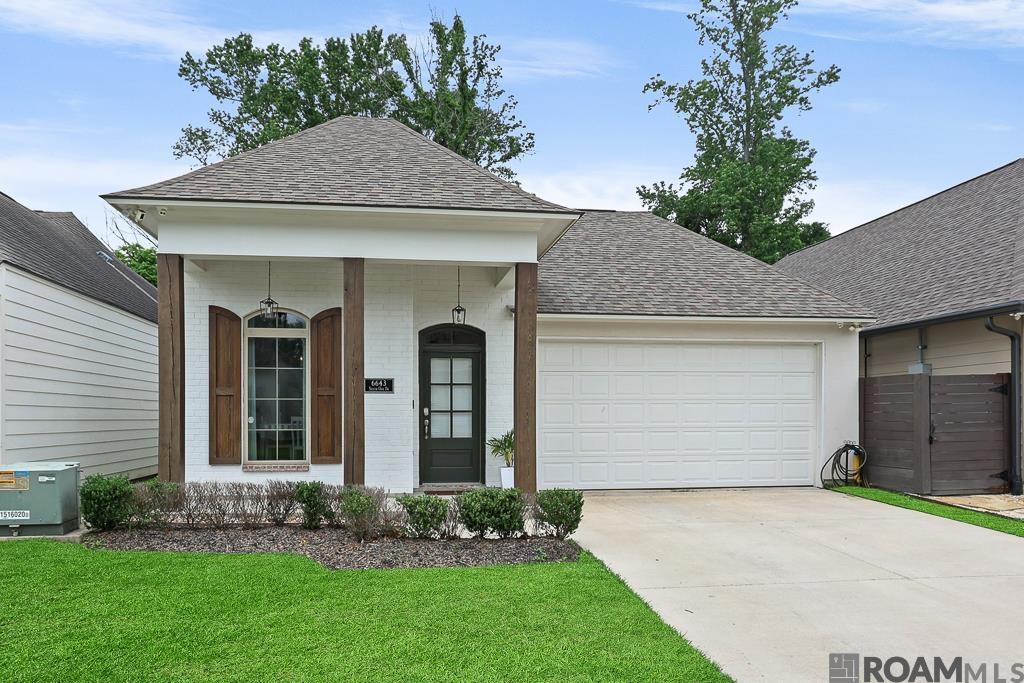
Active
$365,000
3
bds
|
2
ba
|
1,871
sqft
|
built
2019
6643 Silver Oak Dr, Baton Rouge, LA 70817
$-186
Cash flow
-2.7%
Cash-on-Cash Return
5.7%
Cap rate
0.7%
Rent to Value Ratio
Active
$205,000
3
bds
|
2
ba
|
1,412
sqft
|
built
2007
9031 Crosscreek Ave, Baton Rouge, LA 70810
$30
Cash flow
0.8%
Cash-on-Cash Return
6.5%
Cap rate
0.8%
Rent to Value Ratio
Pending
$335,000
4
bds
|
2
ba
|
1,946
sqft
|
built
1975
912 N Coventry Dr, Baton Rouge, LA 70808
$-236
Cash flow
-3.7%
Cash-on-Cash Return
5.4%
Cap rate
0.7%
Rent to Value Ratio
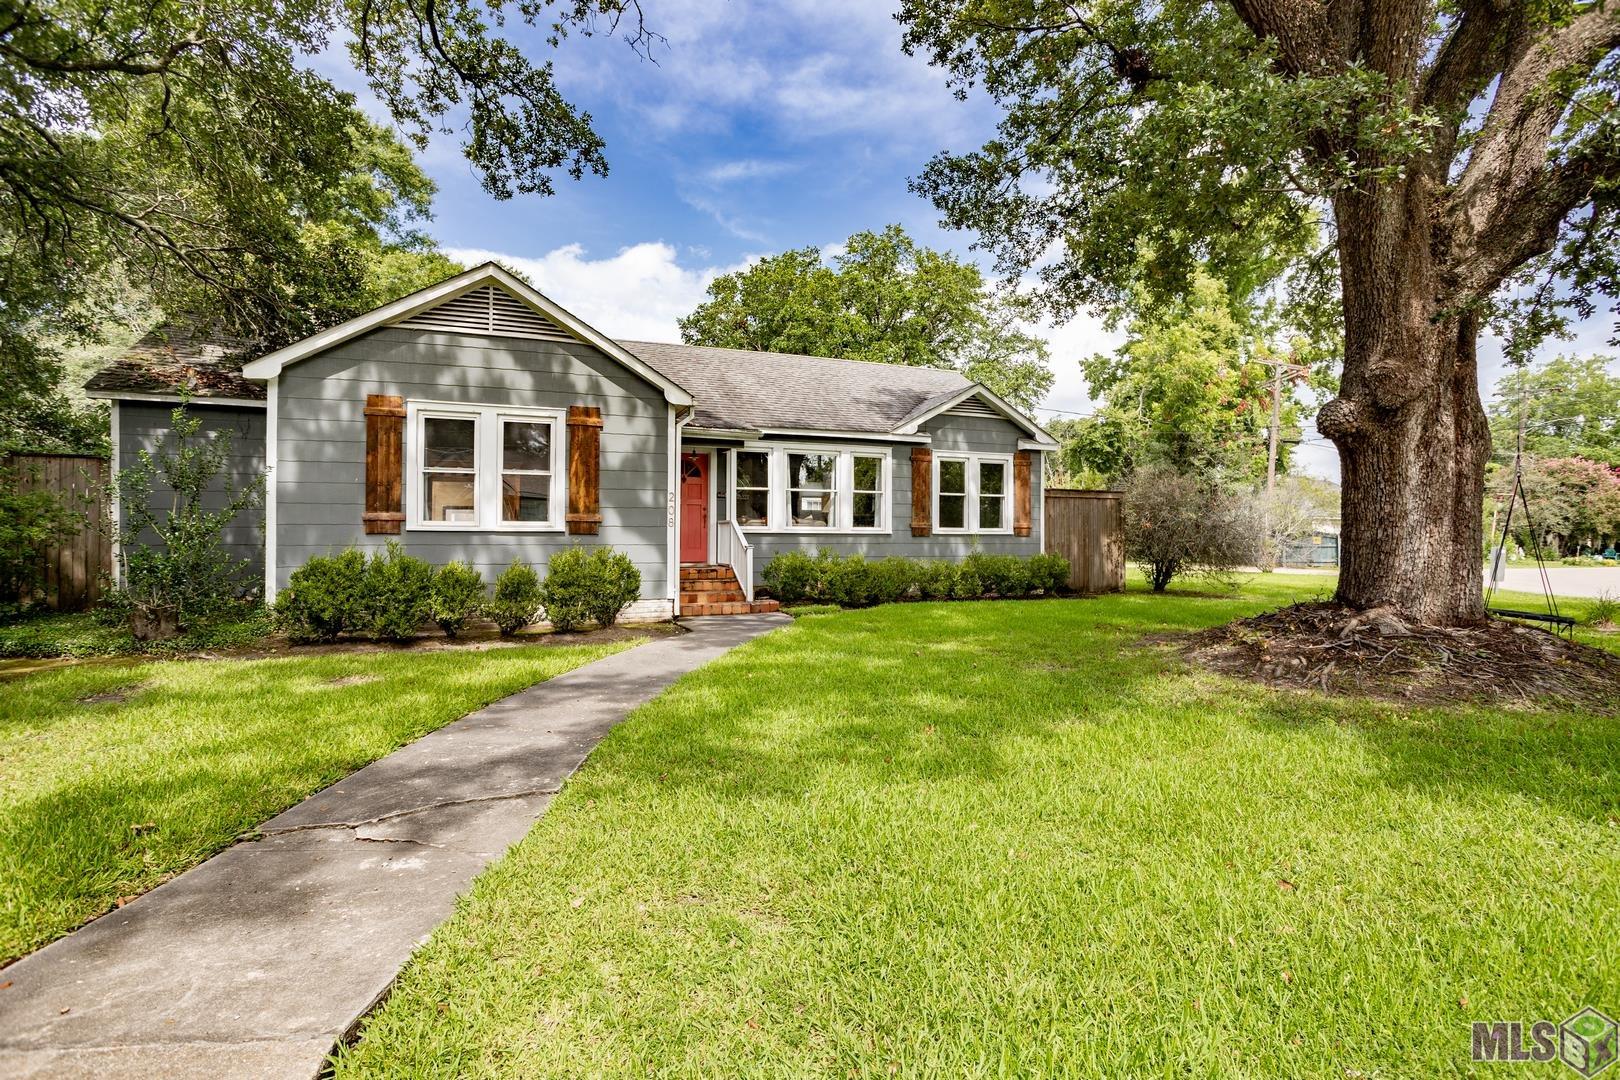
Active
$305,000
3
bds
|
2
ba
|
1,712
sqft
|
built
1945
208 Bellewood Dr, Baton Rouge, LA 70806
$-217
Cash flow
-3.7%
Cash-on-Cash Return
5.4%
Cap rate
0.7%
Rent to Value Ratio
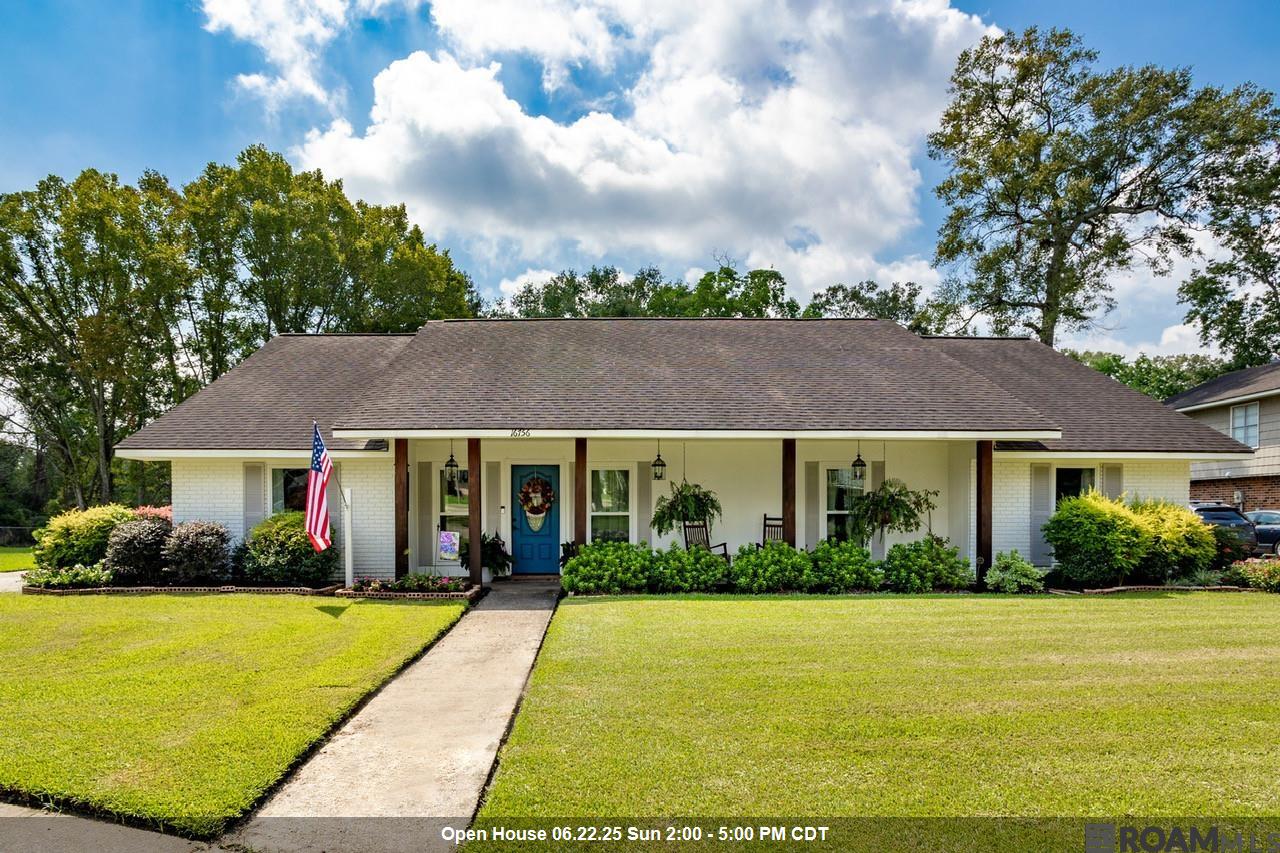
Active
$359,000
4
bds
|
3
ba
|
2,795
sqft
|
built
1977
16756 Merrimac Ave, Baton Rouge, LA 70817
$-86
Cash flow
-1.2%
Cash-on-Cash Return
6.0%
Cap rate
0.7%
Rent to Value Ratio
Active
$325,000
3
bds
|
2
ba
|
1,963
sqft
|
built
2000
17723 Twin Ridge Ave, Baton Rouge, LA 70817
$-144
Cash flow
-2.3%
Cash-on-Cash Return
5.8%
Cap rate
0.7%
Rent to Value Ratio
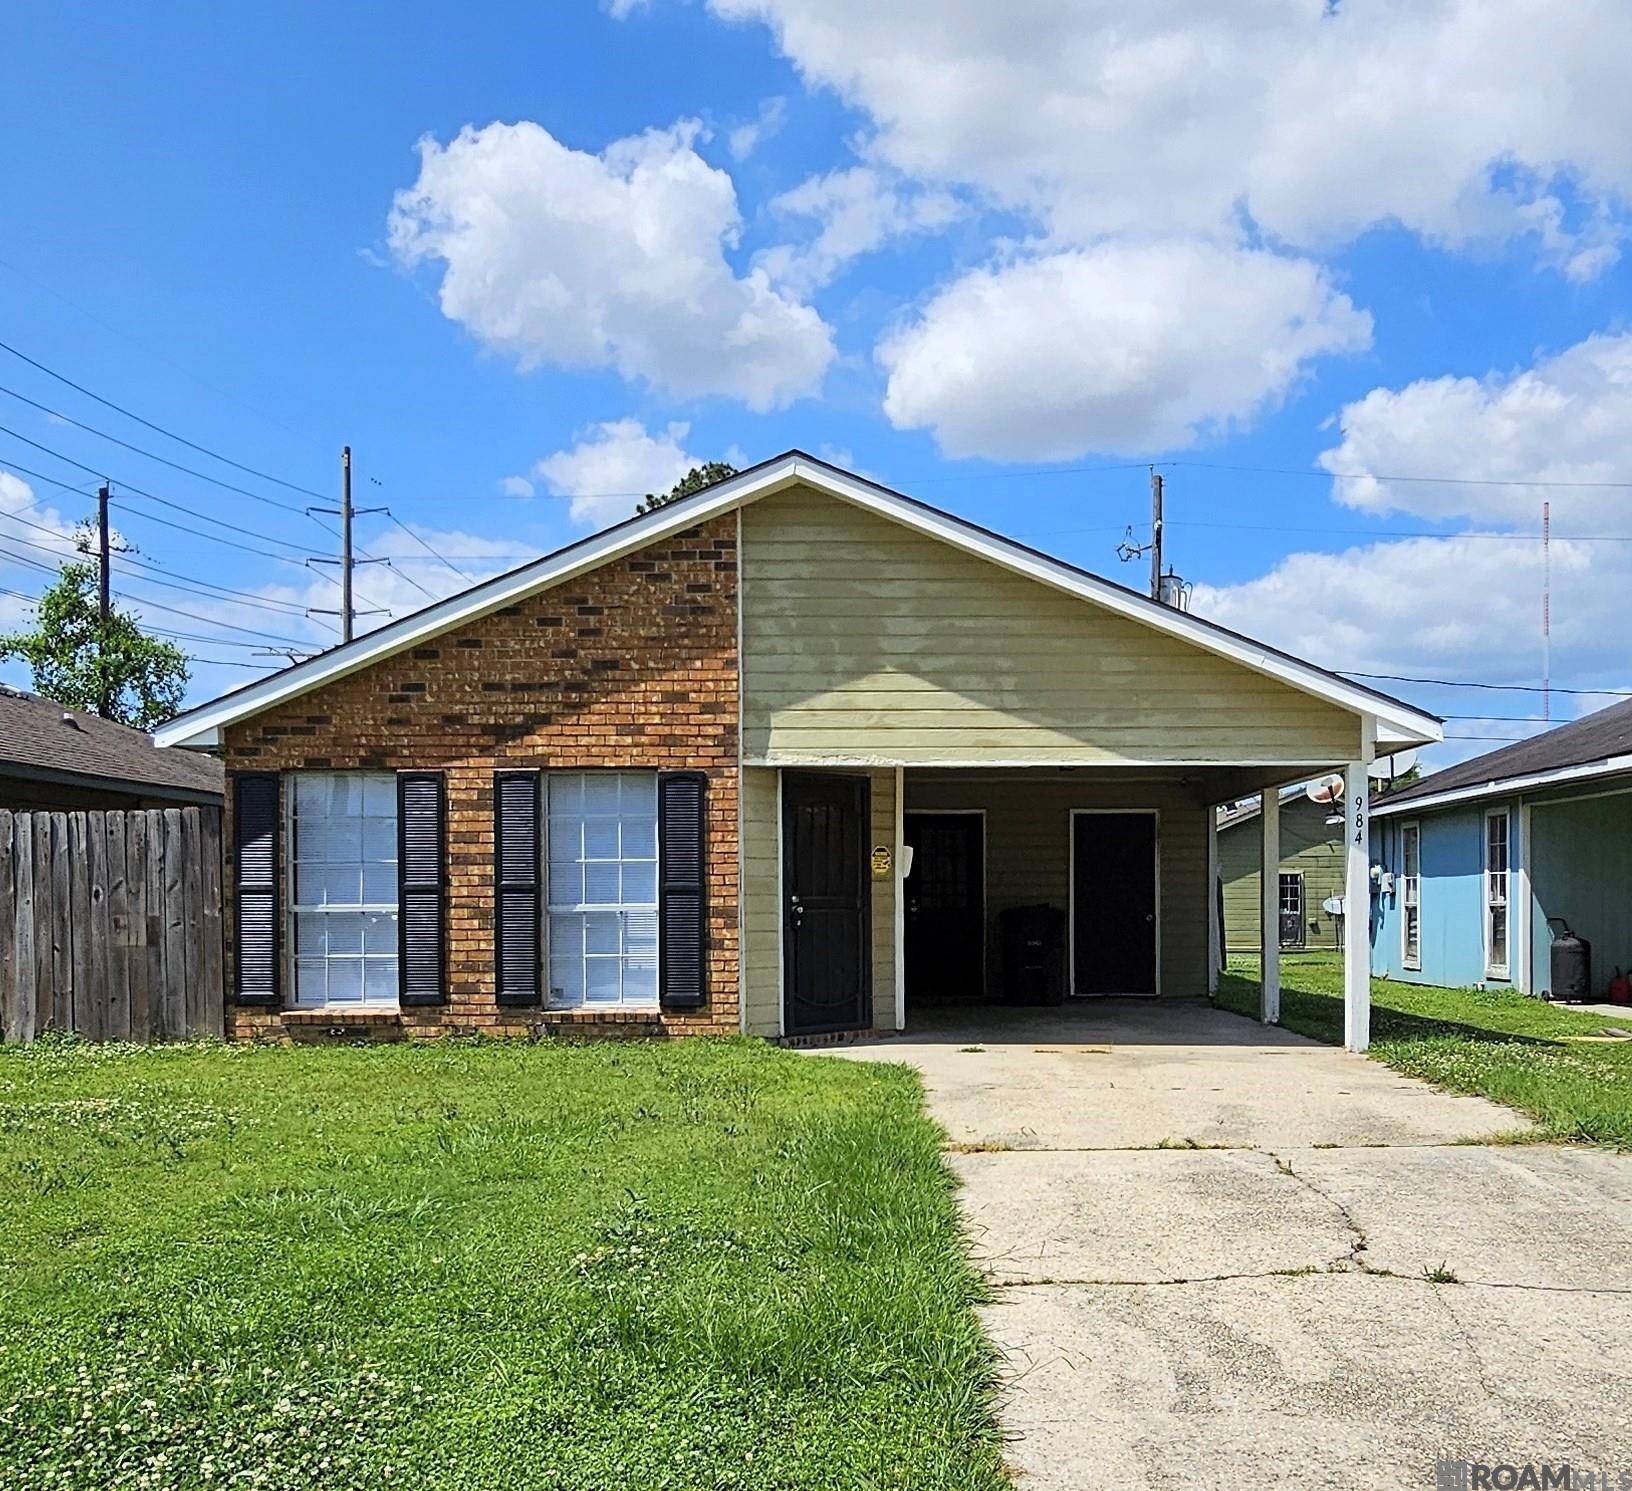
Active
$110,000
3
bds
|
2
ba
|
1,053
sqft
|
built
1984
984 W Mc Kinley St, Baton Rouge, LA 70802
$183
Cash flow
8.7%
Cash-on-Cash Return
8.3%
Cap rate
1.0%
Rent to Value Ratio
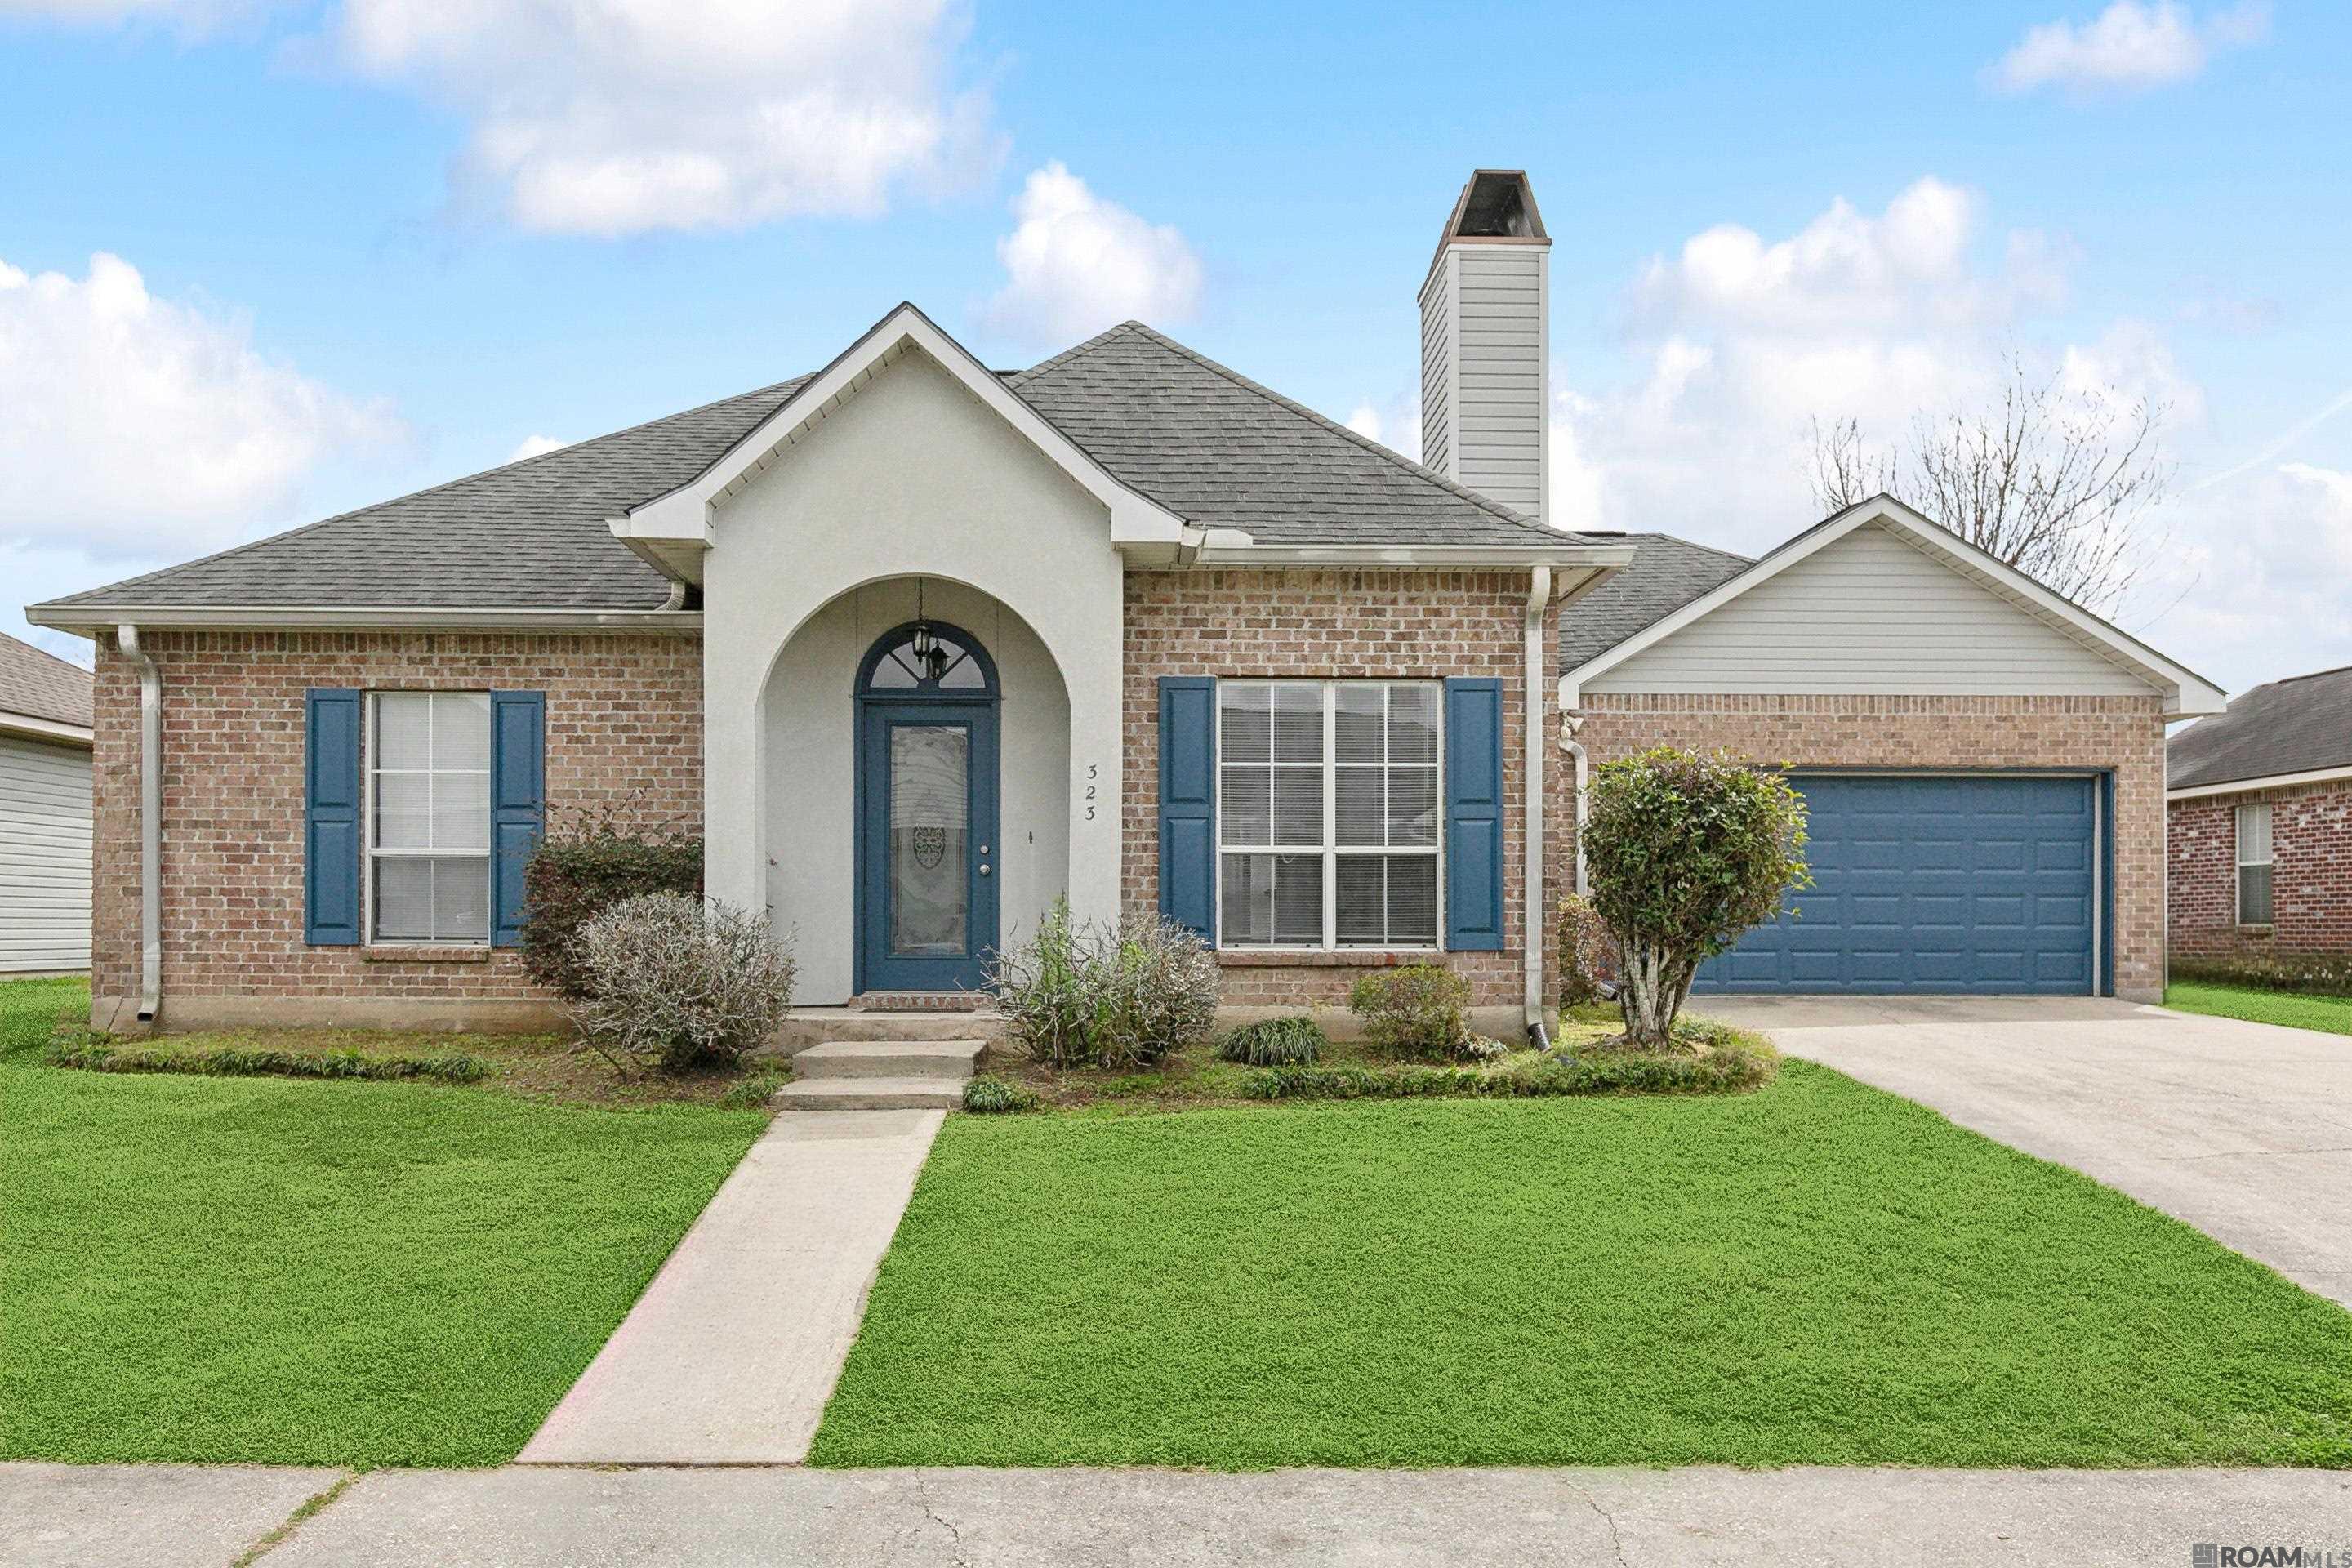
Active
$228,000
3
bds
|
2
ba
|
1,480
sqft
|
built
2000
323 Briarhaven Dr, Baton Rouge, LA 70810
$-90
Cash flow
-2.1%
Cash-on-Cash Return
5.8%
Cap rate
0.7%
Rent to Value Ratio
Active
$463,000
3
bds
|
2
ba
|
1,786
sqft
|
built
1960
2549 Hillsdale Dr, Baton Rouge, LA 70808
$-493
Cash flow
-5.6%
Cash-on-Cash Return
5.0%
Cap rate
0.6%
Rent to Value Ratio
Active
$579,000
3
bds
|
3
ba
|
4,085
sqft
|
built
1999
1518 Pickett Ave, Baton Rouge, LA 70808
$-826
Cash flow
-7.4%
Cash-on-Cash Return
4.6%
Cap rate
0.6%
Rent to Value Ratio

Active
$509,000
4
bds
|
4
ba
|
3,633
sqft
|
built
1986
4230 Lake Sherwood Ave E, Baton Rouge, LA 70816
$-725
Cash flow
-7.4%
Cash-on-Cash Return
4.6%
Cap rate
0.6%
Rent to Value Ratio