Baton Rouge, LA Investment Properties for Sale
Browse homes for sale and investment properties in Baton Rouge, LA. Refine your search by price, property type, or more.
Best cash flowing properties in Baton Rouge, LA

Active
$85,000
bds
|
0
ba
|
3,150
sqft
|
built
1118 Convention St, Baton Rouge, LA 70802
$840
Cash flow
51.6%
Cash-on-Cash Return
17.5%
Cap rate
2.1%
Rent to Value Ratio
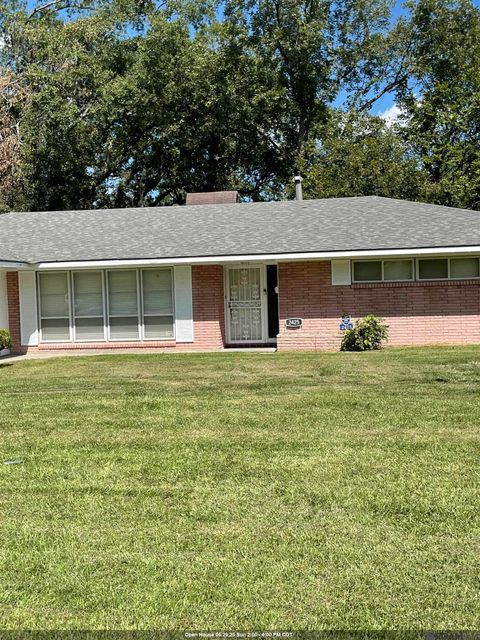
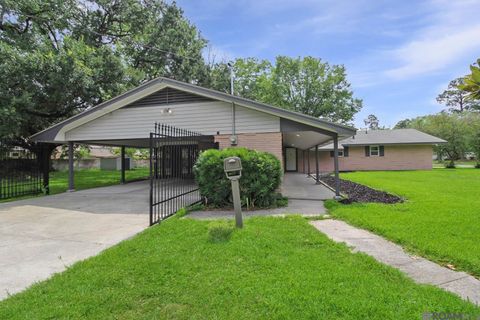
Active
$220,000
3
bds
|
3
ba
|
2,494
sqft
|
built
1960
2425 Harding Blvd, Baton Rouge, LA 70807
$339
Cash flow
8.0%
Cash-on-Cash Return
7.5%
Cap rate
0.9%
Rent to Value Ratio
905 out of 1,341 properties for sale in Baton Rouge, LA
Limited Results Shown
Create a free account, or log in to reveal all property listings and enjoy the complete experience.
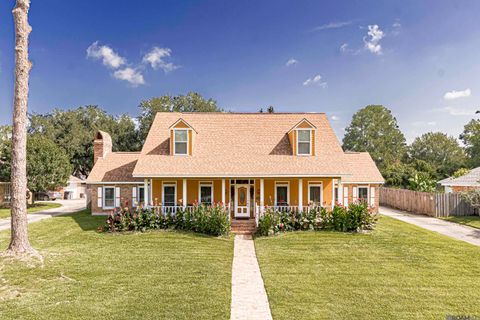
Active
$425,000
5
bds
|
3
ba
|
3,283
sqft
|
built
1993
12111 Lake Sherwood Ave N, Baton Rouge, LA 70816
$28
Cash flow
0.3%
Cash-on-Cash Return
5.8%
Cap rate
0.7%
Rent to Value Ratio
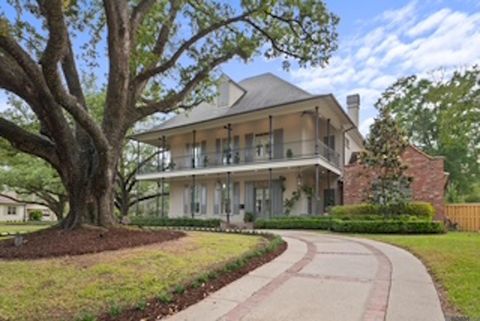
Active
$2,075,000
5
bds
|
6
ba
|
6,028
sqft
|
built
2018
1958 Ingleside Dr, Baton Rouge, LA 70808
$-4,852
Cash flow
-12.2%
Cash-on-Cash Return
2.9%
Cap rate
0.3%
Rent to Value Ratio
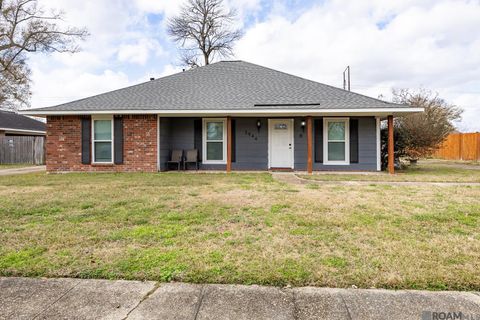
Active
$257,900
5
bds
|
3
ba
|
2,183
sqft
|
built
1979
1944 W Marsden Pl, Baton Rouge, LA 70816
$298
Cash flow
6.0%
Cash-on-Cash Return
7.1%
Cap rate
0.9%
Rent to Value Ratio

Active
$349,000
4
bds
|
4
ba
|
2,986
sqft
|
built
1977
3715 Lake La Berge Ct, Baton Rouge, LA 70816
$240
Cash flow
3.6%
Cash-on-Cash Return
6.5%
Cap rate
0.8%
Rent to Value Ratio

Active
$220,000
4
bds
|
2
ba
|
1,994
sqft
|
built
1967
12360 Warwick Ave, Baton Rouge, LA 70815
$335
Cash flow
7.9%
Cash-on-Cash Return
7.5%
Cap rate
0.9%
Rent to Value Ratio

Active
$155,000
3
bds
|
2
ba
|
1,185
sqft
|
built
1982
5224 Cumberland Cove Dr, Baton Rouge, LA 70817
$211
Cash flow
7.1%
Cash-on-Cash Return
7.3%
Cap rate
0.9%
Rent to Value Ratio

Active
$260,000
3
bds
|
3
ba
|
2,087
sqft
|
built
1968
1658 S Elaine Dr, Baton Rouge, LA 70815
$150
Cash flow
3.0%
Cash-on-Cash Return
6.4%
Cap rate
0.8%
Rent to Value Ratio
Active
$269,900
3
bds
|
2
ba
|
2,000
sqft
|
built
1963
10431 Goodwood Blvd, Baton Rouge, LA 70815
$103
Cash flow
2.0%
Cash-on-Cash Return
6.1%
Cap rate
0.7%
Rent to Value Ratio
Active
$250,000
3
bds
|
2
ba
|
2,820
sqft
|
built
1950
924 Valcour Dr, Baton Rouge, LA 70806
$335
Cash flow
7.0%
Cash-on-Cash Return
7.3%
Cap rate
0.9%
Rent to Value Ratio

Active
$303,000
4
bds
|
2
ba
|
2,506
sqft
|
built
1977
1124 Sharp Rd, Baton Rouge, LA 70815
$-399
Cash flow
-6.9%
Cash-on-Cash Return
4.1%
Cap rate
0.5%
Rent to Value Ratio
Active
$230,000
3
bds
|
3
ba
|
1,972
sqft
|
built
1972
346 Wilton Dr, Baton Rouge, LA 70815
$154
Cash flow
3.5%
Cash-on-Cash Return
6.5%
Cap rate
0.8%
Rent to Value Ratio

Active
$299,000
3
bds
|
2
ba
|
2,038
sqft
|
built
1954
5954 Eastwood Dr, Baton Rouge, LA 70806
$103
Cash flow
1.8%
Cash-on-Cash Return
6.1%
Cap rate
0.7%
Rent to Value Ratio
Active
$135,000
3
bds
|
1
ba
|
1,200
sqft
|
built
1980
5712 Beechwood Dr, Baton Rouge, LA 70805
$258
Cash flow
10.0%
Cash-on-Cash Return
8.0%
Cap rate
1.0%
Rent to Value Ratio

Active
$208,000
3
bds
|
2
ba
|
1,570
sqft
|
built
1979
16945 Ticonderoga Ave, Baton Rouge, LA 70817
$258
Cash flow
6.5%
Cash-on-Cash Return
7.2%
Cap rate
0.9%
Rent to Value Ratio

Active
$499,900
5
bds
|
4
ba
|
3,523
sqft
|
built
1976
1411 Twisted Oak Ln, Baton Rouge, LA 70810
$-158
Cash flow
-1.6%
Cash-on-Cash Return
5.3%
Cap rate
0.6%
Rent to Value Ratio

Active
$155,000
4
bds
|
2
ba
|
1,220
sqft
|
built
1976
2756 74th Ave, Baton Rouge, LA 70807
$301
Cash flow
10.1%
Cash-on-Cash Return
8.0%
Cap rate
1.0%
Rent to Value Ratio

Active
$299,500
3
bds
|
2
ba
|
1,894
sqft
|
built
1975
2413 Guilford Dr, Baton Rouge, LA 70808
$-37
Cash flow
-0.6%
Cash-on-Cash Return
5.5%
Cap rate
0.7%
Rent to Value Ratio

Active
$425,000
4
bds
|
4
ba
|
3,403
sqft
|
built
1979
5532 Summer Lake Dr, Baton Rouge, LA 70817
$186
Cash flow
2.3%
Cash-on-Cash Return
6.2%
Cap rate
0.8%
Rent to Value Ratio

Active
$225,000
3
bds
|
2
ba
|
1,488
sqft
|
built
1981
1636 W Fairview Dr, Baton Rouge, LA 70816
$174
Cash flow
4.0%
Cash-on-Cash Return
6.6%
Cap rate
0.8%
Rent to Value Ratio

Active
$235,000
3
bds
|
2
ba
|
1,439
sqft
|
built
1983
17558 Diversion Dr, Baton Rouge, LA 70817
$268
Cash flow
6.0%
Cash-on-Cash Return
7.0%
Cap rate
0.9%
Rent to Value Ratio

Active
$210,000
3
bds
|
2
ba
|
1,399
sqft
|
built
1984
10626 Clearview Ave, Baton Rouge, LA 70811
$110
Cash flow
2.7%
Cash-on-Cash Return
6.3%
Cap rate
0.8%
Rent to Value Ratio

Active
$326,500
4
bds
|
3
ba
|
2,209
sqft
|
built
1988
16028 Shenandoah Ave, Baton Rouge, LA 70817
$-30
Cash flow
-0.5%
Cash-on-Cash Return
5.6%
Cap rate
0.7%
Rent to Value Ratio

Active
$175,000
4
bds
|
2
ba
|
1,456
sqft
|
built
1964
14960 S Chalfont Dr, Baton Rouge, LA 70819
$276
Cash flow
8.2%
Cash-on-Cash Return
7.6%
Cap rate
0.9%
Rent to Value Ratio

Active
$211,000
3
bds
|
2
ba
|
1,581
sqft
|
built
1982
350 Misty Creek Dr, Baton Rouge, LA 70808
$243
Cash flow
6.0%
Cash-on-Cash Return
7.1%
Cap rate
0.9%
Rent to Value Ratio

Active
$215,000
3
bds
|
2
ba
|
1,644
sqft
|
built
1996
4162 Jefferson Woods Dr, Baton Rouge, LA 70809
$41
Cash flow
1.0%
Cash-on-Cash Return
5.9%
Cap rate
0.8%
Rent to Value Ratio

Active
$259,000
4
bds
|
2
ba
|
2,210
sqft
|
built
1966
13574 Reed Ave, Baton Rouge, LA 70818
$154
Cash flow
3.1%
Cash-on-Cash Return
6.4%
Cap rate
0.8%
Rent to Value Ratio
Active
$410,000
4
bds
|
3
ba
|
2,242
sqft
|
built
1985
6346 Belle Grove Dr, Baton Rouge, LA 70820
$-353
Cash flow
-4.5%
Cash-on-Cash Return
4.6%
Cap rate
0.6%
Rent to Value Ratio

Active
$224,000
3
bds
|
2
ba
|
2,128
sqft
|
built
1965
12487 Greenwell Springs Rd, Baton Rouge, LA 70814
$182
Cash flow
4.2%
Cash-on-Cash Return
6.7%
Cap rate
0.8%
Rent to Value Ratio

Active
$120,000
2
bds
|
1
ba
|
980
sqft
|
built
1989
4762 Clayton Dr, Baton Rouge, LA 70805
$329
Cash flow
14.3%
Cash-on-Cash Return
9.0%
Cap rate
1.1%
Rent to Value Ratio

Active
$574,900
4
bds
|
3
ba
|
3,048
sqft
|
built
2003
6314 Morgan Bend Dr, Baton Rouge, LA 70820
$-799
Cash flow
-7.3%
Cash-on-Cash Return
4.0%
Cap rate
0.5%
Rent to Value Ratio

Active
$945,000
4
bds
|
4
ba
|
3,642
sqft
|
built
2006
19452 Oak Park Ct, Baton Rouge, LA 70809
$-2,038
Cash flow
-11.3%
Cash-on-Cash Return
3.1%
Cap rate
0.4%
Rent to Value Ratio

Active
$1,750,000
6
bds
|
8
ba
|
6,151
sqft
|
built
1997
837 Myrtle View Dr, Baton Rouge, LA 70810
$-3,866
Cash flow
-11.5%
Cash-on-Cash Return
3.0%
Cap rate
0.4%
Rent to Value Ratio
Active
$355,000
3
bds
|
2
ba
|
2,153
sqft
|
built
1995
12940 Carrington Place Ave, Baton Rouge, LA 70817
$-167
Cash flow
-2.5%
Cash-on-Cash Return
5.1%
Cap rate
0.6%
Rent to Value Ratio

Active
$4,995,000
6
bds
|
7
ba
|
8,204
sqft
|
built
2000
19614 S Muirfield Cir, Baton Rouge, LA 70810
$-19,566
Cash flow
-20.4%
Cash-on-Cash Return
1.0%
Cap rate
0.1%
Rent to Value Ratio

Active
$237,000
3
bds
|
2
ba
|
1,430
sqft
|
built
1999
9527 Greenchase Dr, Baton Rouge, LA 70810
$47
Cash flow
1.0%
Cash-on-Cash Return
5.9%
Cap rate
0.7%
Rent to Value Ratio
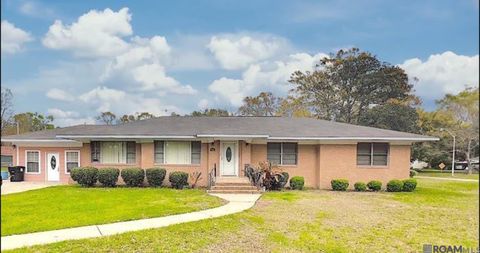
Active
$220,000
3
bds
|
3
ba
|
2,494
sqft
|
built
1960
2425 Harding Blvd, Baton Rouge, LA 70807
$339
Cash flow
8.0%
Cash-on-Cash Return
7.5%
Cap rate
0.9%
Rent to Value Ratio

Active
$305,000
3
bds
|
3
ba
|
1,700
sqft
|
built
1962
8265 Boone Ave, Baton Rouge, LA 70808
$-63
Cash flow
-1.1%
Cash-on-Cash Return
5.4%
Cap rate
0.7%
Rent to Value Ratio
Active
$125,000
3
bds
|
1
ba
|
1,125
sqft
|
built
1970
2365 Desoto Dr, Baton Rouge, LA 70807
$305
Cash flow
12.7%
Cash-on-Cash Return
8.6%
Cap rate
1.0%
Rent to Value Ratio

Active
$399,000
5
bds
|
3
ba
|
2,704
sqft
|
built
1959
10256 Lovett Rd, Baton Rouge, LA 70818
$251
Cash flow
3.3%
Cash-on-Cash Return
6.4%
Cap rate
0.8%
Rent to Value Ratio
Active
$85,000
bds
|
0
ba
|
3,150
sqft
|
built
1118 Convention St, Baton Rouge, LA 70802
$840
Cash flow
51.6%
Cash-on-Cash Return
17.5%
Cap rate
2.1%
Rent to Value Ratio