Belmont, CA Investment Properties for Sale
Browse homes for sale and investment properties in Belmont, CA. Refine your search by price, property type, or more.
Best cash flowing properties in Belmont, CA
Active
$1,150,000
3
bds
|
2
ba
|
1,585
sqft
|
built
1992
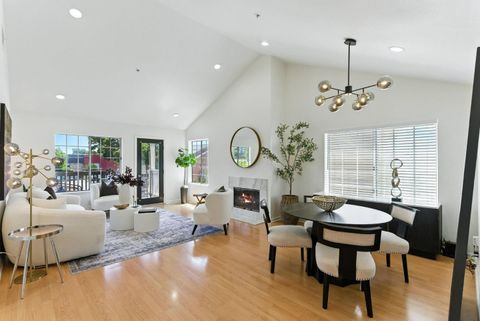
935 Old County Rd, Belmont, CA 94002
$-2,926
Cash flow
-13.3%
Cash-on-Cash Return
3.0%
Cap rate
0.4%
Rent to Value Ratio
Active
$1,378,888
3
bds
|
3
ba
|
1,970
sqft
|
built
1980
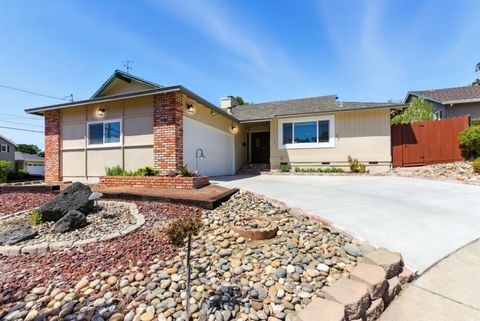
2411 Carlmont Dr, Belmont, CA 94002
$-3,883
Cash flow
-14.7%
Cash-on-Cash Return
2.7%
Cap rate
0.4%
Rent to Value Ratio
6 out of 7 properties for sale in Belmont, CA
Limited Results Shown
Create a free account, or log in to reveal all property listings and enjoy the complete experience.

Active
$3,828,328
5
bds
|
4
ba
|
3,050
sqft
|
built
1964
2721 Comstock Cir, Belmont, CA 94002
$-13,976
Cash flow
-19.0%
Cash-on-Cash Return
1.7%
Cap rate
0.2%
Rent to Value Ratio
Active
$2,198,000
3
bds
|
2
ba
|
1,460
sqft
|
built
1964
1 Dionne Ct, Belmont, CA 94002
$-6,767
Cash flow
-16.1%
Cash-on-Cash Return
2.4%
Cap rate
0.3%
Rent to Value Ratio
Active
$3,188,888
5
bds
|
4
ba
|
3,271
sqft
|
built
1990
2774 Belmont Canyon Rd, Belmont, CA 94002
$-9,984
Cash flow
-16.3%
Cash-on-Cash Return
2.3%
Cap rate
0.3%
Rent to Value Ratio
Active
$1,443,000
2
bds
|
3
ba
|
1,409
sqft
|
built
2005
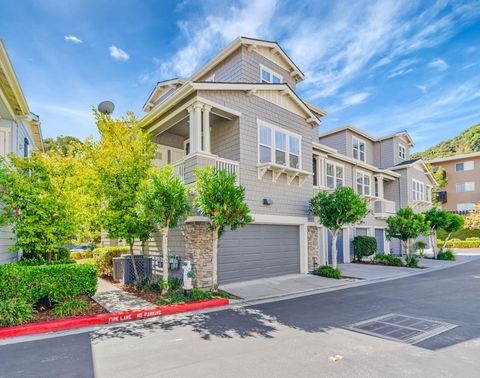
100 Live Oak Way, Belmont, CA 94002
$-4,321
Cash flow
-15.6%
Cash-on-Cash Return
2.5%
Cap rate
0.3%
Rent to Value Ratio