Belmont, CA Investment Properties for Sale
Browse homes for sale and investment properties in Belmont, CA. Refine your search by price, property type, or more.
Best cash flowing properties in Belmont, CA
Active
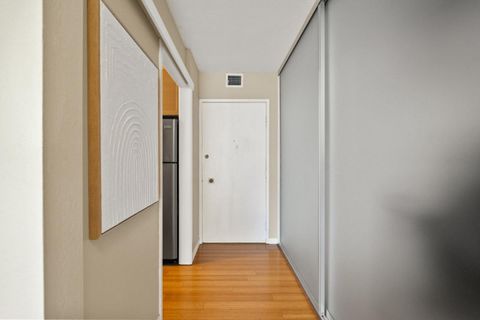
$545,000
1
bds
|
1
ba
|
722
sqft
|
built
1965
300 Davey Glen Rd, Belmont, CA 94002
$-1,421
Cash flow
-13.6%
Cash-on-Cash Return
2.9%
Cap rate
0.5%
Rent to Value Ratio
Active
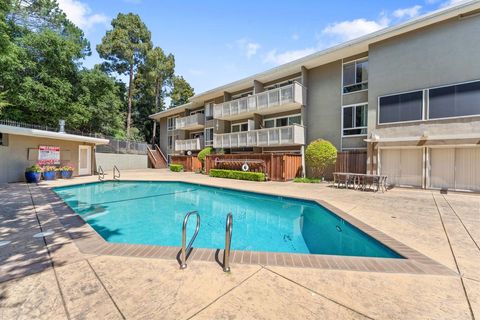
$499,000
1
bds
|
1
ba
|
740
sqft
|
built
1967
1101 Continentals Way, Belmont, CA 94002
$-1,468
Cash flow
-15.3%
Cash-on-Cash Return
2.5%
Cap rate
0.5%
Rent to Value Ratio
19 out of 20 properties for sale in Belmont, CA
Limited Results Shown
Create a free account, or log in to reveal all property listings and enjoy the complete experience.
Active
$545,000
1
bds
|
1
ba
|
722
sqft
|
built
1965
300 Davey Glen Rd, Belmont, CA 94002
$-1,421
Cash flow
-13.6%
Cash-on-Cash Return
2.9%
Cap rate
0.5%
Rent to Value Ratio
Active
$2,338,000
3
bds
|
3
ba
|
1,805
sqft
|
built
1952
2009 Lyon Ave, Belmont, CA 94002
$-8,717
Cash flow
-19.5%
Cash-on-Cash Return
1.6%
Cap rate
0.2%
Rent to Value Ratio
Pending
$3,880,000
5
bds
|
3
ba
|
2,750
sqft
|
built
1970
6 Waterloo Ct, Belmont, CA 94002
$-14,168
Cash flow
-19.1%
Cash-on-Cash Return
1.7%
Cap rate
0.2%
Rent to Value Ratio
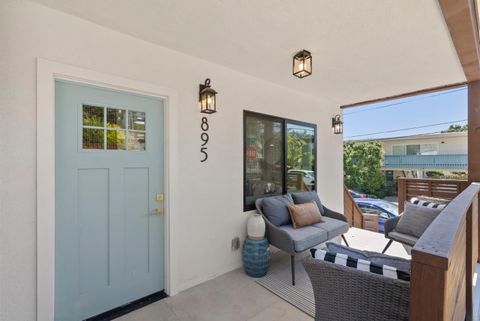
Active
$2,099,000
4
bds
|
3
ba
|
1,788
sqft
|
built
1928
895 Laurel Ave, Belmont, CA 94002
$-8,130
Cash flow
-20.2%
Cash-on-Cash Return
1.4%
Cap rate
0.2%
Rent to Value Ratio
Pending
$3,298,000
4
bds
|
3
ba
|
2,670
sqft
|
built
1968
2816 Benson Way, Belmont, CA 94002
$-11,363
Cash flow
-18.0%
Cash-on-Cash Return
1.9%
Cap rate
0.2%
Rent to Value Ratio
Pending
$2,799,000
5
bds
|
3
ba
|
3,077
sqft
|
built
1959
2109 Arthur Ave, Belmont, CA 94002
$-8,633
Cash flow
-16.1%
Cash-on-Cash Return
2.4%
Cap rate
0.3%
Rent to Value Ratio
Pending
$1,455,000
3
bds
|
2
ba
|
1,250
sqft
|
built
1953
602 Chesterton Ave, Belmont, CA 94002
$-3,838
Cash flow
-13.8%
Cash-on-Cash Return
2.9%
Cap rate
0.4%
Rent to Value Ratio
Active
$499,000
1
bds
|
1
ba
|
740
sqft
|
built
1967
1101 Continentals Way, Belmont, CA 94002
$-1,468
Cash flow
-15.3%
Cash-on-Cash Return
2.5%
Cap rate
0.5%
Rent to Value Ratio
Active
$898,000
1
bds
|
1
ba
|
883
sqft
|
built
2019
400 El Camino Real, Belmont, CA 94002
$-2,187
Cash flow
-12.7%
Cash-on-Cash Return
3.1%
Cap rate
0.5%
Rent to Value Ratio
Active
$3,000,000
3
bds
|
2
ba
|
2,980
sqft
|
built
1948
1720 Hillman Ave, Belmont, CA 94002
$-10,202
Cash flow
-17.7%
Cash-on-Cash Return
2.0%
Cap rate
0.2%
Rent to Value Ratio
Active
$2,498,000
3
bds
|
2
ba
|
1,930
sqft
|
built
1960
224 Lyndhurst Ave, Belmont, CA 94002
$-7,870
Cash flow
-16.4%
Cash-on-Cash Return
2.3%
Cap rate
0.3%
Rent to Value Ratio
Pending
$1,722,000
3
bds
|
2
ba
|
1,410
sqft
|
built
1953
511 Marine View Ave, Belmont, CA 94002
$-4,912
Cash flow
-14.9%
Cash-on-Cash Return
2.6%
Cap rate
0.3%
Rent to Value Ratio
Active
$2,488,000
3
bds
|
2
ba
|
1,920
sqft
|
built
1929
1564 Molitor Rd, Belmont, CA 94002
$-8,165
Cash flow
-17.1%
Cash-on-Cash Return
2.1%
Cap rate
0.3%
Rent to Value Ratio
Pending
$1,498,000
2
bds
|
1
ba
|
1,280
sqft
|
built
1962
3705 Encline Way, Belmont, CA 94002
$-3,780
Cash flow
-13.2%
Cash-on-Cash Return
3.0%
Cap rate
0.4%
Rent to Value Ratio
Active
$1,488,000
3
bds
|
2
ba
|
1,377
sqft
|
built
2019
600 El Camino Real, Belmont, CA 94002
$-4,130
Cash flow
-14.5%
Cash-on-Cash Return
2.7%
Cap rate
0.4%
Rent to Value Ratio
Pending
$2,388,000
3
bds
|
2
ba
|
1,710
sqft
|
built
1959
3300 Plateau Dr, Belmont, CA 94002
$-6,693
Cash flow
-14.6%
Cash-on-Cash Return
2.7%
Cap rate
0.3%
Rent to Value Ratio
Active
$2,898,000
4
bds
|
3
ba
|
2,310
sqft
|
built
1965
1220 Chula Vista Dr, Belmont, CA 94002
$-9,686
Cash flow
-17.4%
Cash-on-Cash Return
2.1%
Cap rate
0.2%
Rent to Value Ratio
Active
$1,640,000
3
bds
|
3
ba
|
1,770
sqft
|
built
2019
400 El Camino Real, Belmont, CA 94002
$-3,400
Cash flow
-10.8%
Cash-on-Cash Return
3.6%
Cap rate
0.5%
Rent to Value Ratio
Active
$1,798,000
4
bds
|
4
ba
|
2,270
sqft
|
built
1990
366 Treasure Island Dr, Belmont, CA 94002
$-5,494
Cash flow
-15.9%
Cash-on-Cash Return
2.4%
Cap rate
0.4%
Rent to Value Ratio