Biloxi, MS Investment Properties for Sale
Browse homes for sale and investment properties in Biloxi, MS. Refine your search by price, property type, or more.
Best cash flowing properties in Biloxi, MS
Active
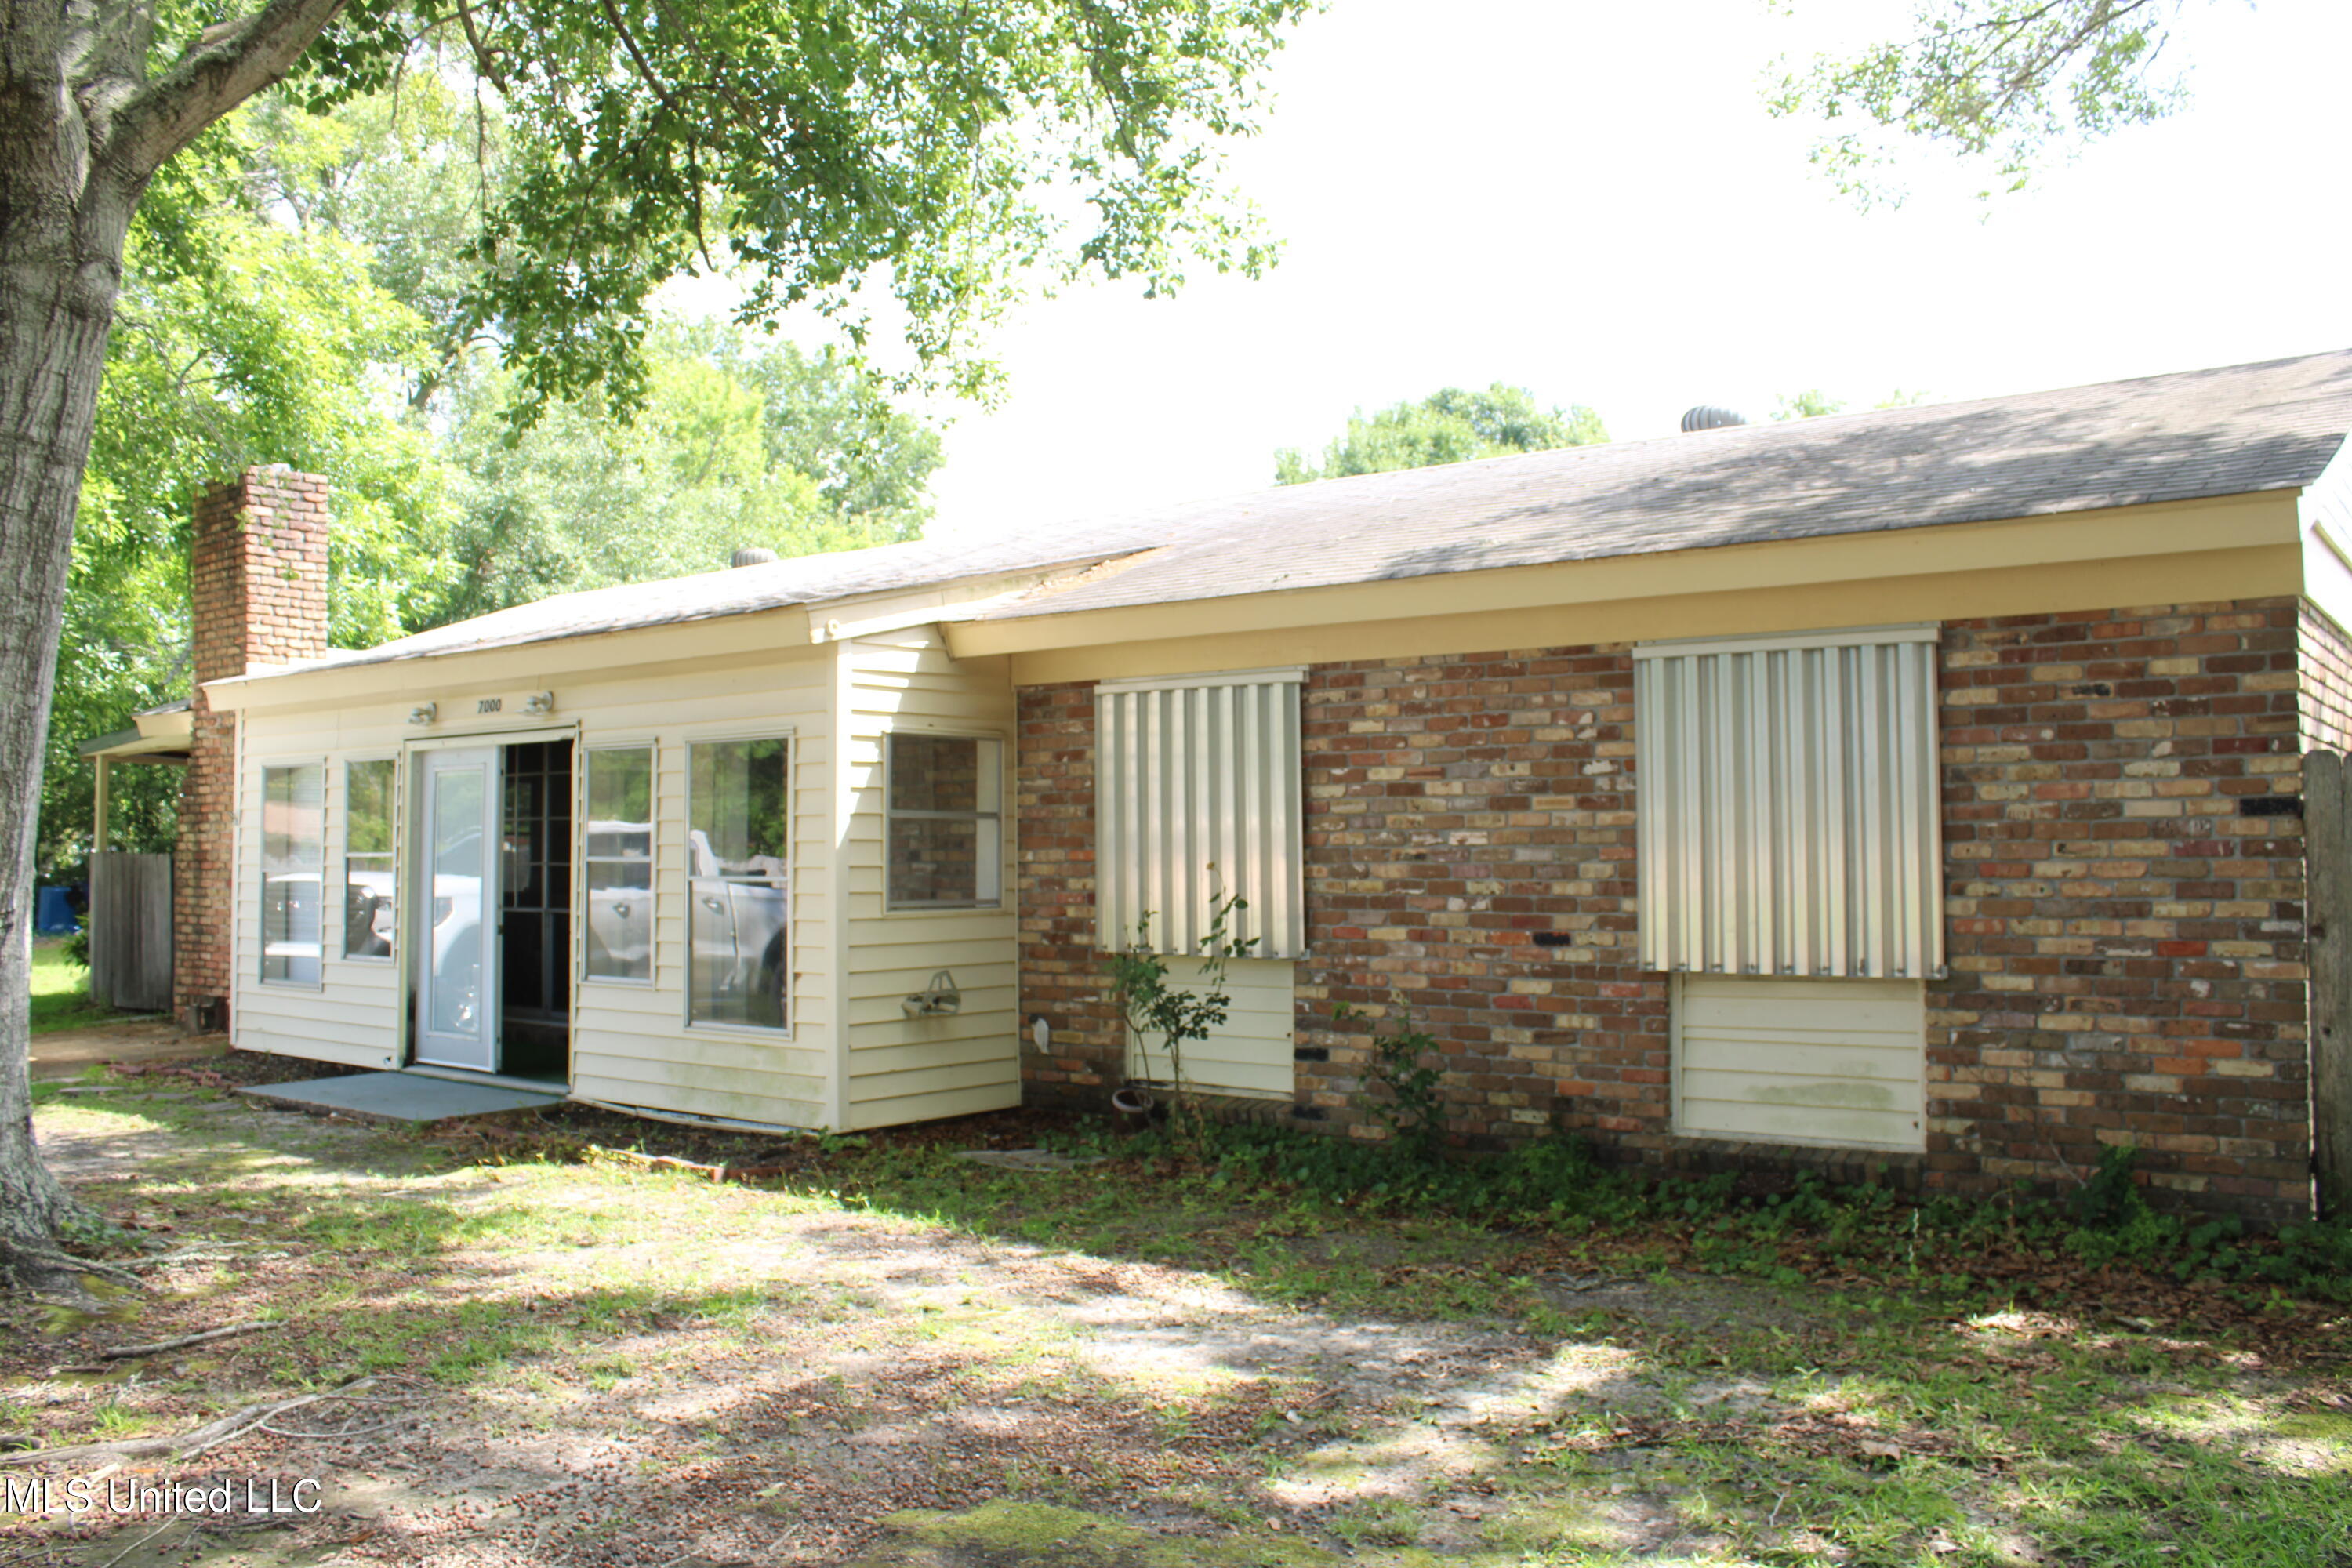
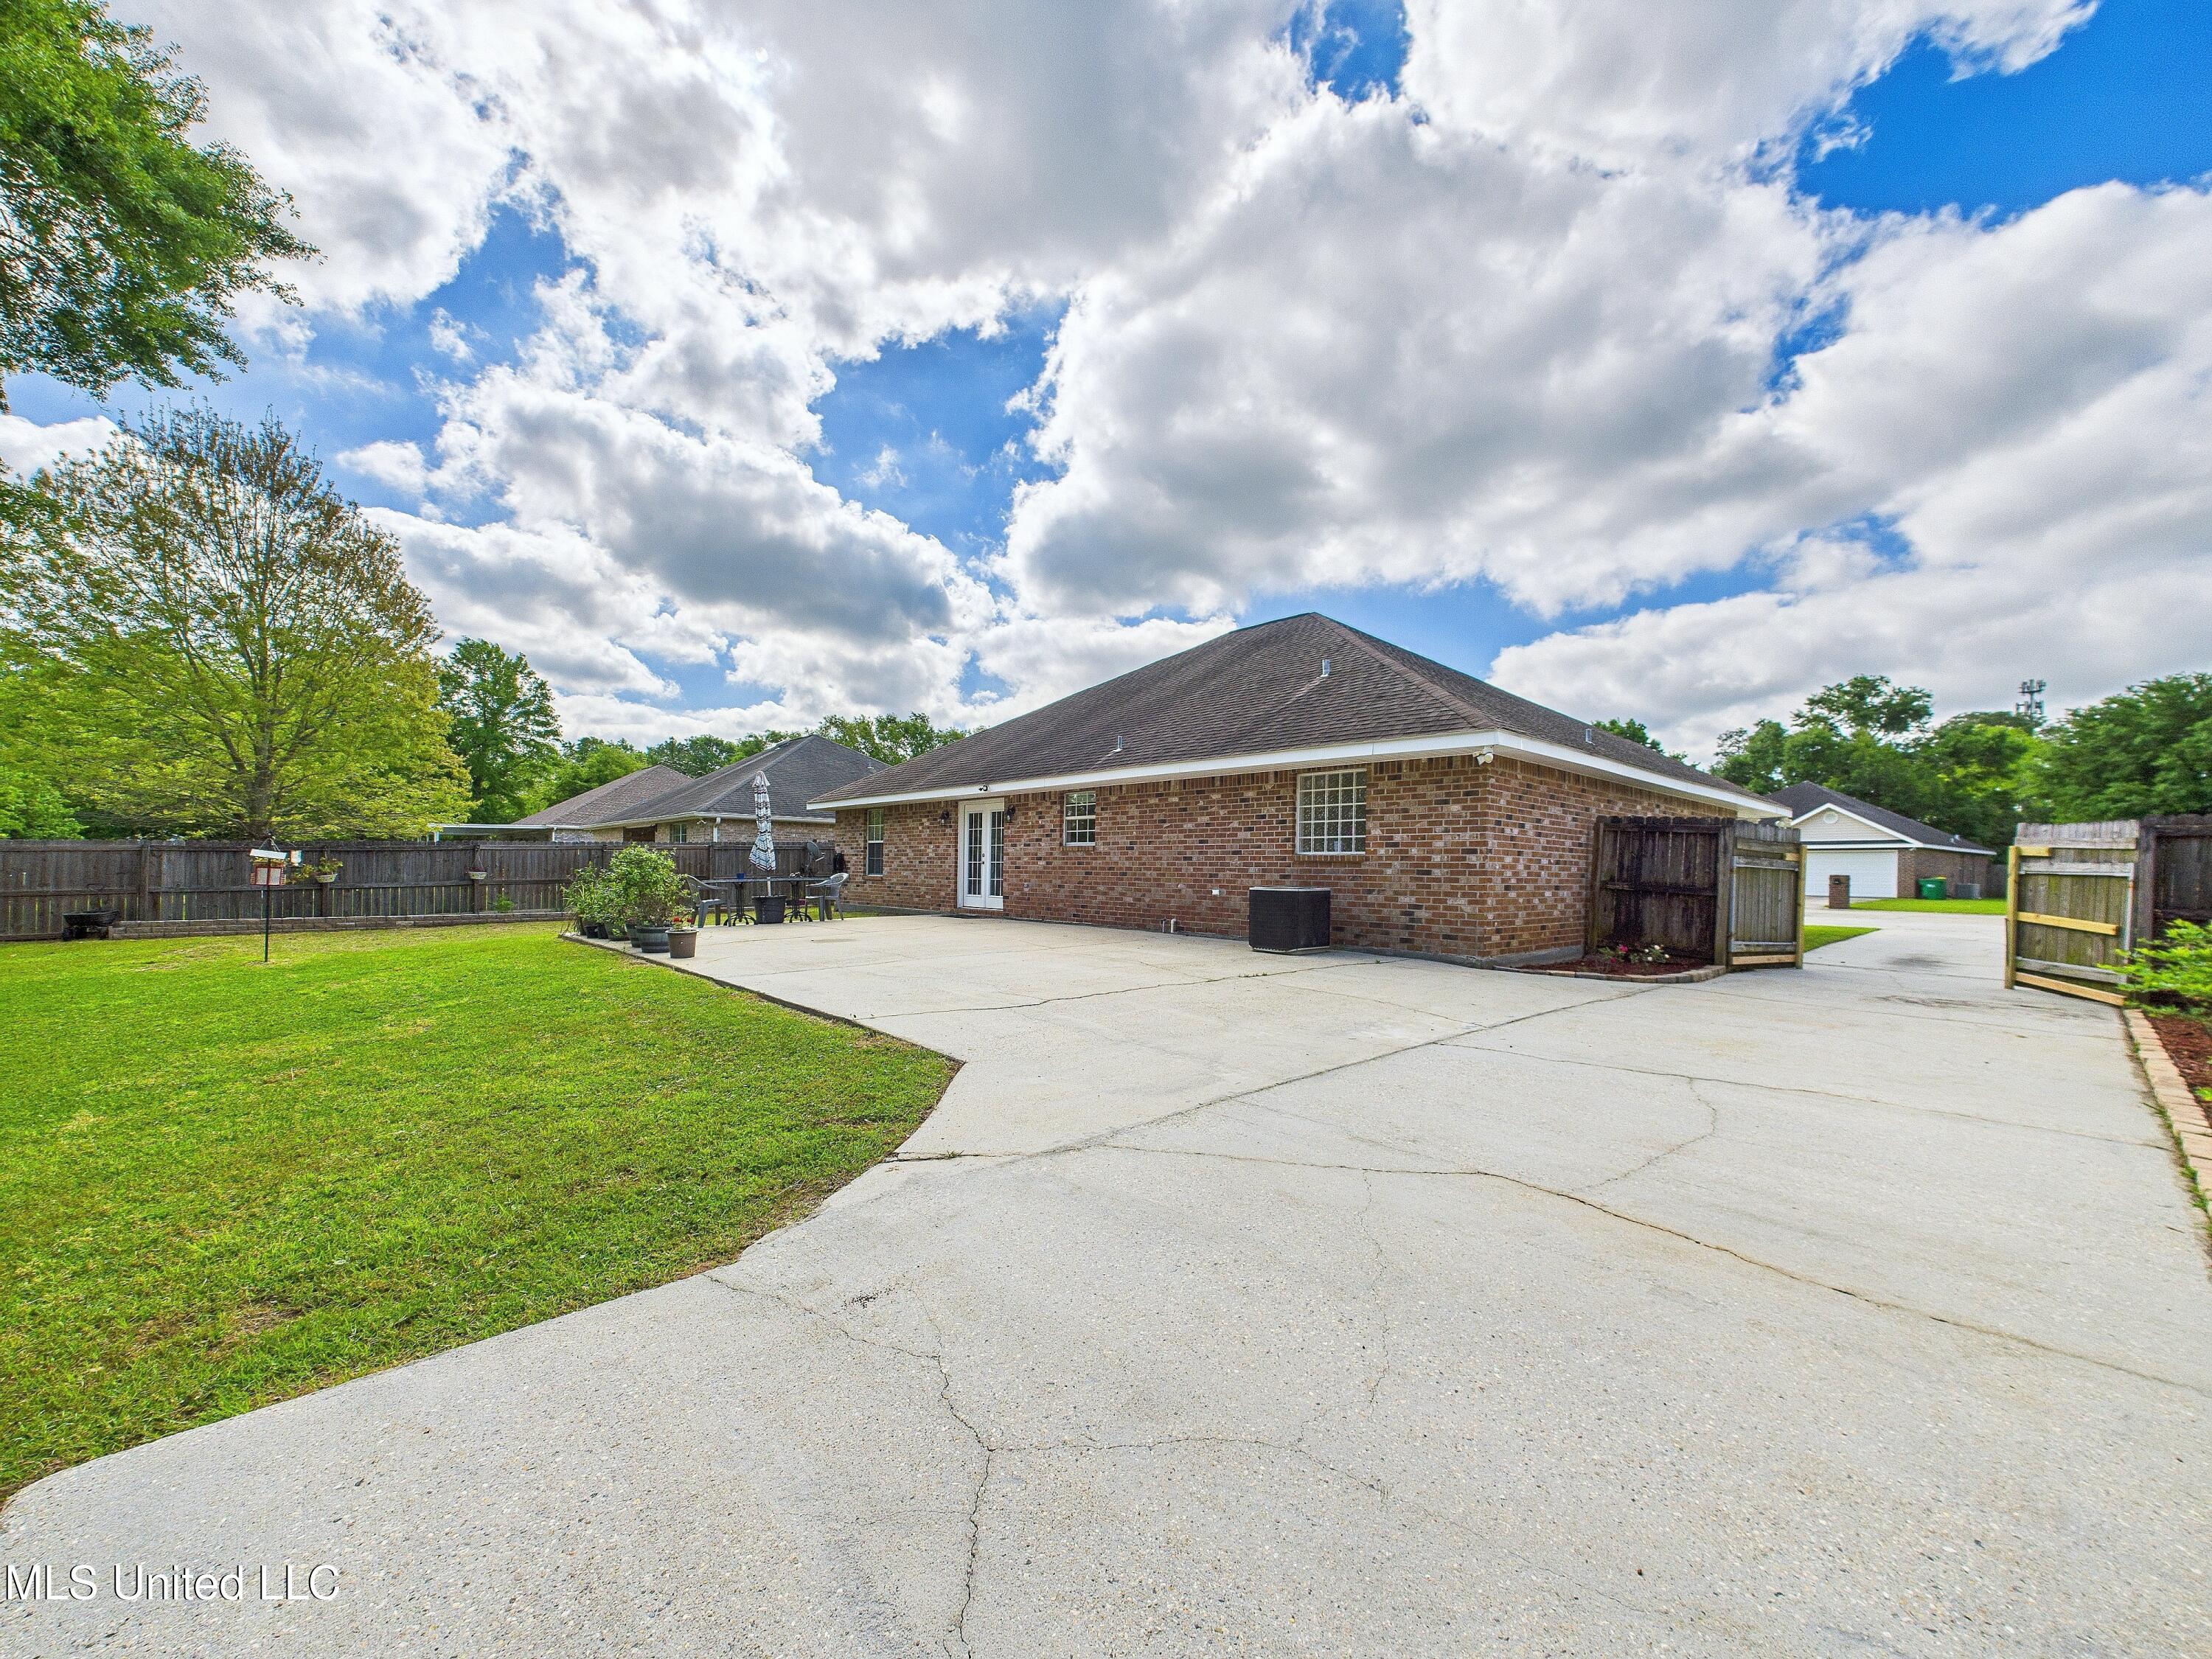
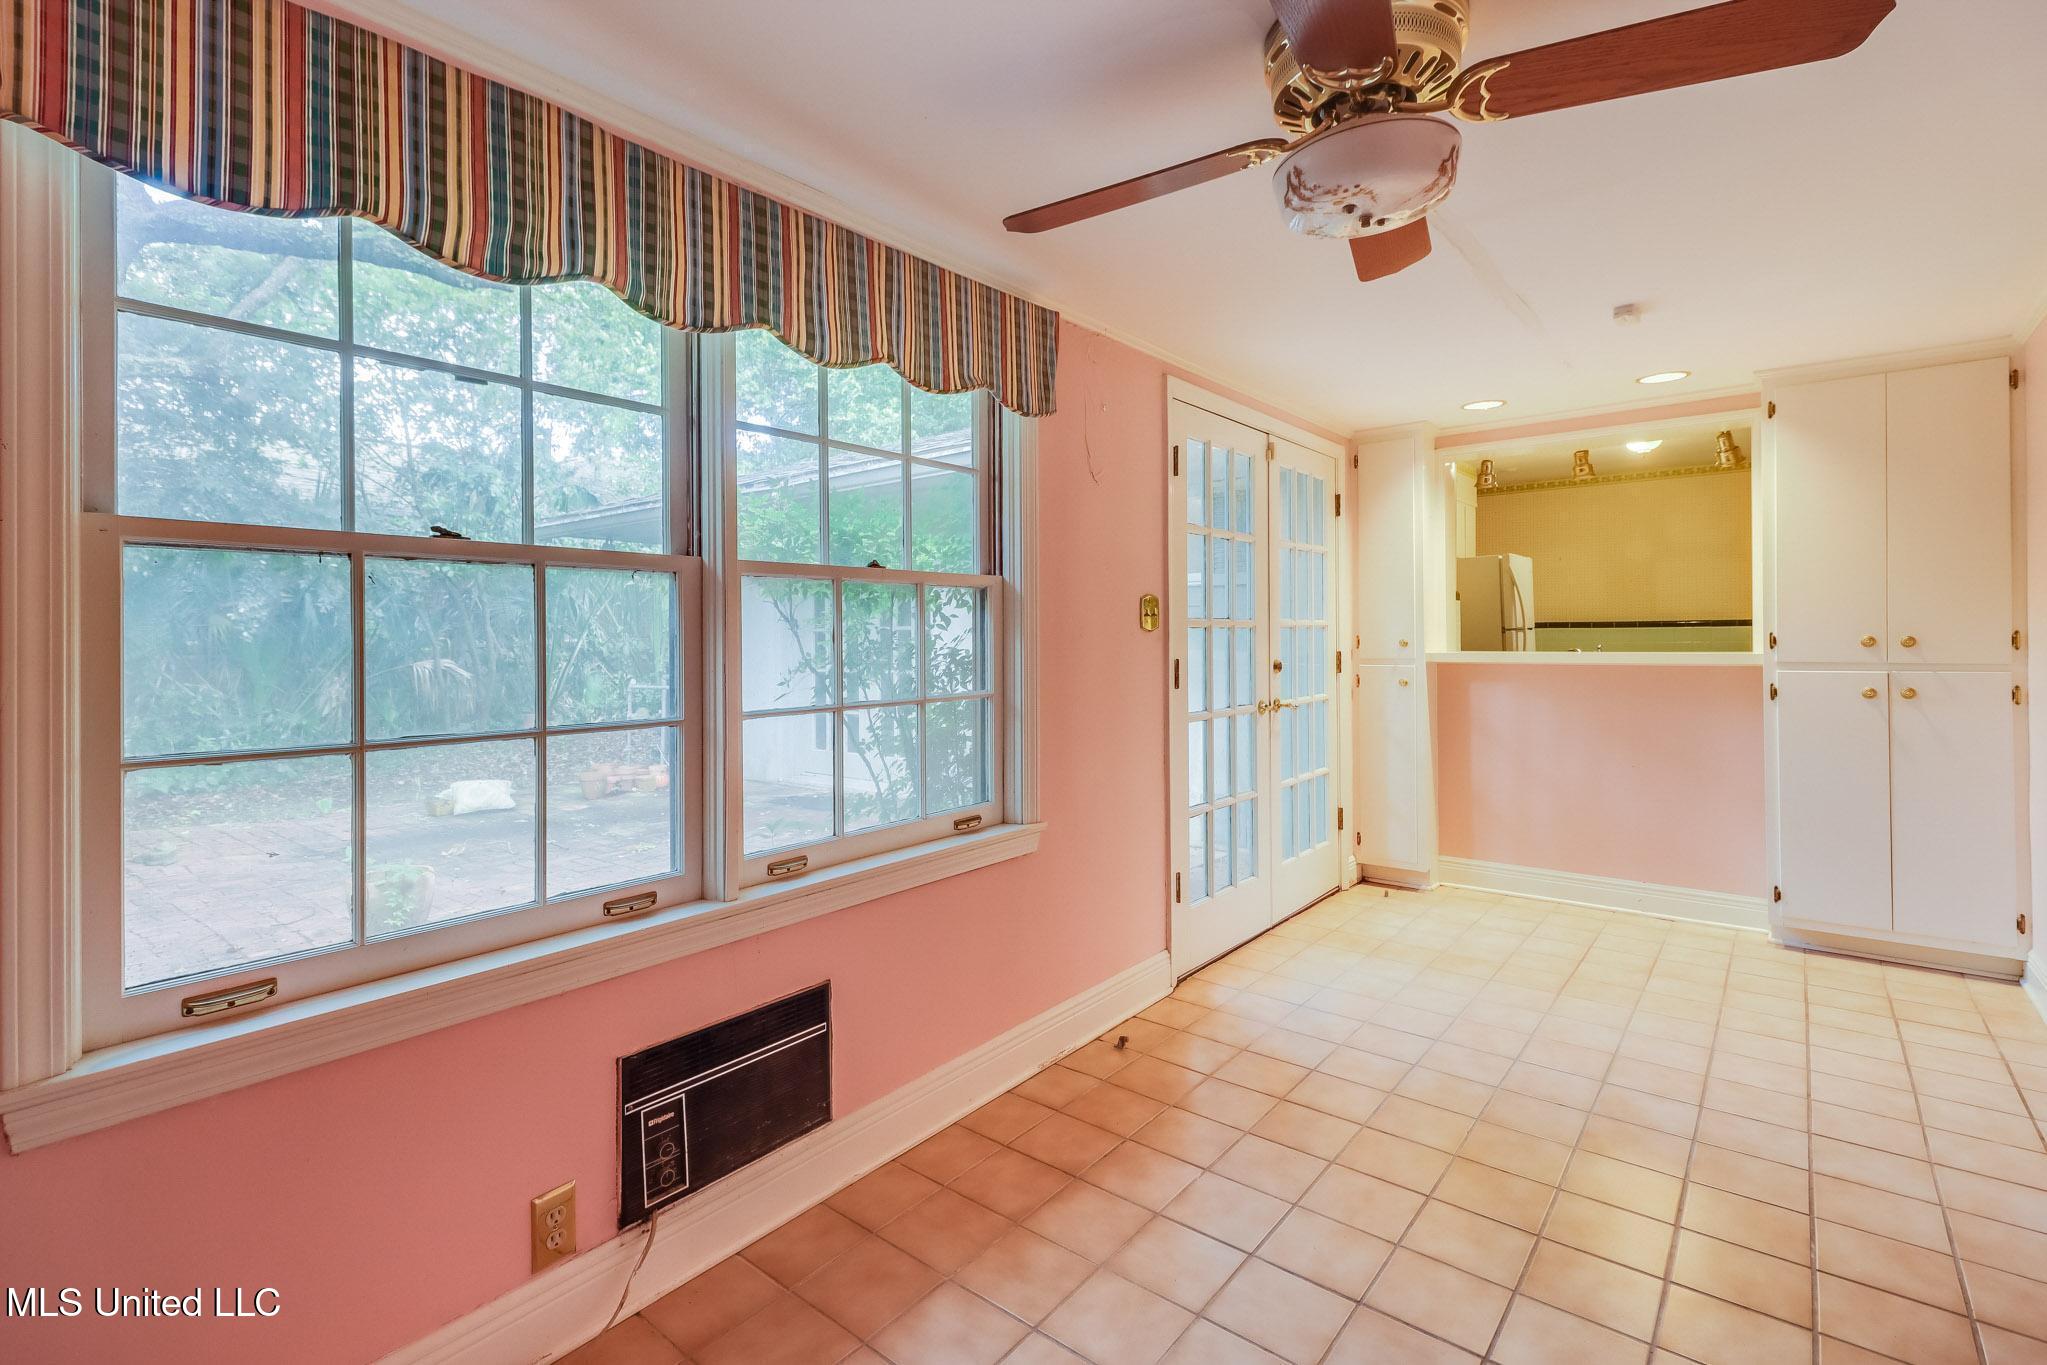
$130,000
2
bds
|
3
ba
|
0
sqft
|
built
1965
7000 Melrose Dr, Biloxi, MS 39532
$413
Cash flow
16.6%
Cash-on-Cash Return
10.1%
Cap rate
1.4%
Rent to Value Ratio

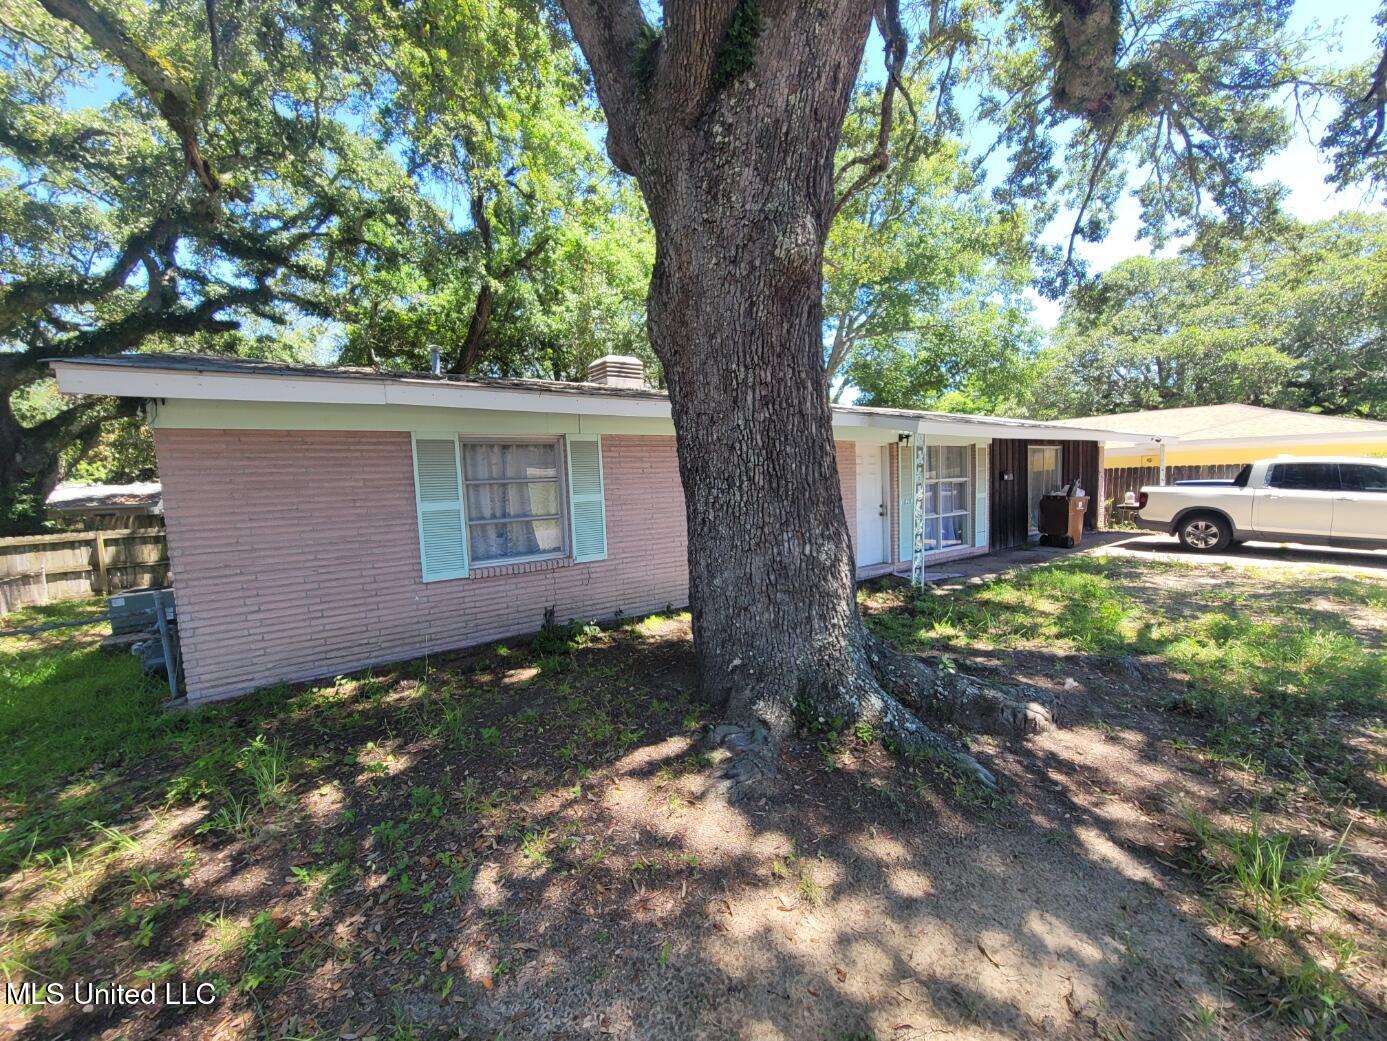
Active
$105,000
2
bds
|
1
ba
|
0
sqft
|
built
1950
15917 Van Eaton Cir, Biloxi, MS 39532
$252
Cash flow
12.5%
Cash-on-Cash Return
9.2%
Cap rate
1.2%
Rent to Value Ratio
224 out of 247 properties for sale in Biloxi, MS
Limited Results Shown
Create a free account, or log in to reveal all property listings and enjoy the complete experience.

Active
$330,900
4
bds
|
2
ba
|
0
sqft
|
built
2006
15069 Greenwell Cir, Biloxi, MS 39532
$-166
Cash flow
-2.6%
Cash-on-Cash Return
5.7%
Cap rate
0.7%
Rent to Value Ratio
Active
$130,000
2
bds
|
3
ba
|
0
sqft
|
built
1965
7000 Melrose Dr, Biloxi, MS 39532
$413
Cash flow
16.6%
Cash-on-Cash Return
10.1%
Cap rate
1.4%
Rent to Value Ratio
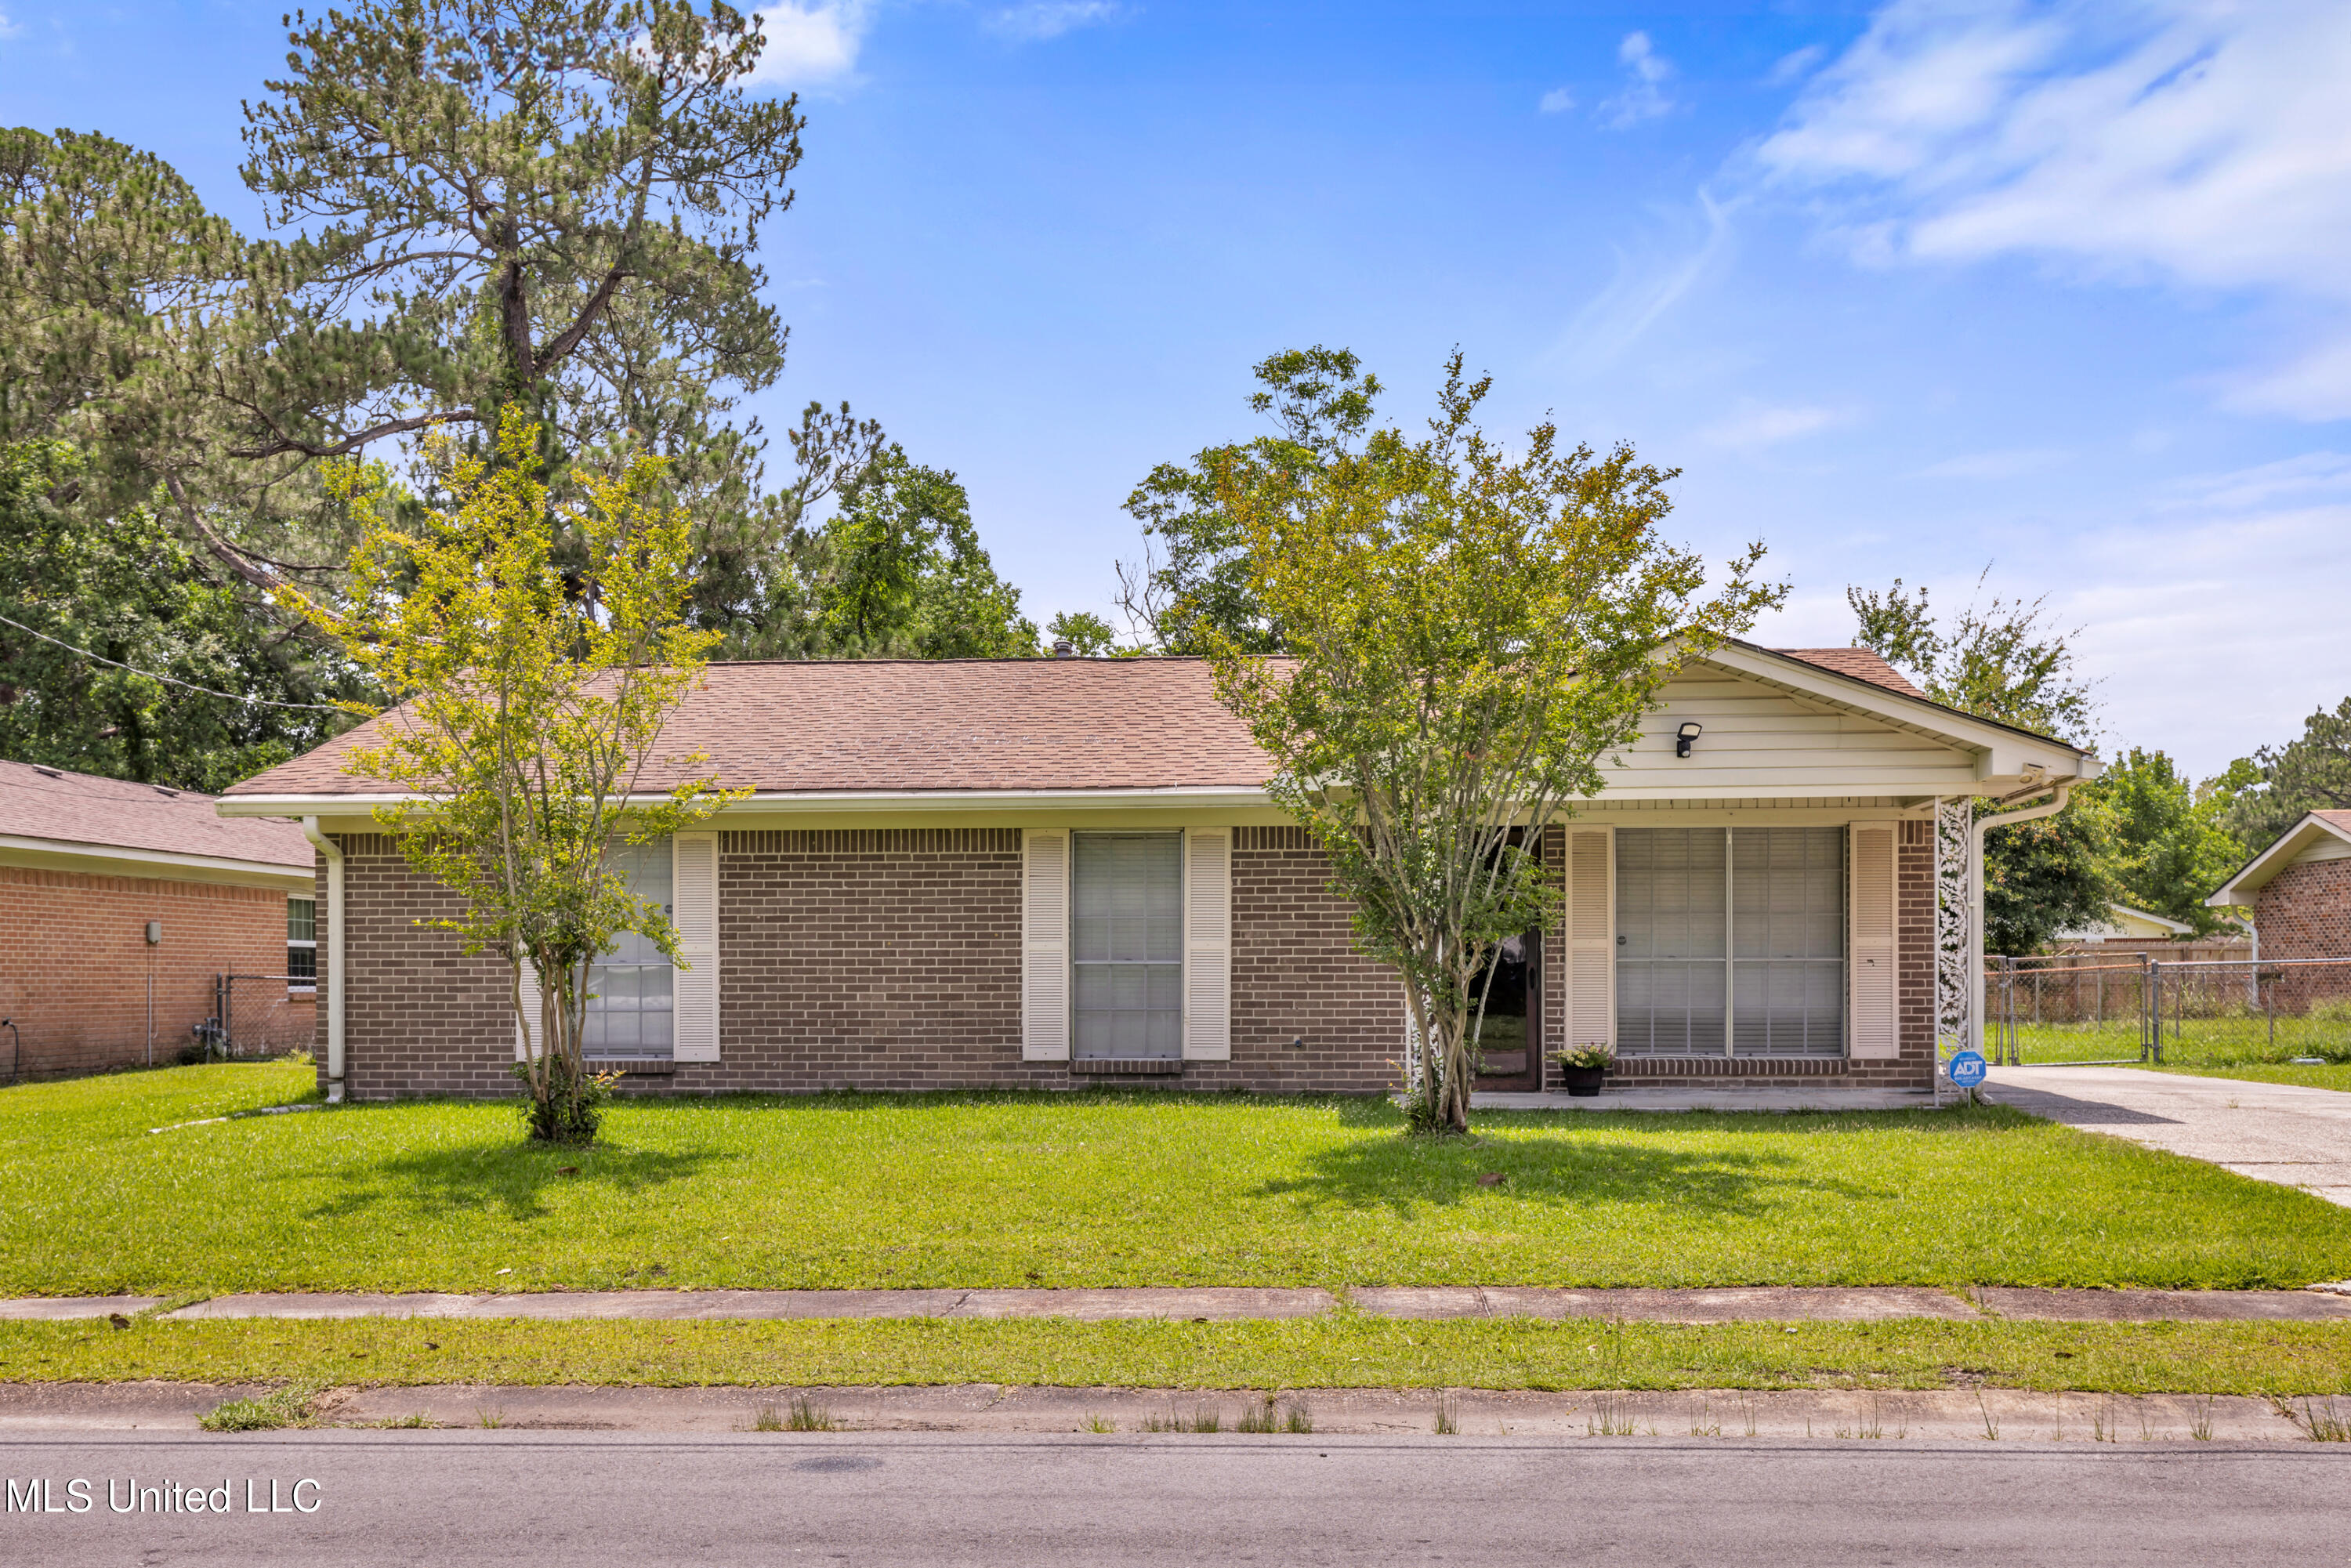
Active
$179,000
4
bds
|
2
ba
|
0
sqft
|
built
1968
7105 Mandarin Dr, Biloxi, MS 39532
$117
Cash flow
3.4%
Cash-on-Cash Return
7.1%
Cap rate
0.9%
Rent to Value Ratio
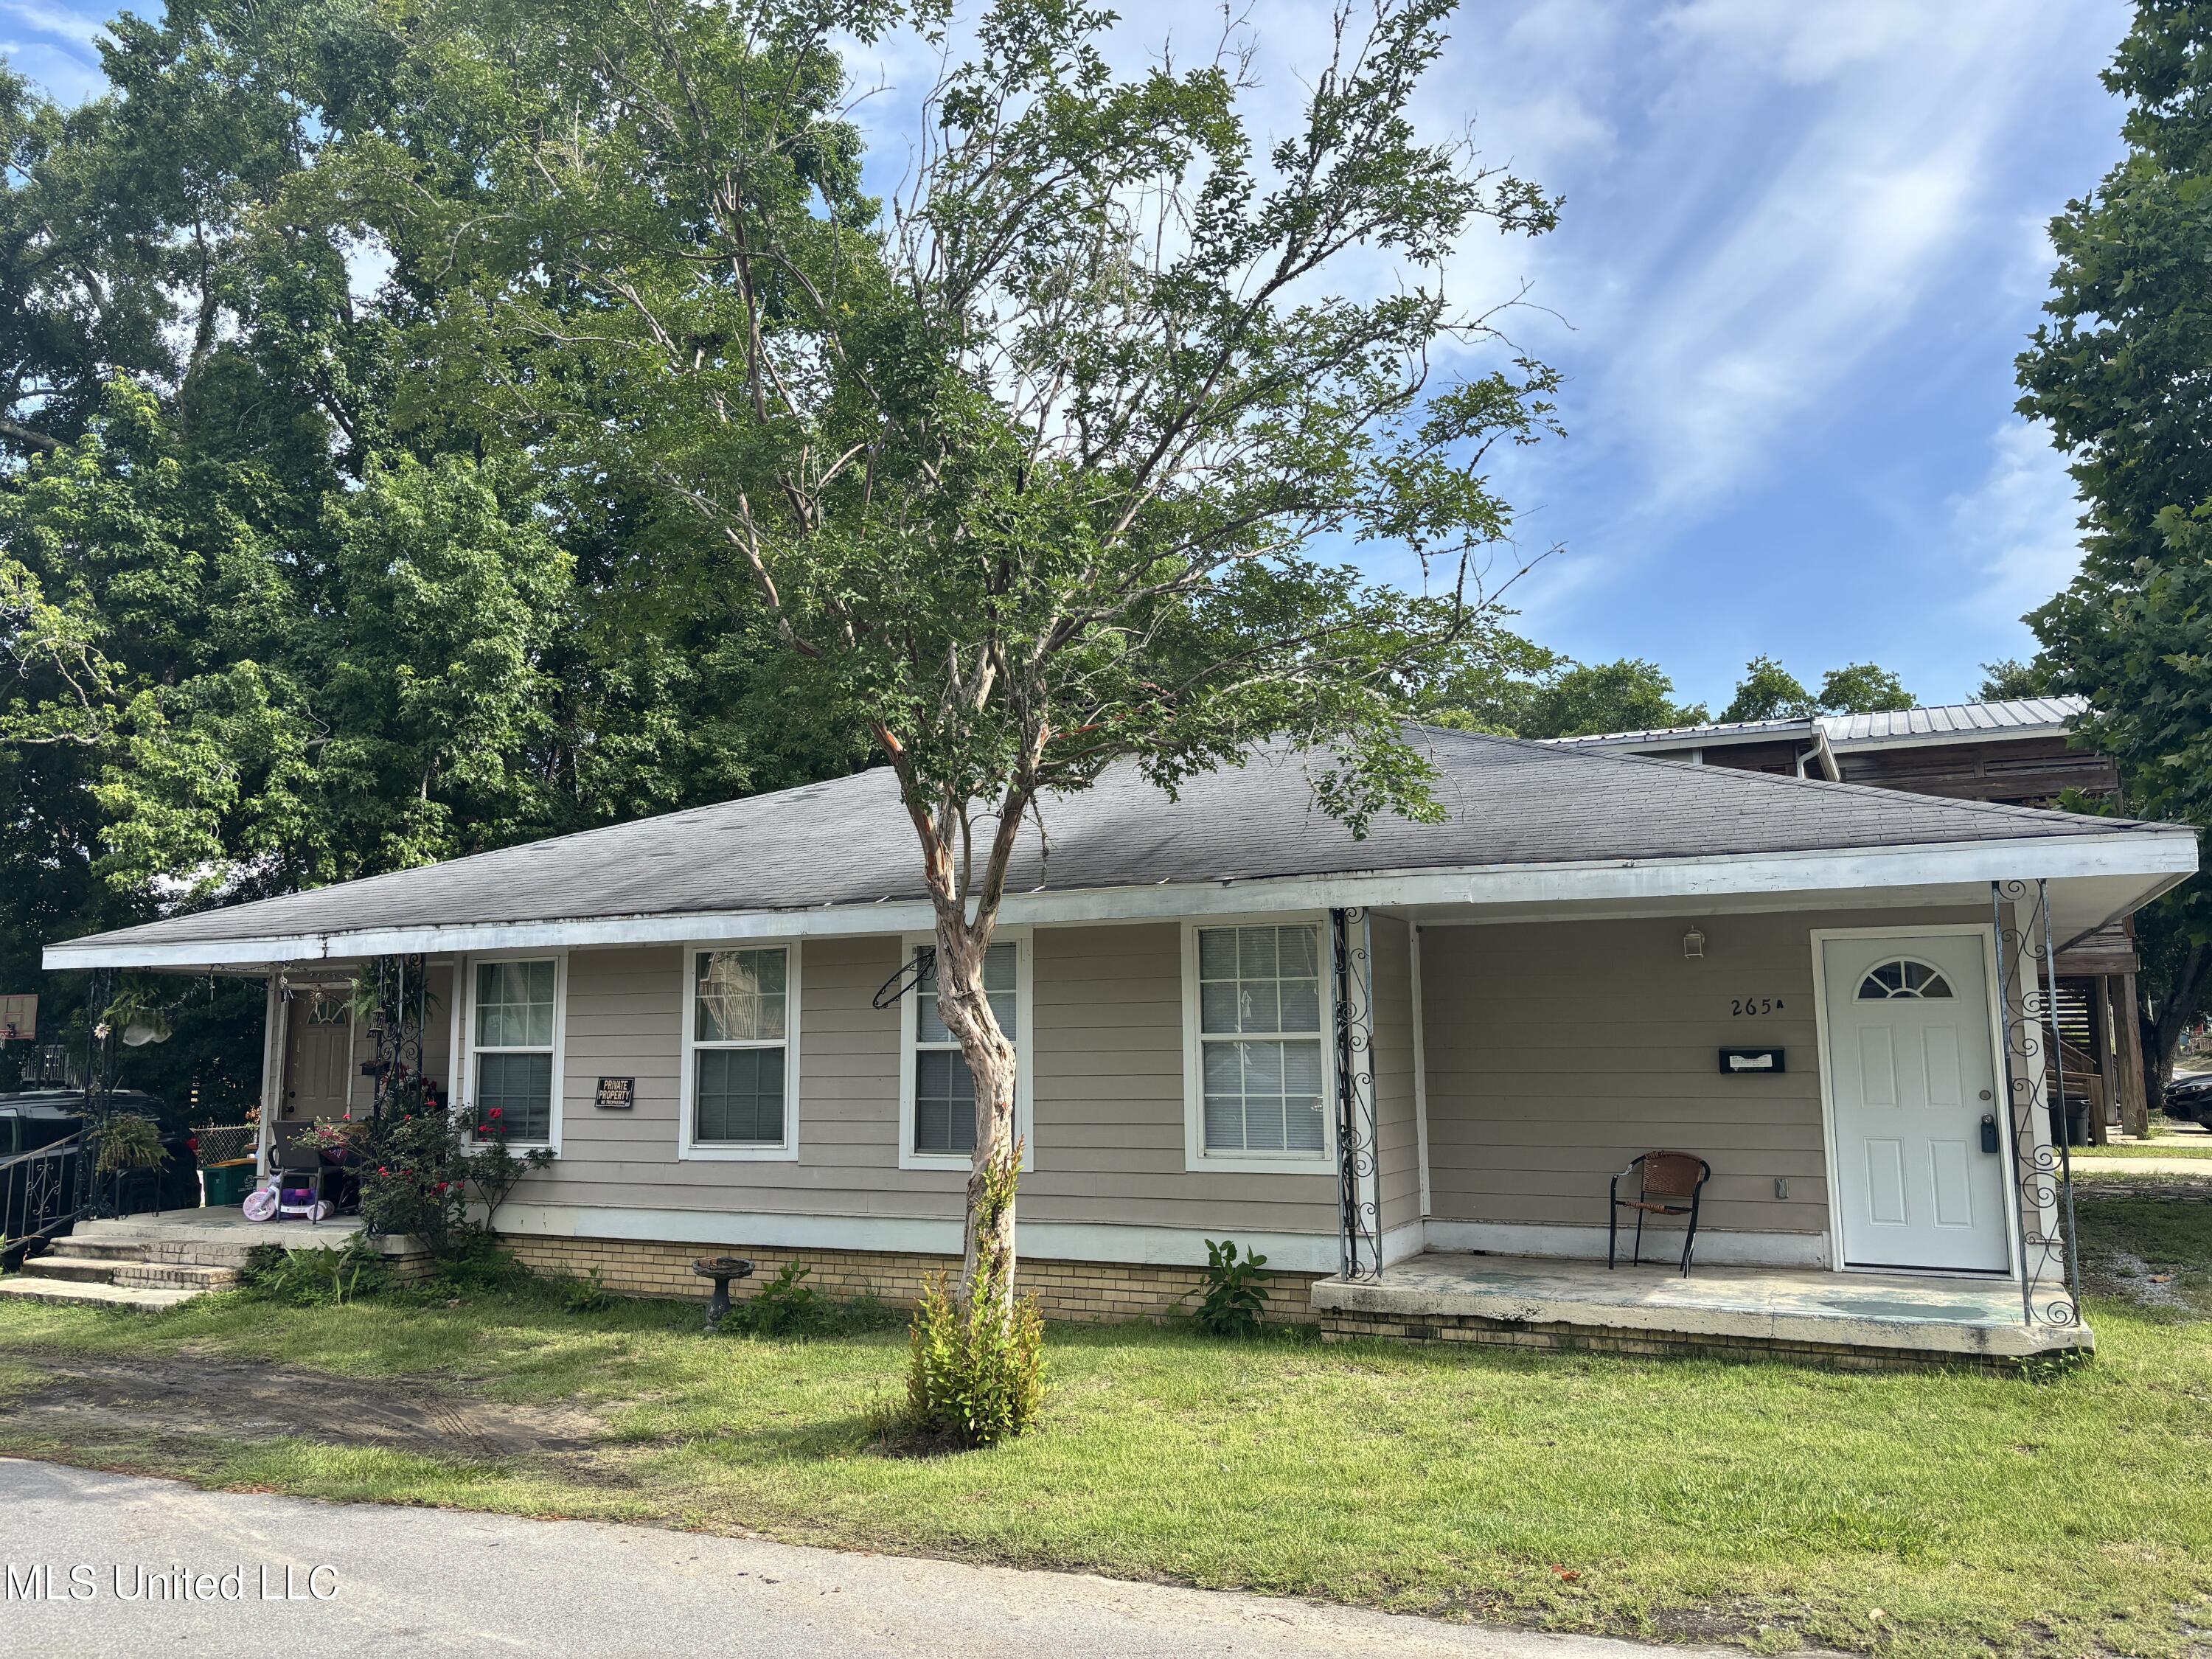
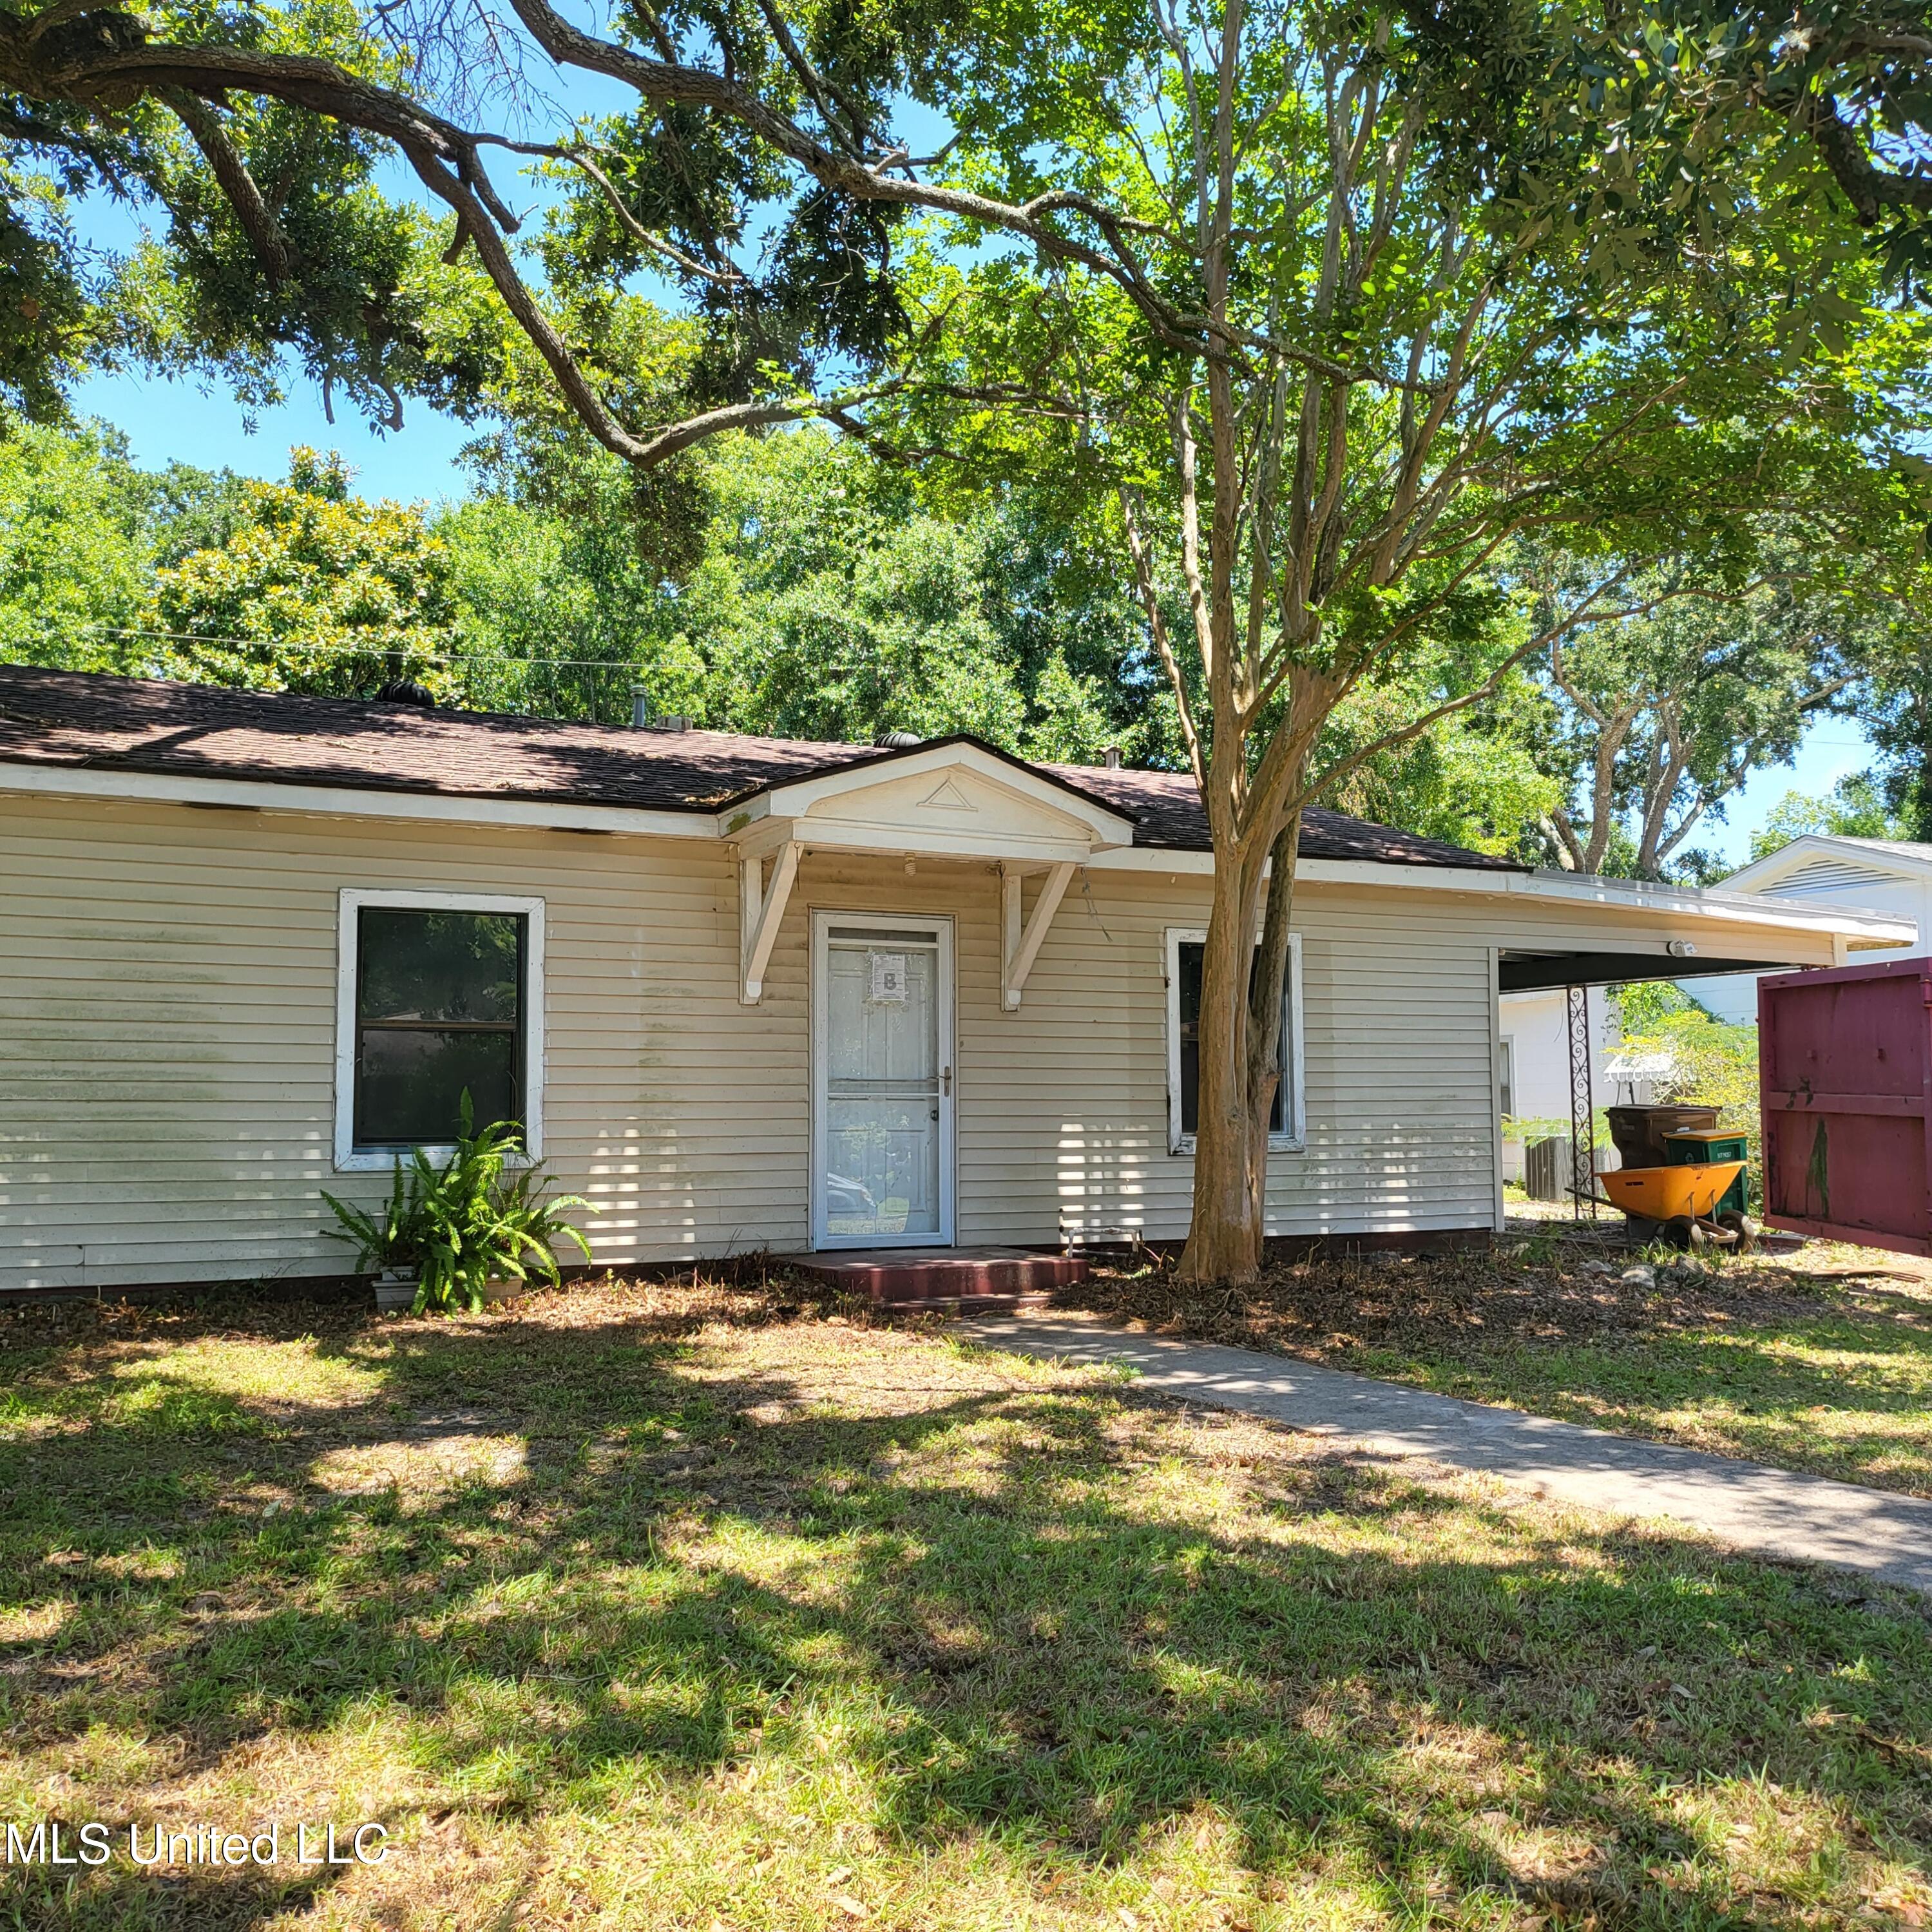
Pending
$119,000
4
bds
|
2
ba
|
0
sqft
|
built
1950
265 Graham Ave, Biloxi, MS 39530
$229
Cash flow
10.0%
Cash-on-Cash Return
8.6%
Cap rate
1.2%
Rent to Value Ratio
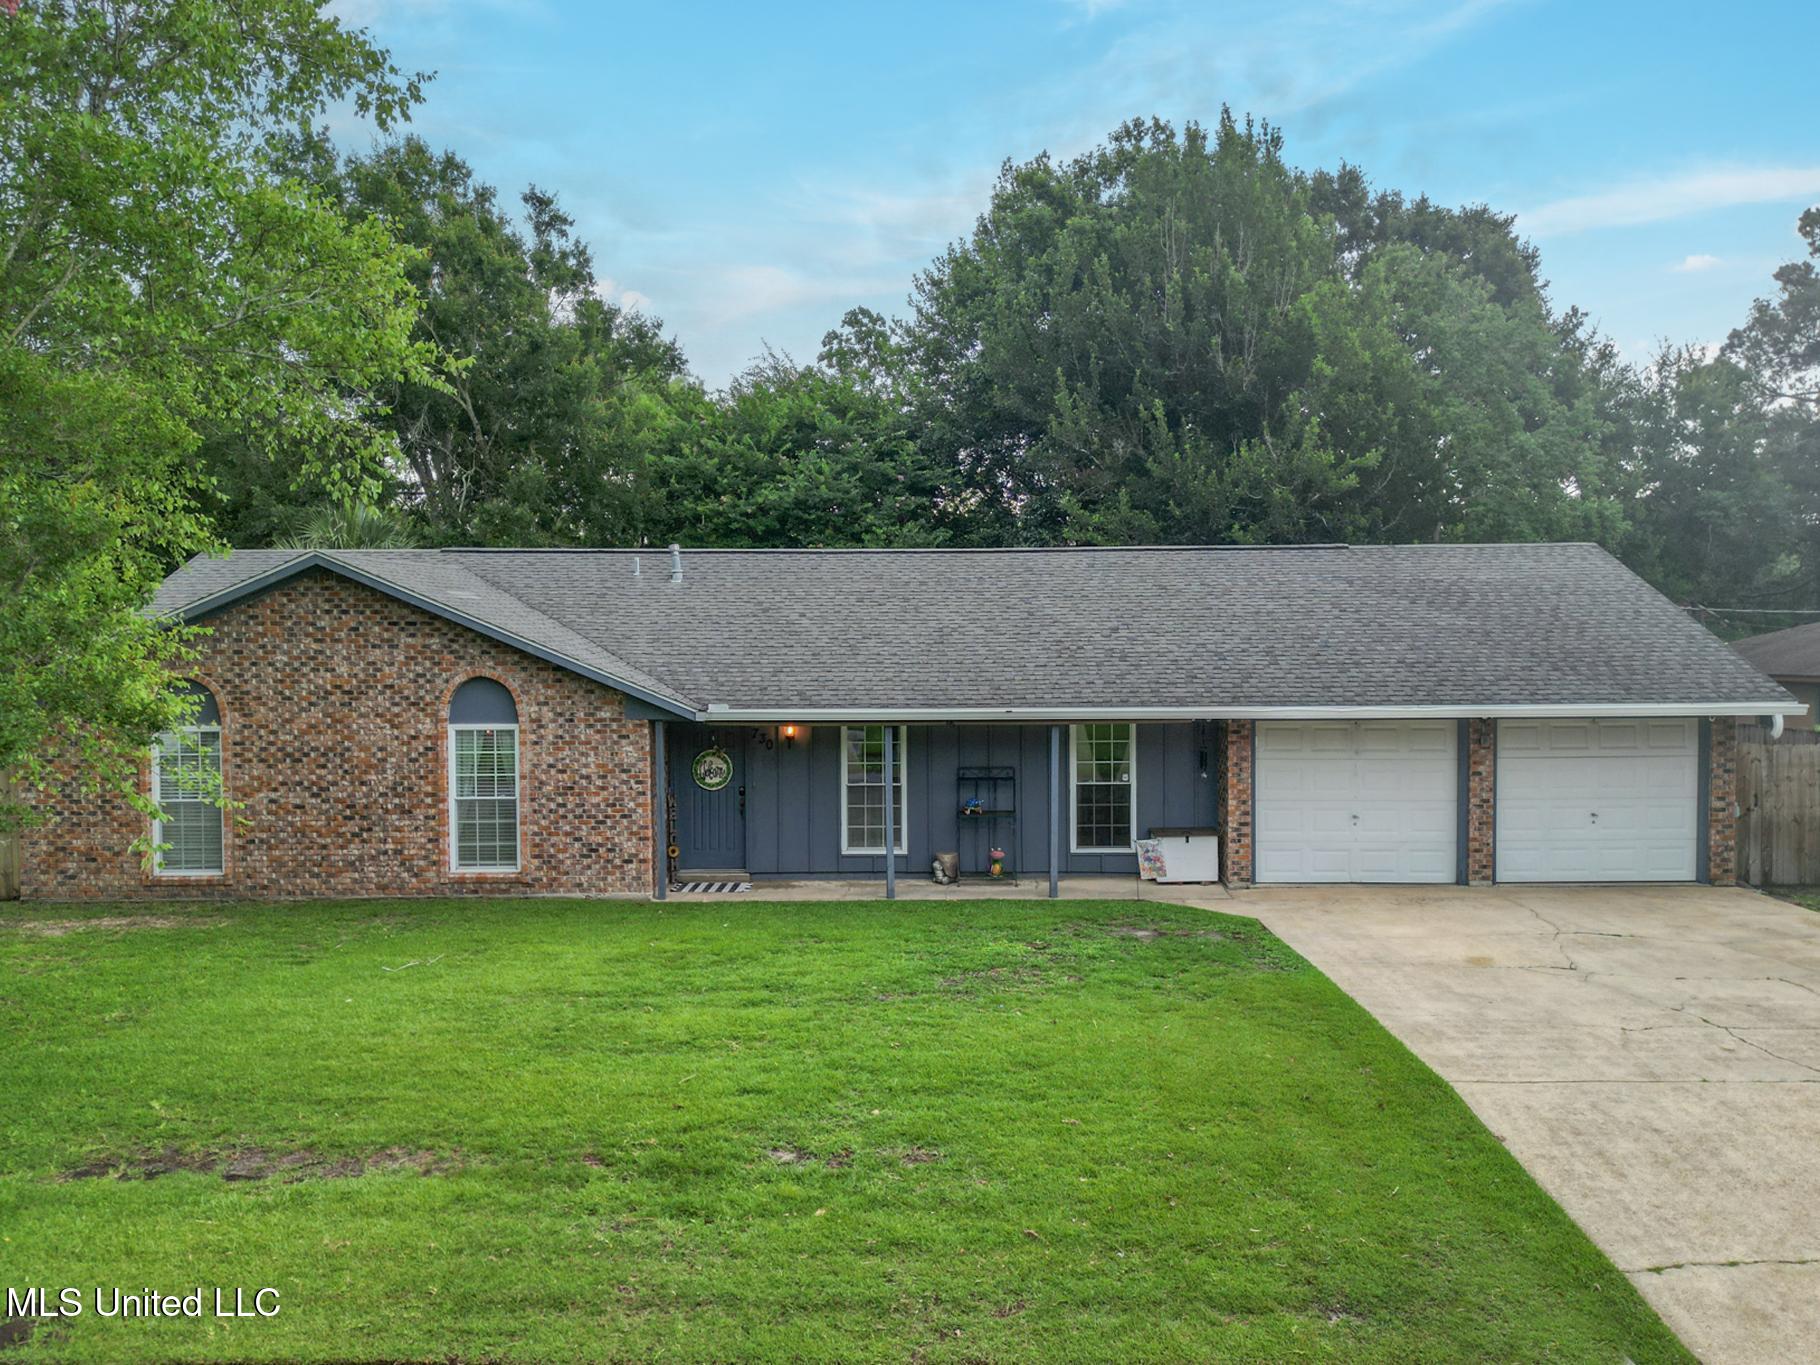
Pending
$215,000
3
bds
|
3
ba
|
0
sqft
|
built
1973
730 Holly Hills Dr, Biloxi, MS 39532
$160
Cash flow
3.9%
Cash-on-Cash Return
7.2%
Cap rate
0.9%
Rent to Value Ratio
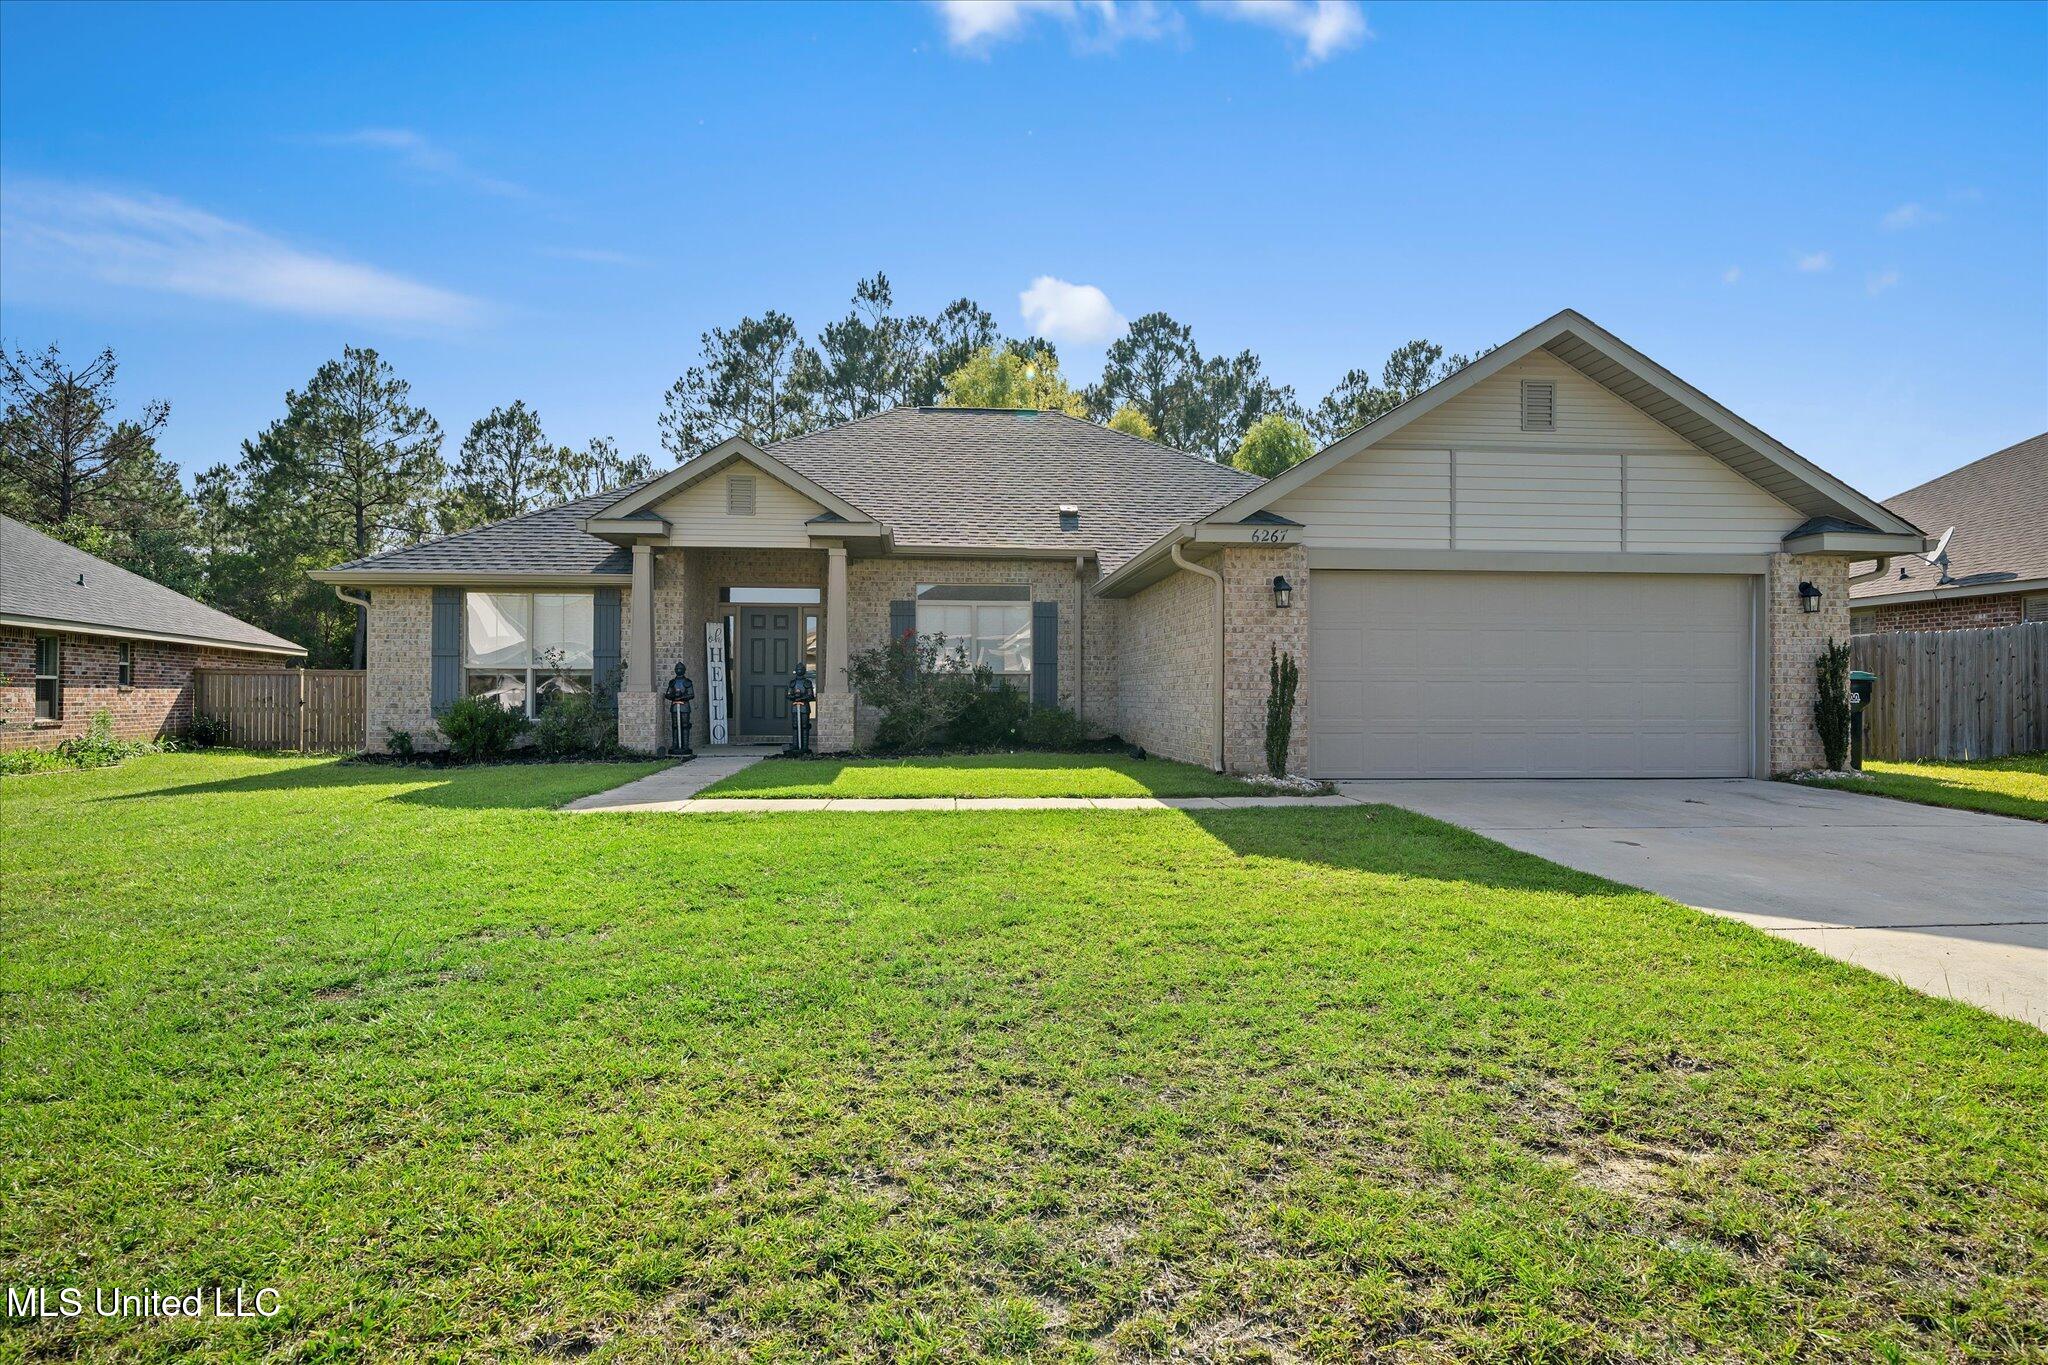
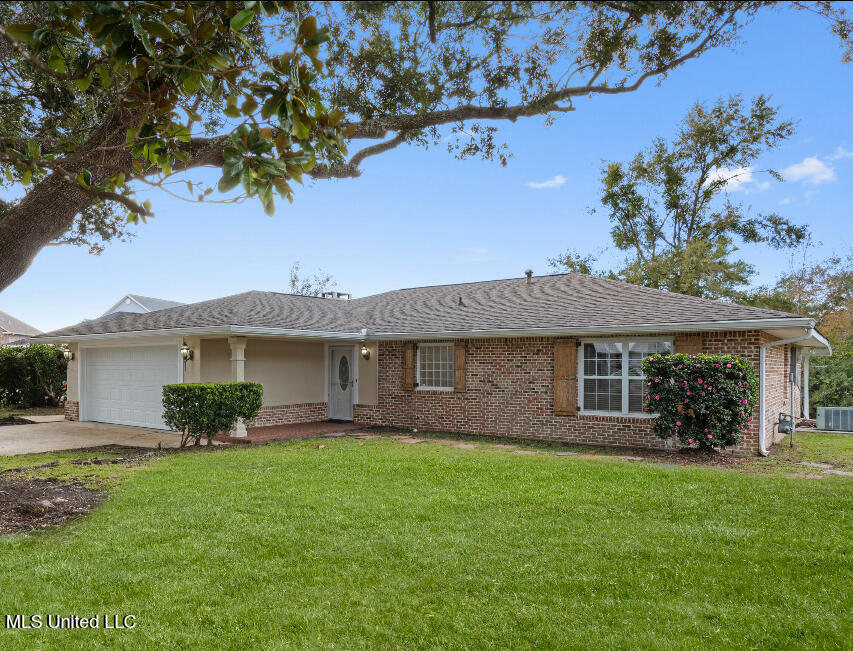
Active
$360,000
4
bds
|
3
ba
|
0
sqft
|
built
2019
6267 Roxanne Way, Biloxi, MS 39532
$-233
Cash flow
-3.4%
Cash-on-Cash Return
5.5%
Cap rate
0.8%
Rent to Value Ratio
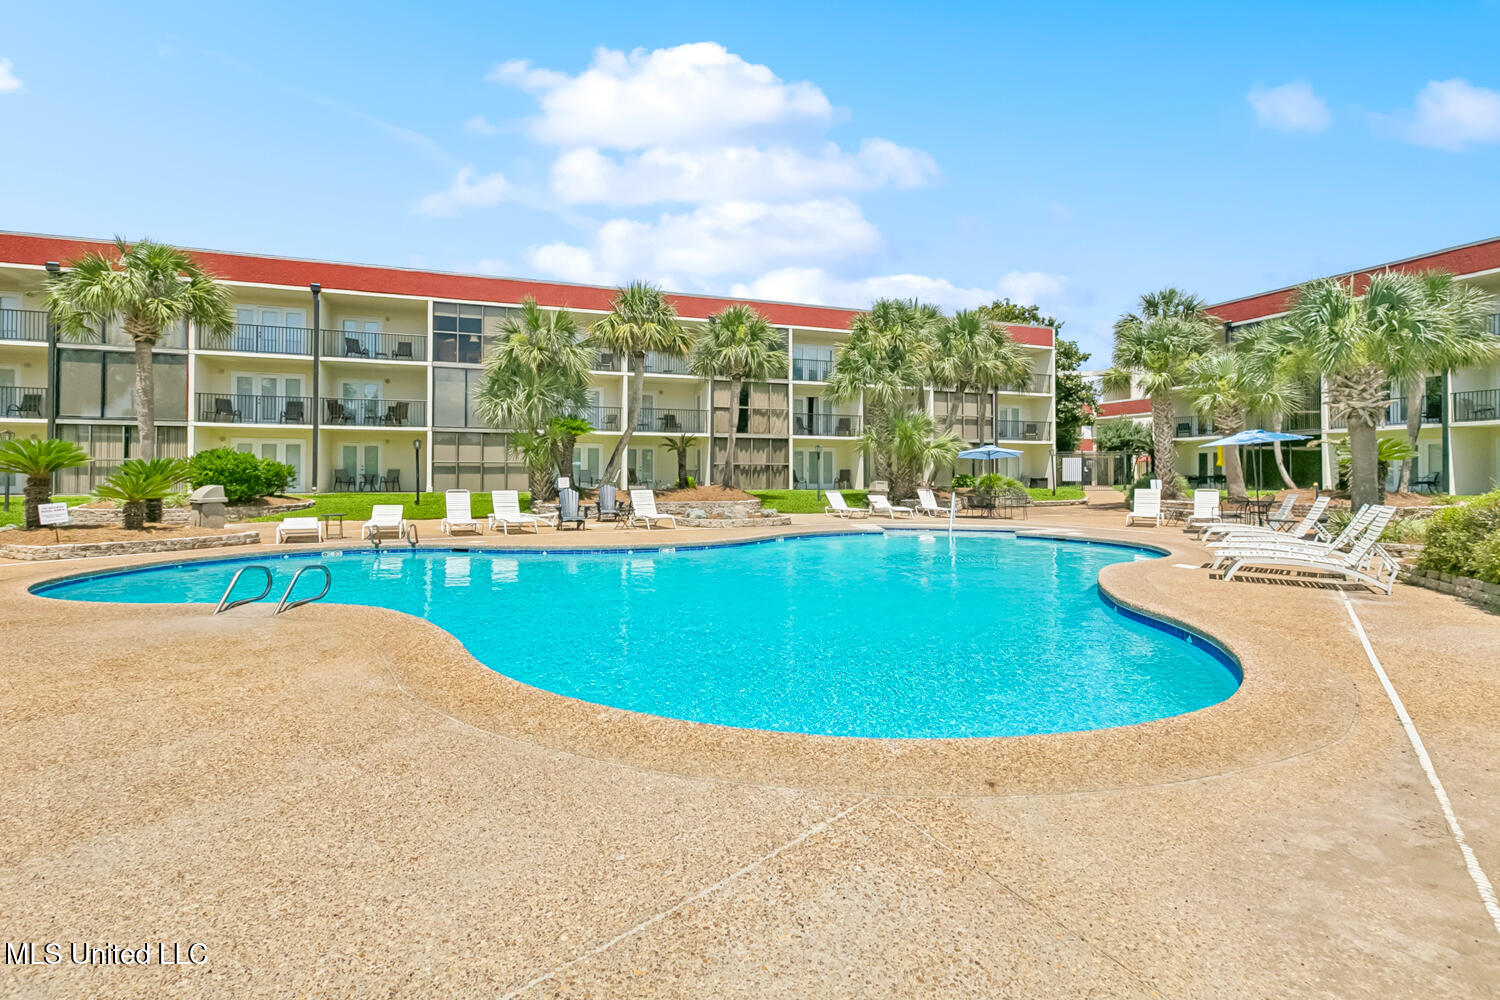
Active
$229,000
2
bds
|
2
ba
|
0
sqft
|
built
1982
2046 Beach Blvd, Biloxi, MS 39531
$-821
Cash flow
-18.7%
Cash-on-Cash Return
2.0%
Cap rate
0.7%
Rent to Value Ratio
Active
$378,900
3
bds
|
4
ba
|
0
sqft
|
built
1964
429 Linda Dr, Biloxi, MS 39531
$-52
Cash flow
-0.7%
Cash-on-Cash Return
6.1%
Cap rate
0.7%
Rent to Value Ratio
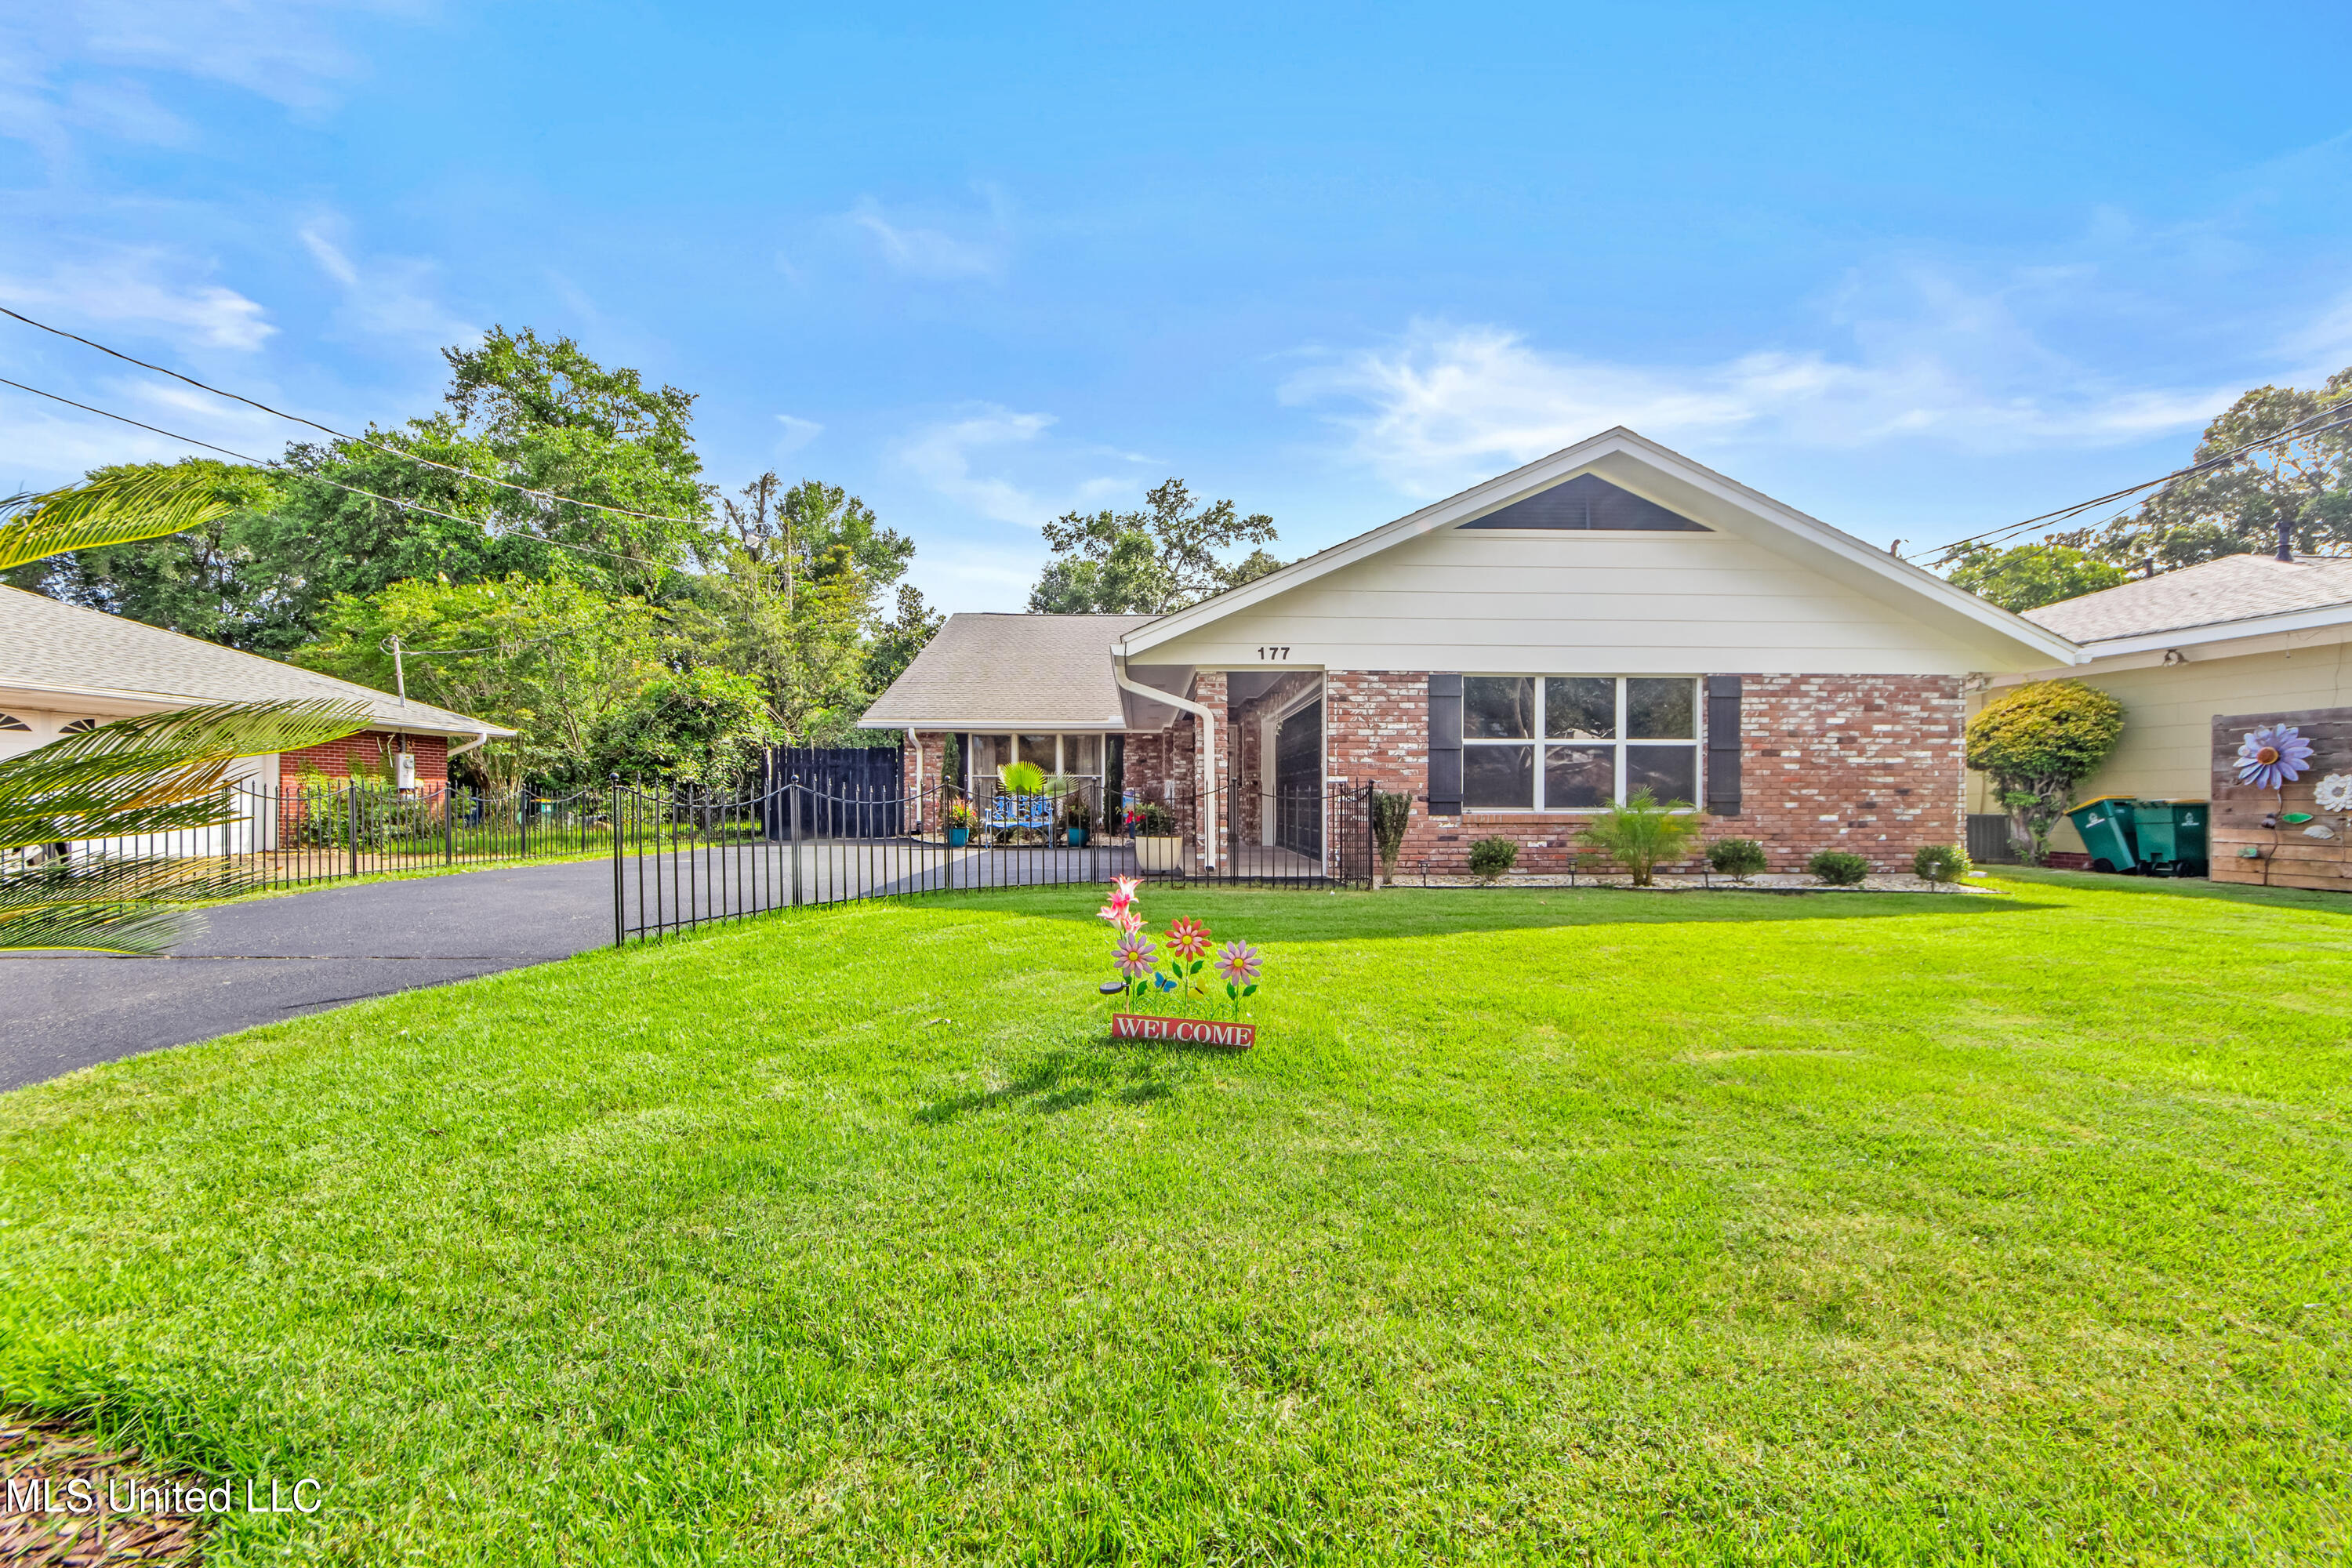
Active
$389,000
3
bds
|
3
ba
|
0
sqft
|
built
1975
177 Edgewater Dr, Biloxi, MS 39531
$-356
Cash flow
-4.8%
Cash-on-Cash Return
5.2%
Cap rate
0.6%
Rent to Value Ratio
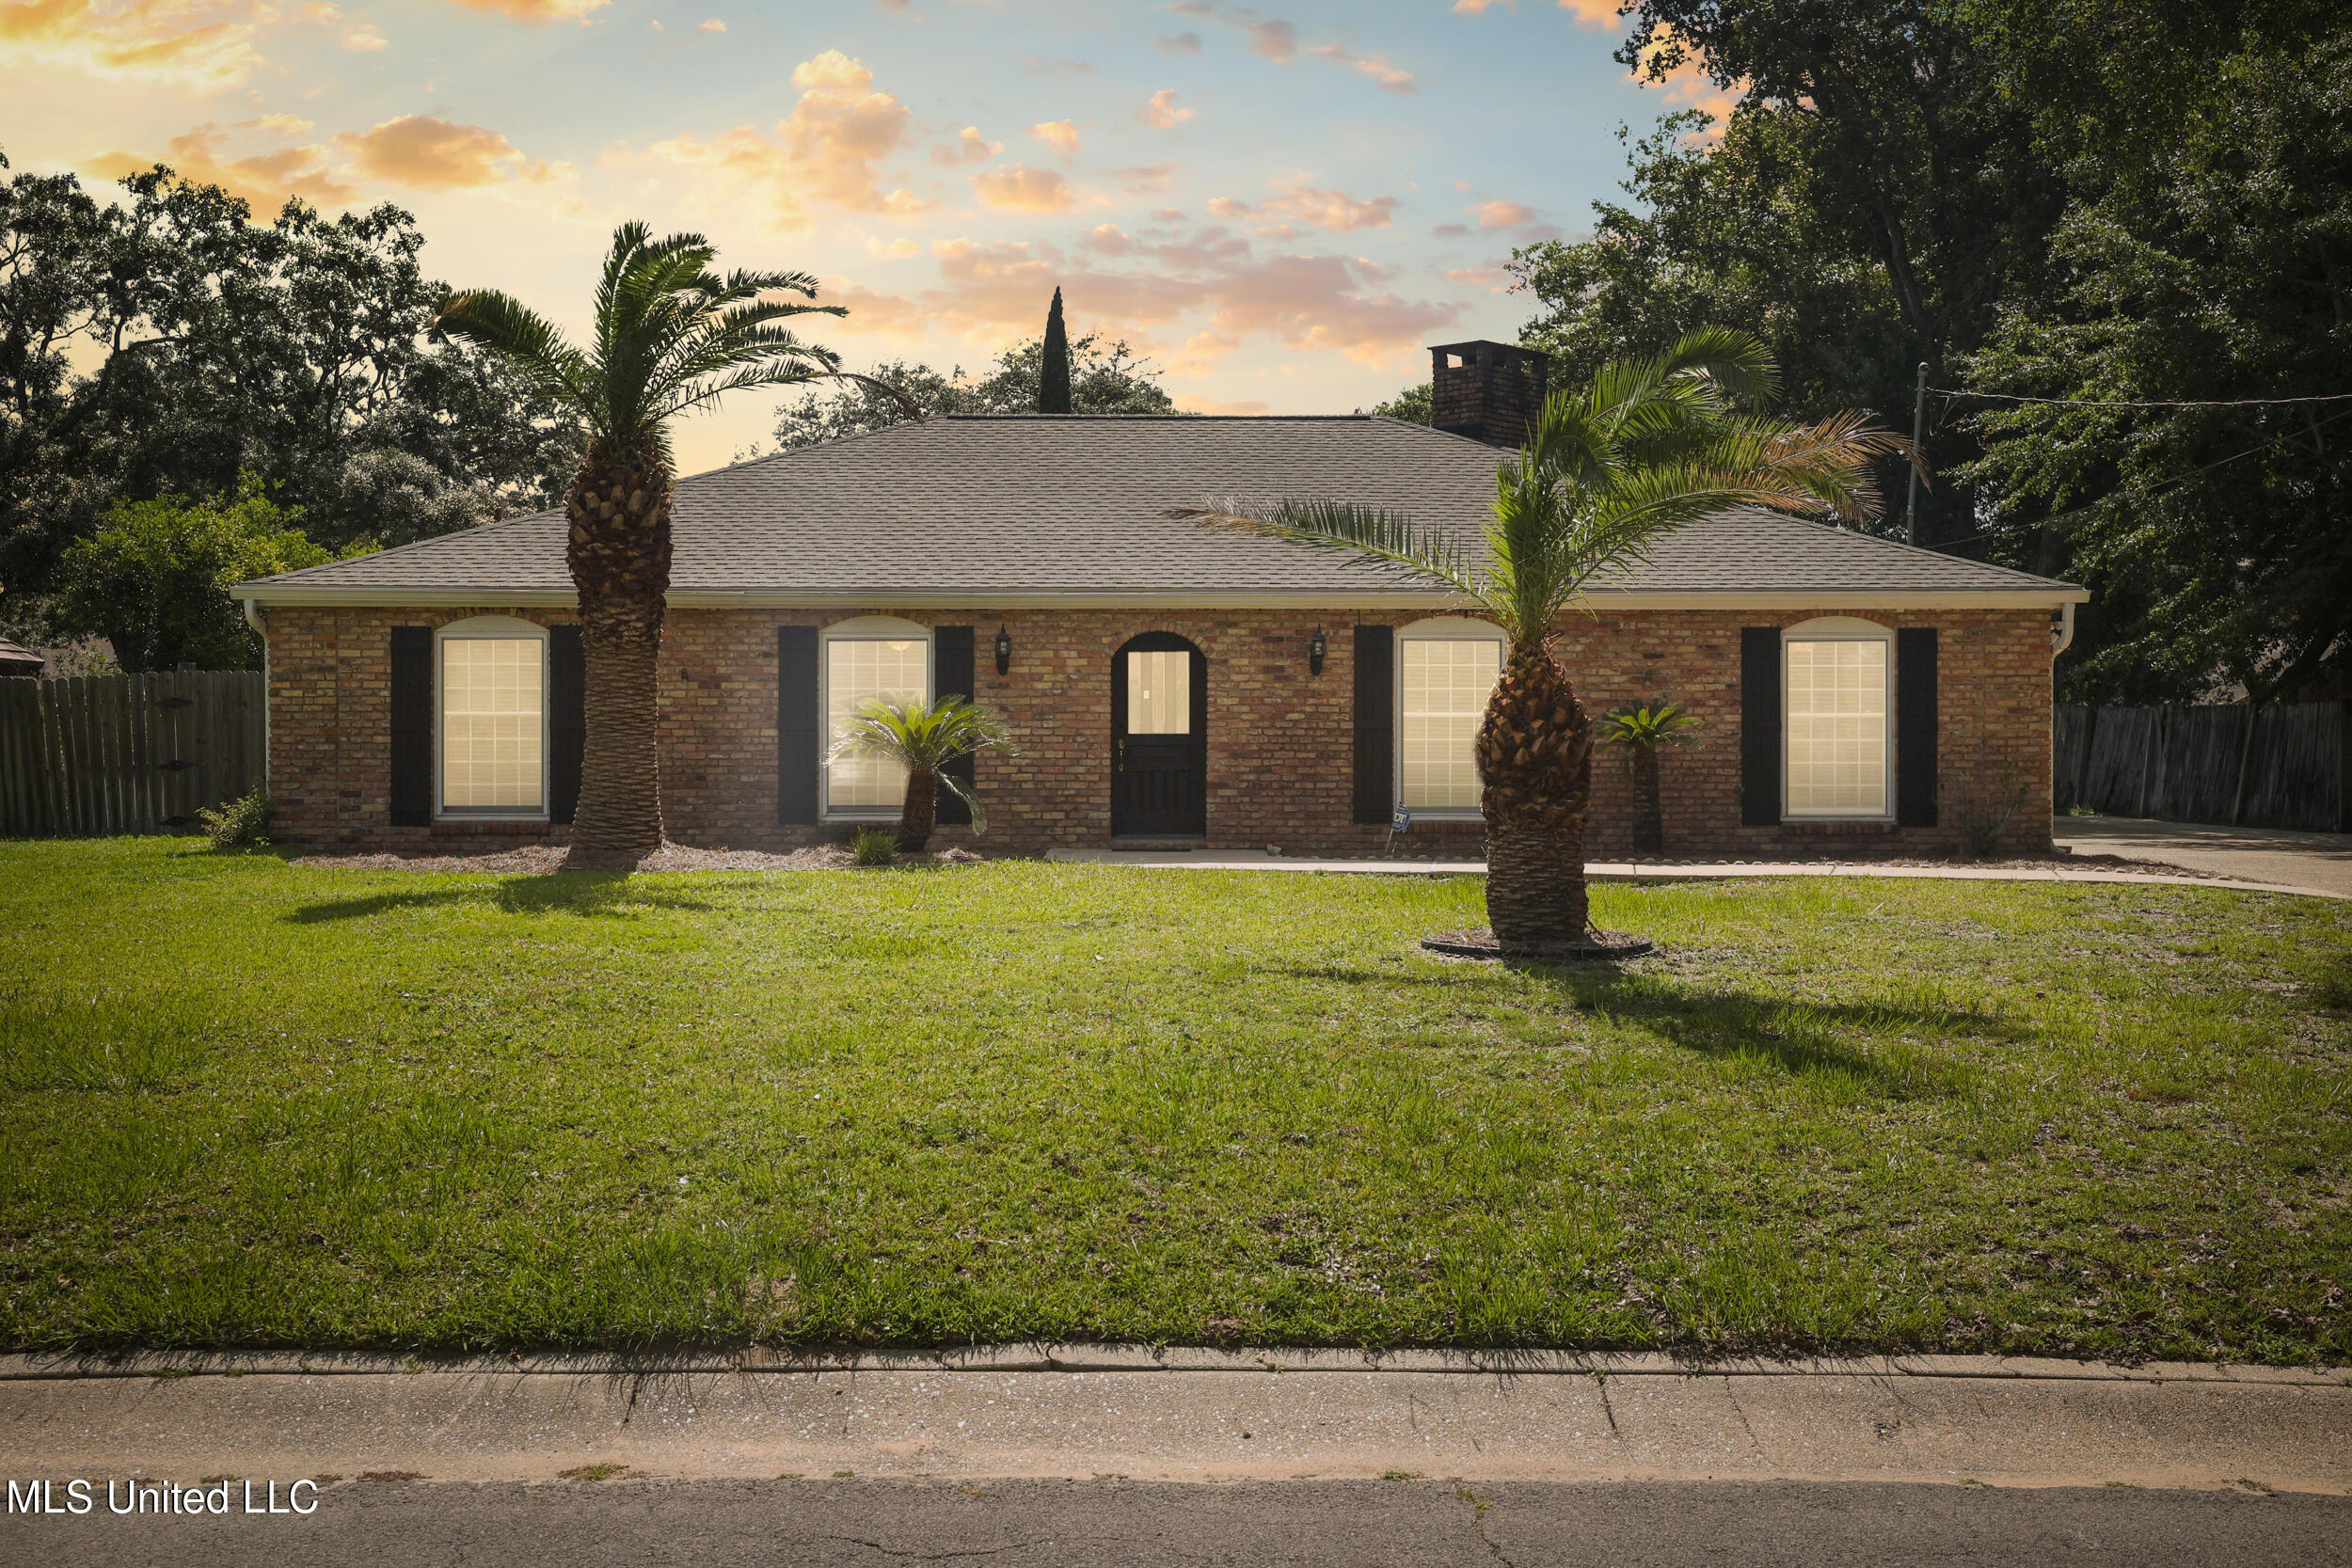
Active
$385,000
3
bds
|
2
ba
|
0
sqft
|
built
1968
707 Holly Hills Dr, Biloxi, MS 39532
$-82
Cash flow
-1.1%
Cash-on-Cash Return
6.0%
Cap rate
0.8%
Rent to Value Ratio
Active
$234,900
4
bds
|
3
ba
|
0
sqft
|
built
1960
2548 Bryn Mawr Ave, Biloxi, MS 39531
$160
Cash flow
3.6%
Cash-on-Cash Return
7.1%
Cap rate
0.9%
Rent to Value Ratio

Active
$449,900
3
bds
|
3
ba
|
0
sqft
|
built
1987
164 Balmoral Ave, Biloxi, MS 39531
$-434
Cash flow
-5.0%
Cash-on-Cash Return
5.1%
Cap rate
0.7%
Rent to Value Ratio
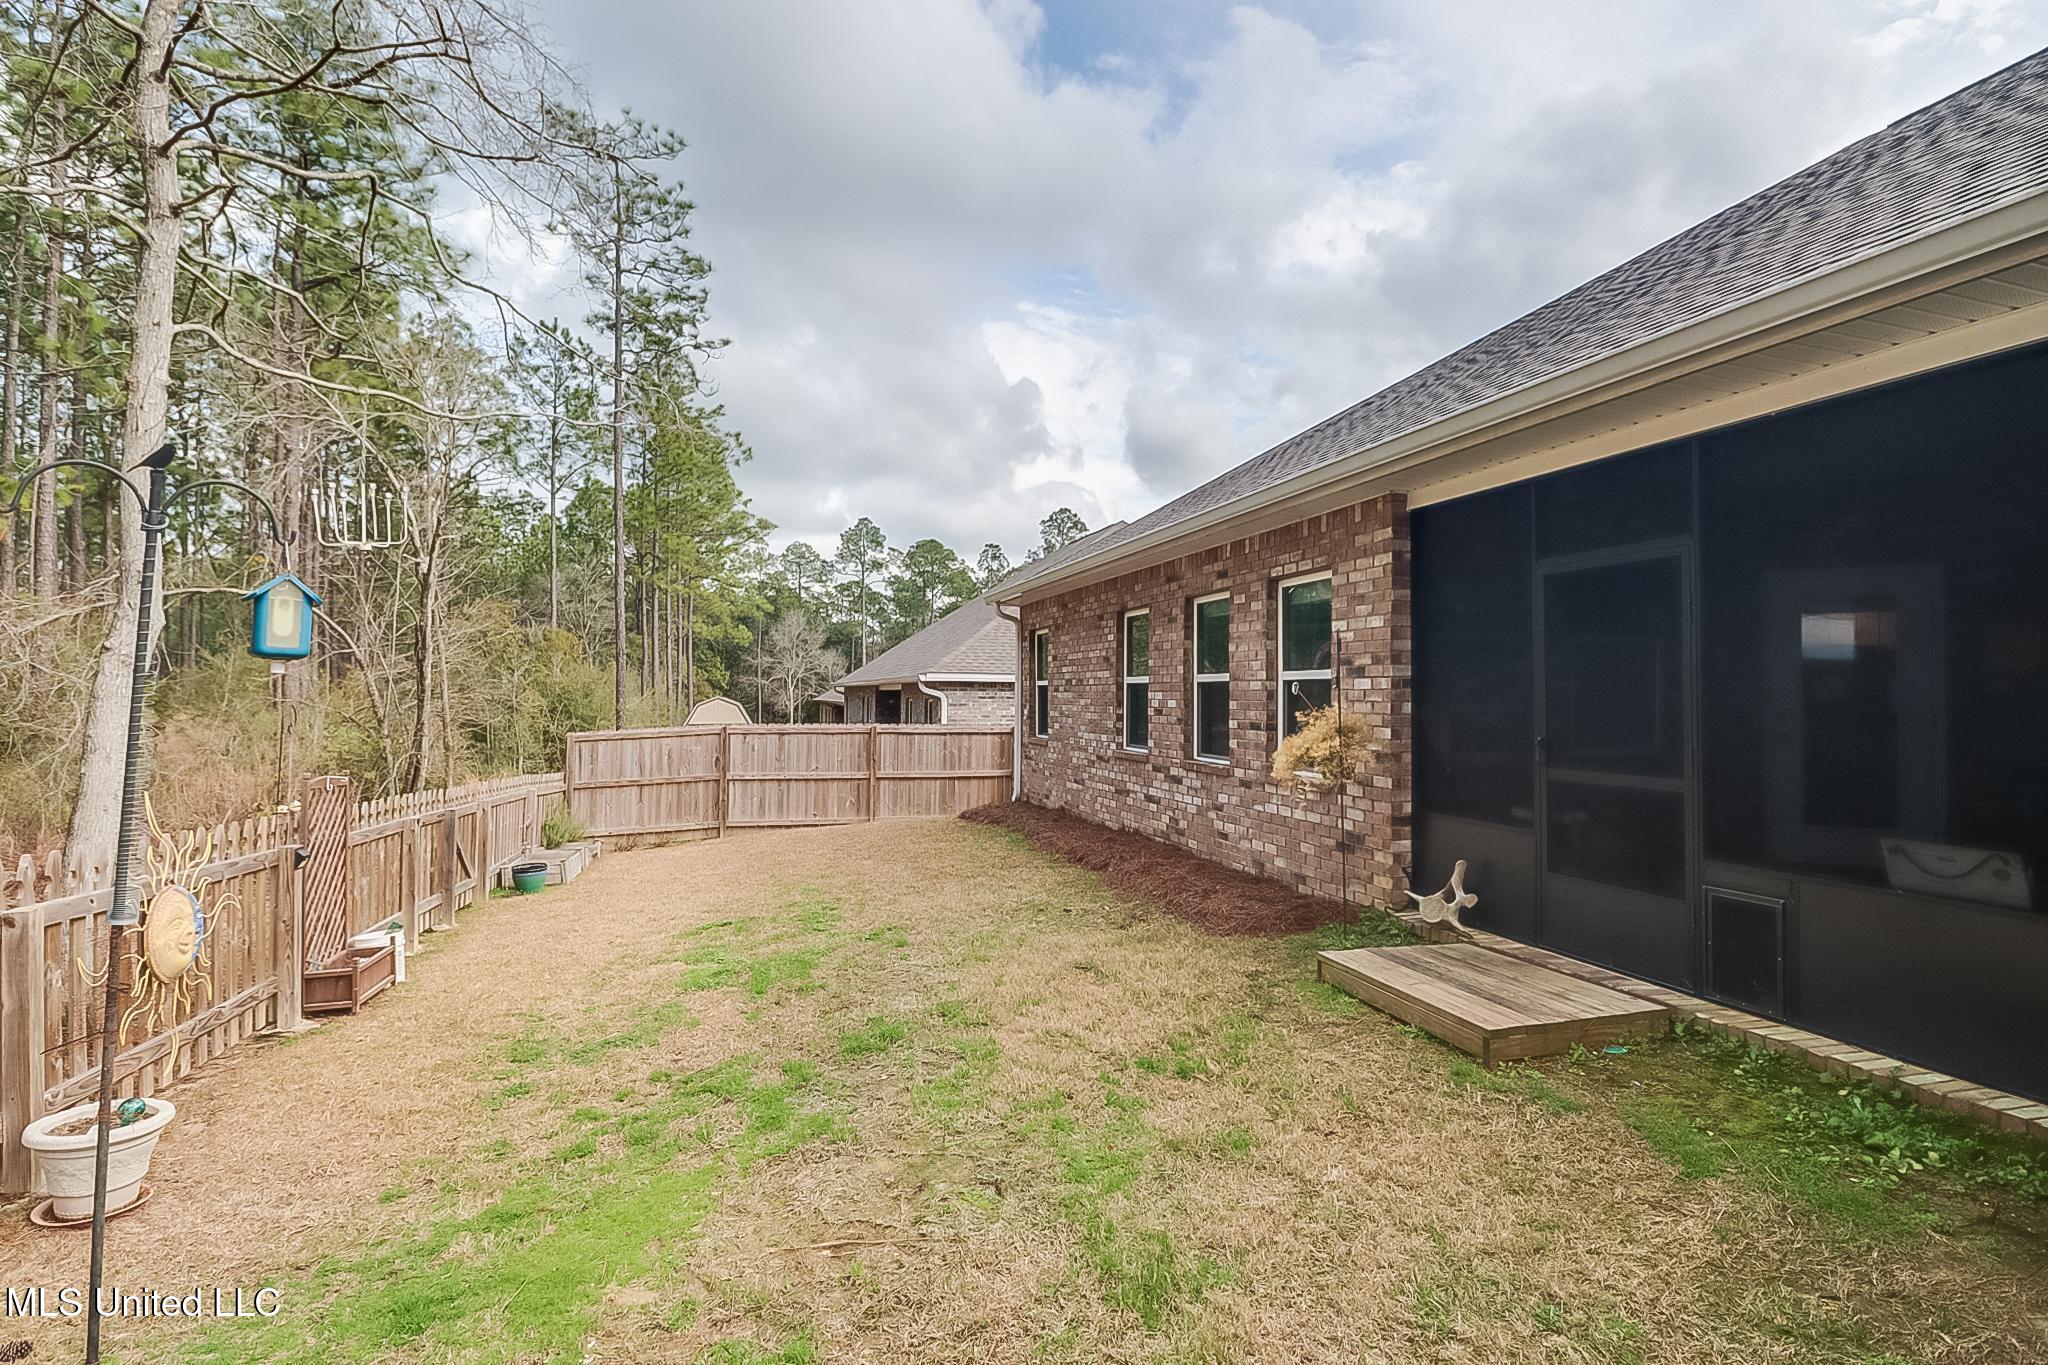
Pending
$345,000
4
bds
|
3
ba
|
0
sqft
|
built
2021
12411 Desoto Trails Cir, Biloxi, MS 39532
$-198
Cash flow
-3.0%
Cash-on-Cash Return
5.6%
Cap rate
0.8%
Rent to Value Ratio

Active
$725,000
5
bds
|
4
ba
|
0
sqft
|
built
2019
368 Goose Pointe Blvd, Biloxi, MS 39531
$-1,372
Cash flow
-9.9%
Cash-on-Cash Return
4.0%
Cap rate
0.5%
Rent to Value Ratio
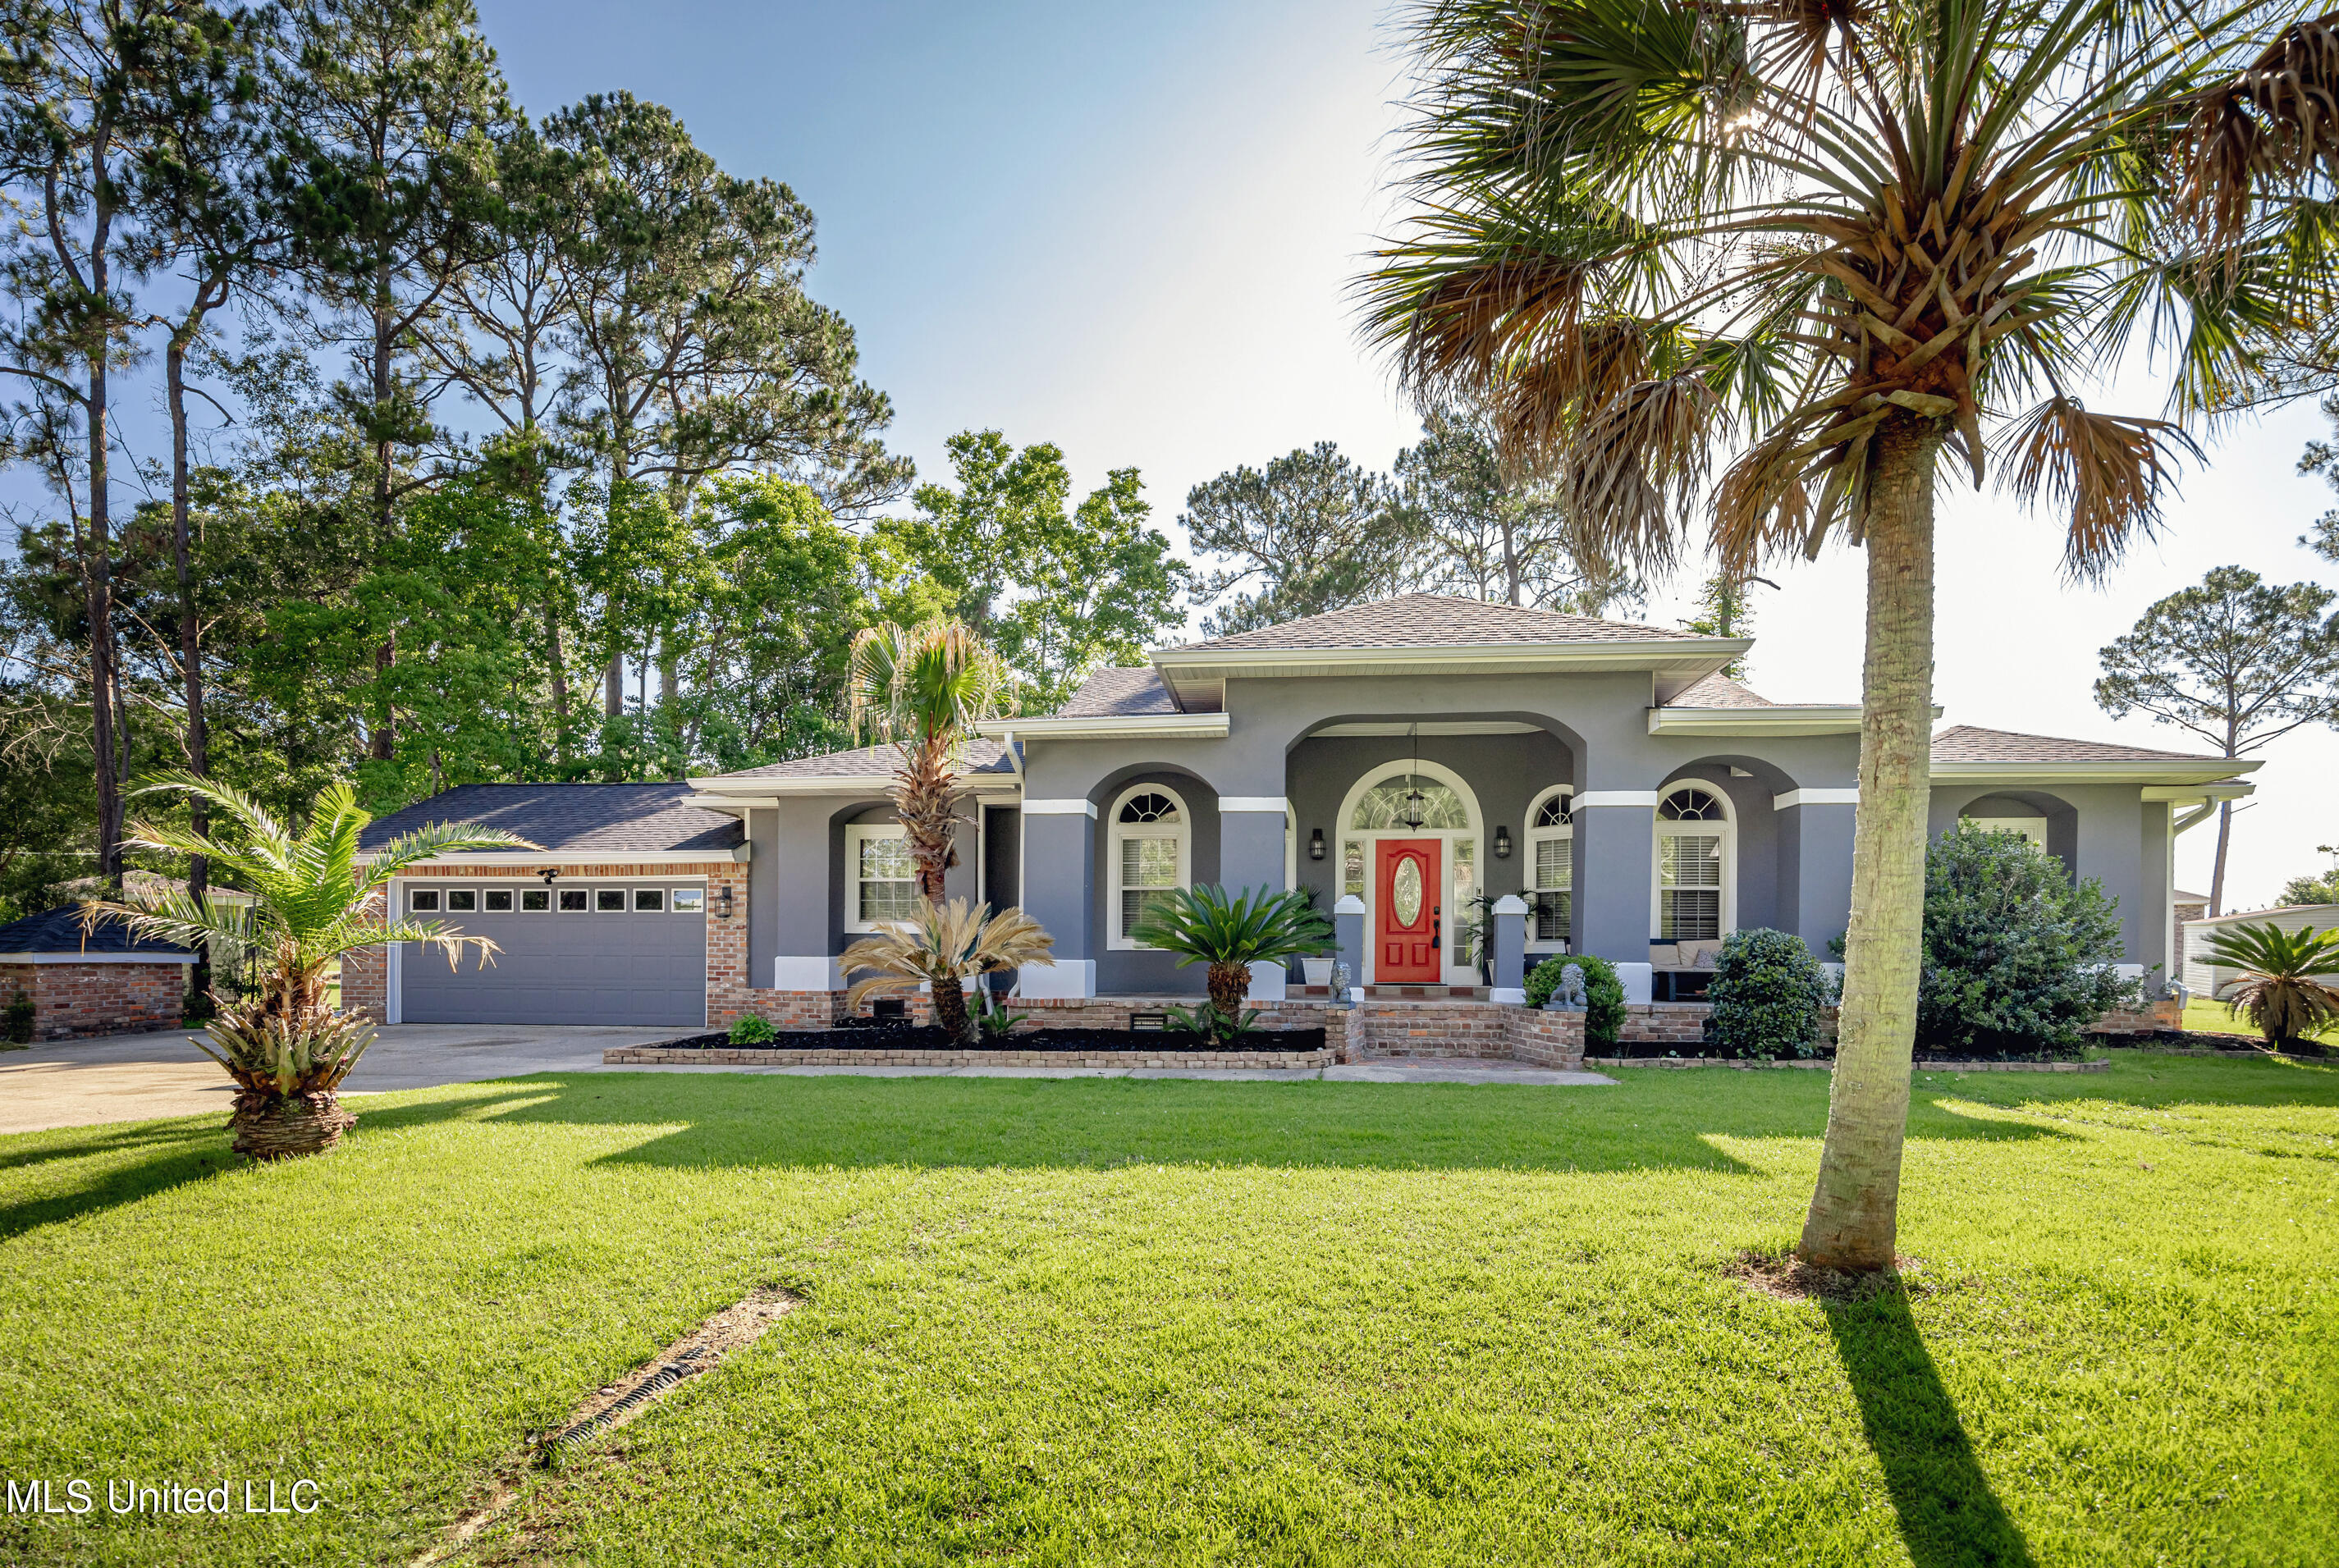
Active
$324,999
4
bds
|
3
ba
|
0
sqft
|
built
2001
4213 Victoria Ln, Biloxi, MS 39532
$-317
Cash flow
-5.1%
Cash-on-Cash Return
5.1%
Cap rate
0.7%
Rent to Value Ratio
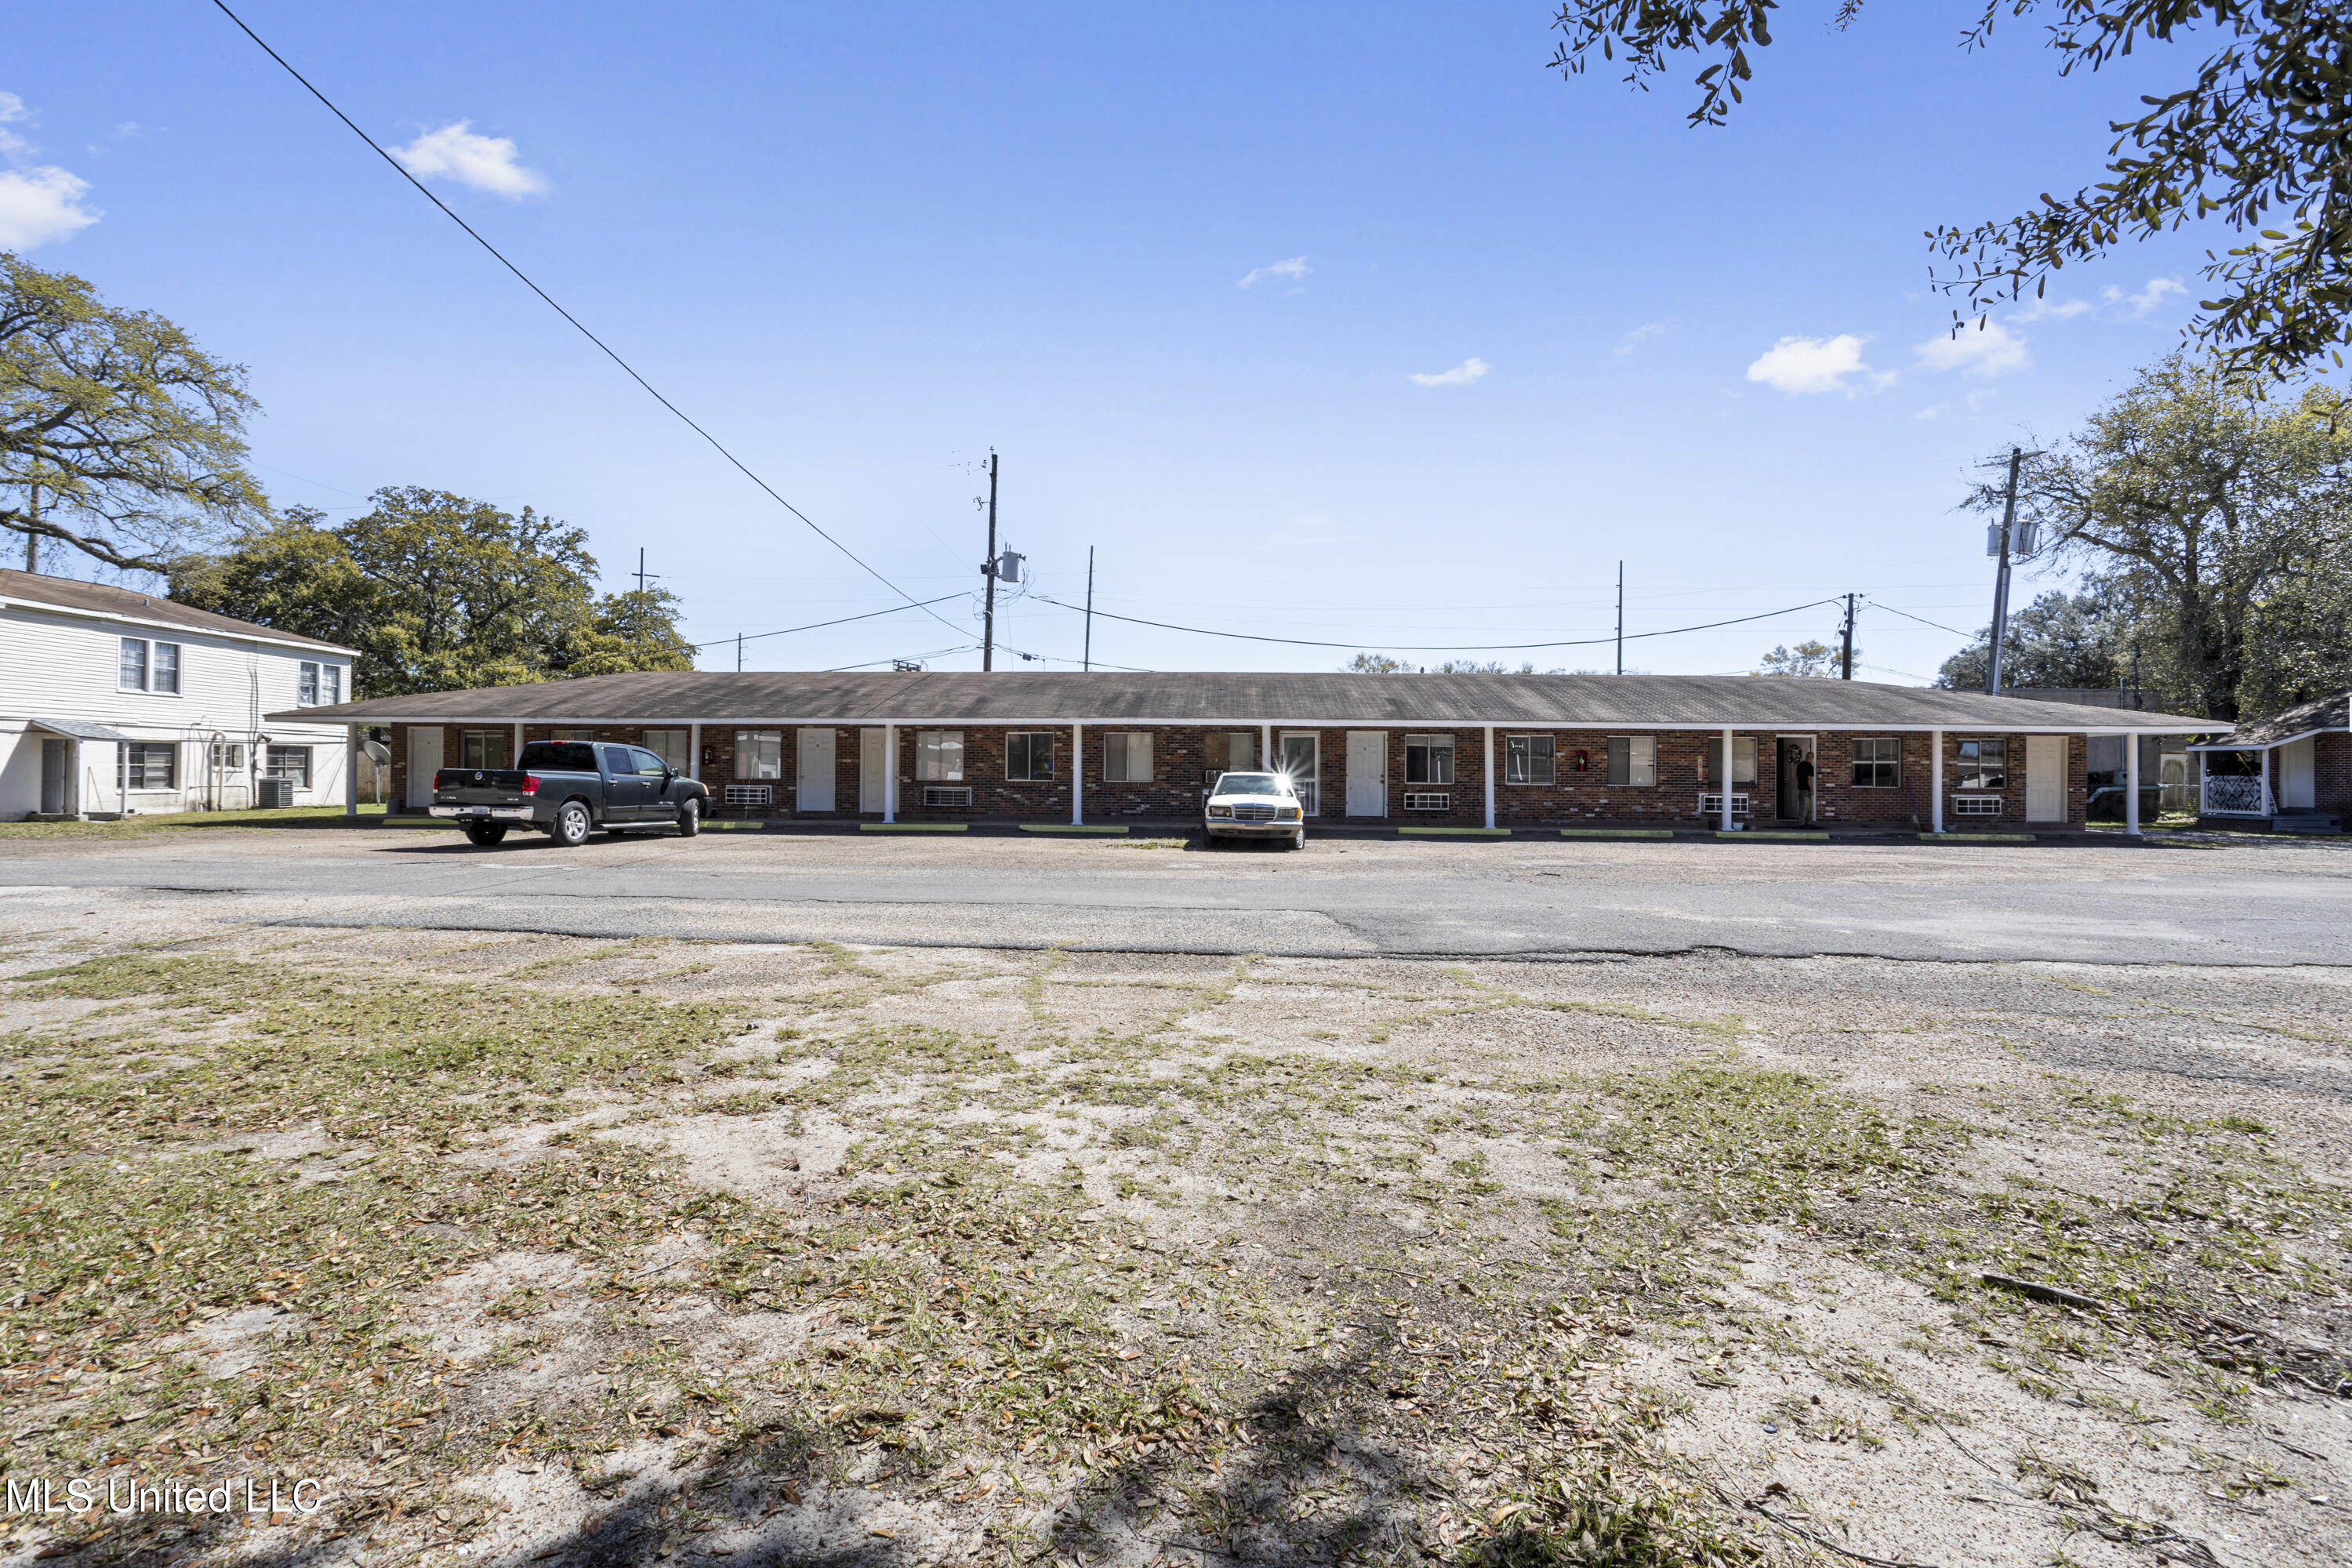
Active
$895,000
27
bds
|
18
ba
|
0
sqft
|
built
1956
321 Rodenberg Ave, Biloxi, MS 39531
$-4,019
Cash flow
-23.4%
Cash-on-Cash Return
0.9%
Cap rate
0.2%
Rent to Value Ratio
Active
$370,000
3
bds
|
3
ba
|
0
sqft
|
built
1992
2552 Conifer Ct, Biloxi, MS 39531
$-129
Cash flow
-1.8%
Cash-on-Cash Return
5.9%
Cap rate
0.8%
Rent to Value Ratio
Active
$289,000
4
bds
|
3
ba
|
0
sqft
|
built
2023
5378 Leeds Ln, Biloxi, MS 39532
$51
Cash flow
0.9%
Cash-on-Cash Return
6.5%
Cap rate
0.8%
Rent to Value Ratio
Active
$259,000
3
bds
|
2
ba
|
0
sqft
|
built
1947
160 Balmoral Ave, Biloxi, MS 39531
$-140
Cash flow
-2.8%
Cash-on-Cash Return
5.6%
Cap rate
0.8%
Rent to Value Ratio
Active
$310,000
2
bds
|
2
ba
|
0
sqft
|
built
1981
1130 Beach Blvd, Biloxi, MS 39530
$-460
Cash flow
-7.7%
Cash-on-Cash Return
4.5%
Cap rate
0.8%
Rent to Value Ratio
Pending
$237,000
3
bds
|
2
ba
|
0
sqft
|
built
1962
2085 Pat Ln, Biloxi, MS 39531
$1
Cash flow
0.0%
Cash-on-Cash Return
6.3%
Cap rate
0.8%
Rent to Value Ratio
Active
$164,900
2
bds
|
2
ba
|
0
sqft
|
built
1967
1664 Beach Blvd, Biloxi, MS 39531
$-452
Cash flow
-14.3%
Cash-on-Cash Return
3.0%
Cap rate
0.8%
Rent to Value Ratio

Active
$254,900
3
bds
|
2
ba
|
0
sqft
|
built
1973
459 Jim Money Rd, Biloxi, MS 39531
$82
Cash flow
1.7%
Cash-on-Cash Return
6.7%
Cap rate
0.9%
Rent to Value Ratio
Active
$460,000
3
bds
|
3
ba
|
0
sqft
|
built
2007
2668 Beach Blvd, Biloxi, MS 39531
$-2,187
Cash flow
-24.8%
Cash-on-Cash Return
0.6%
Cap rate
0.5%
Rent to Value Ratio
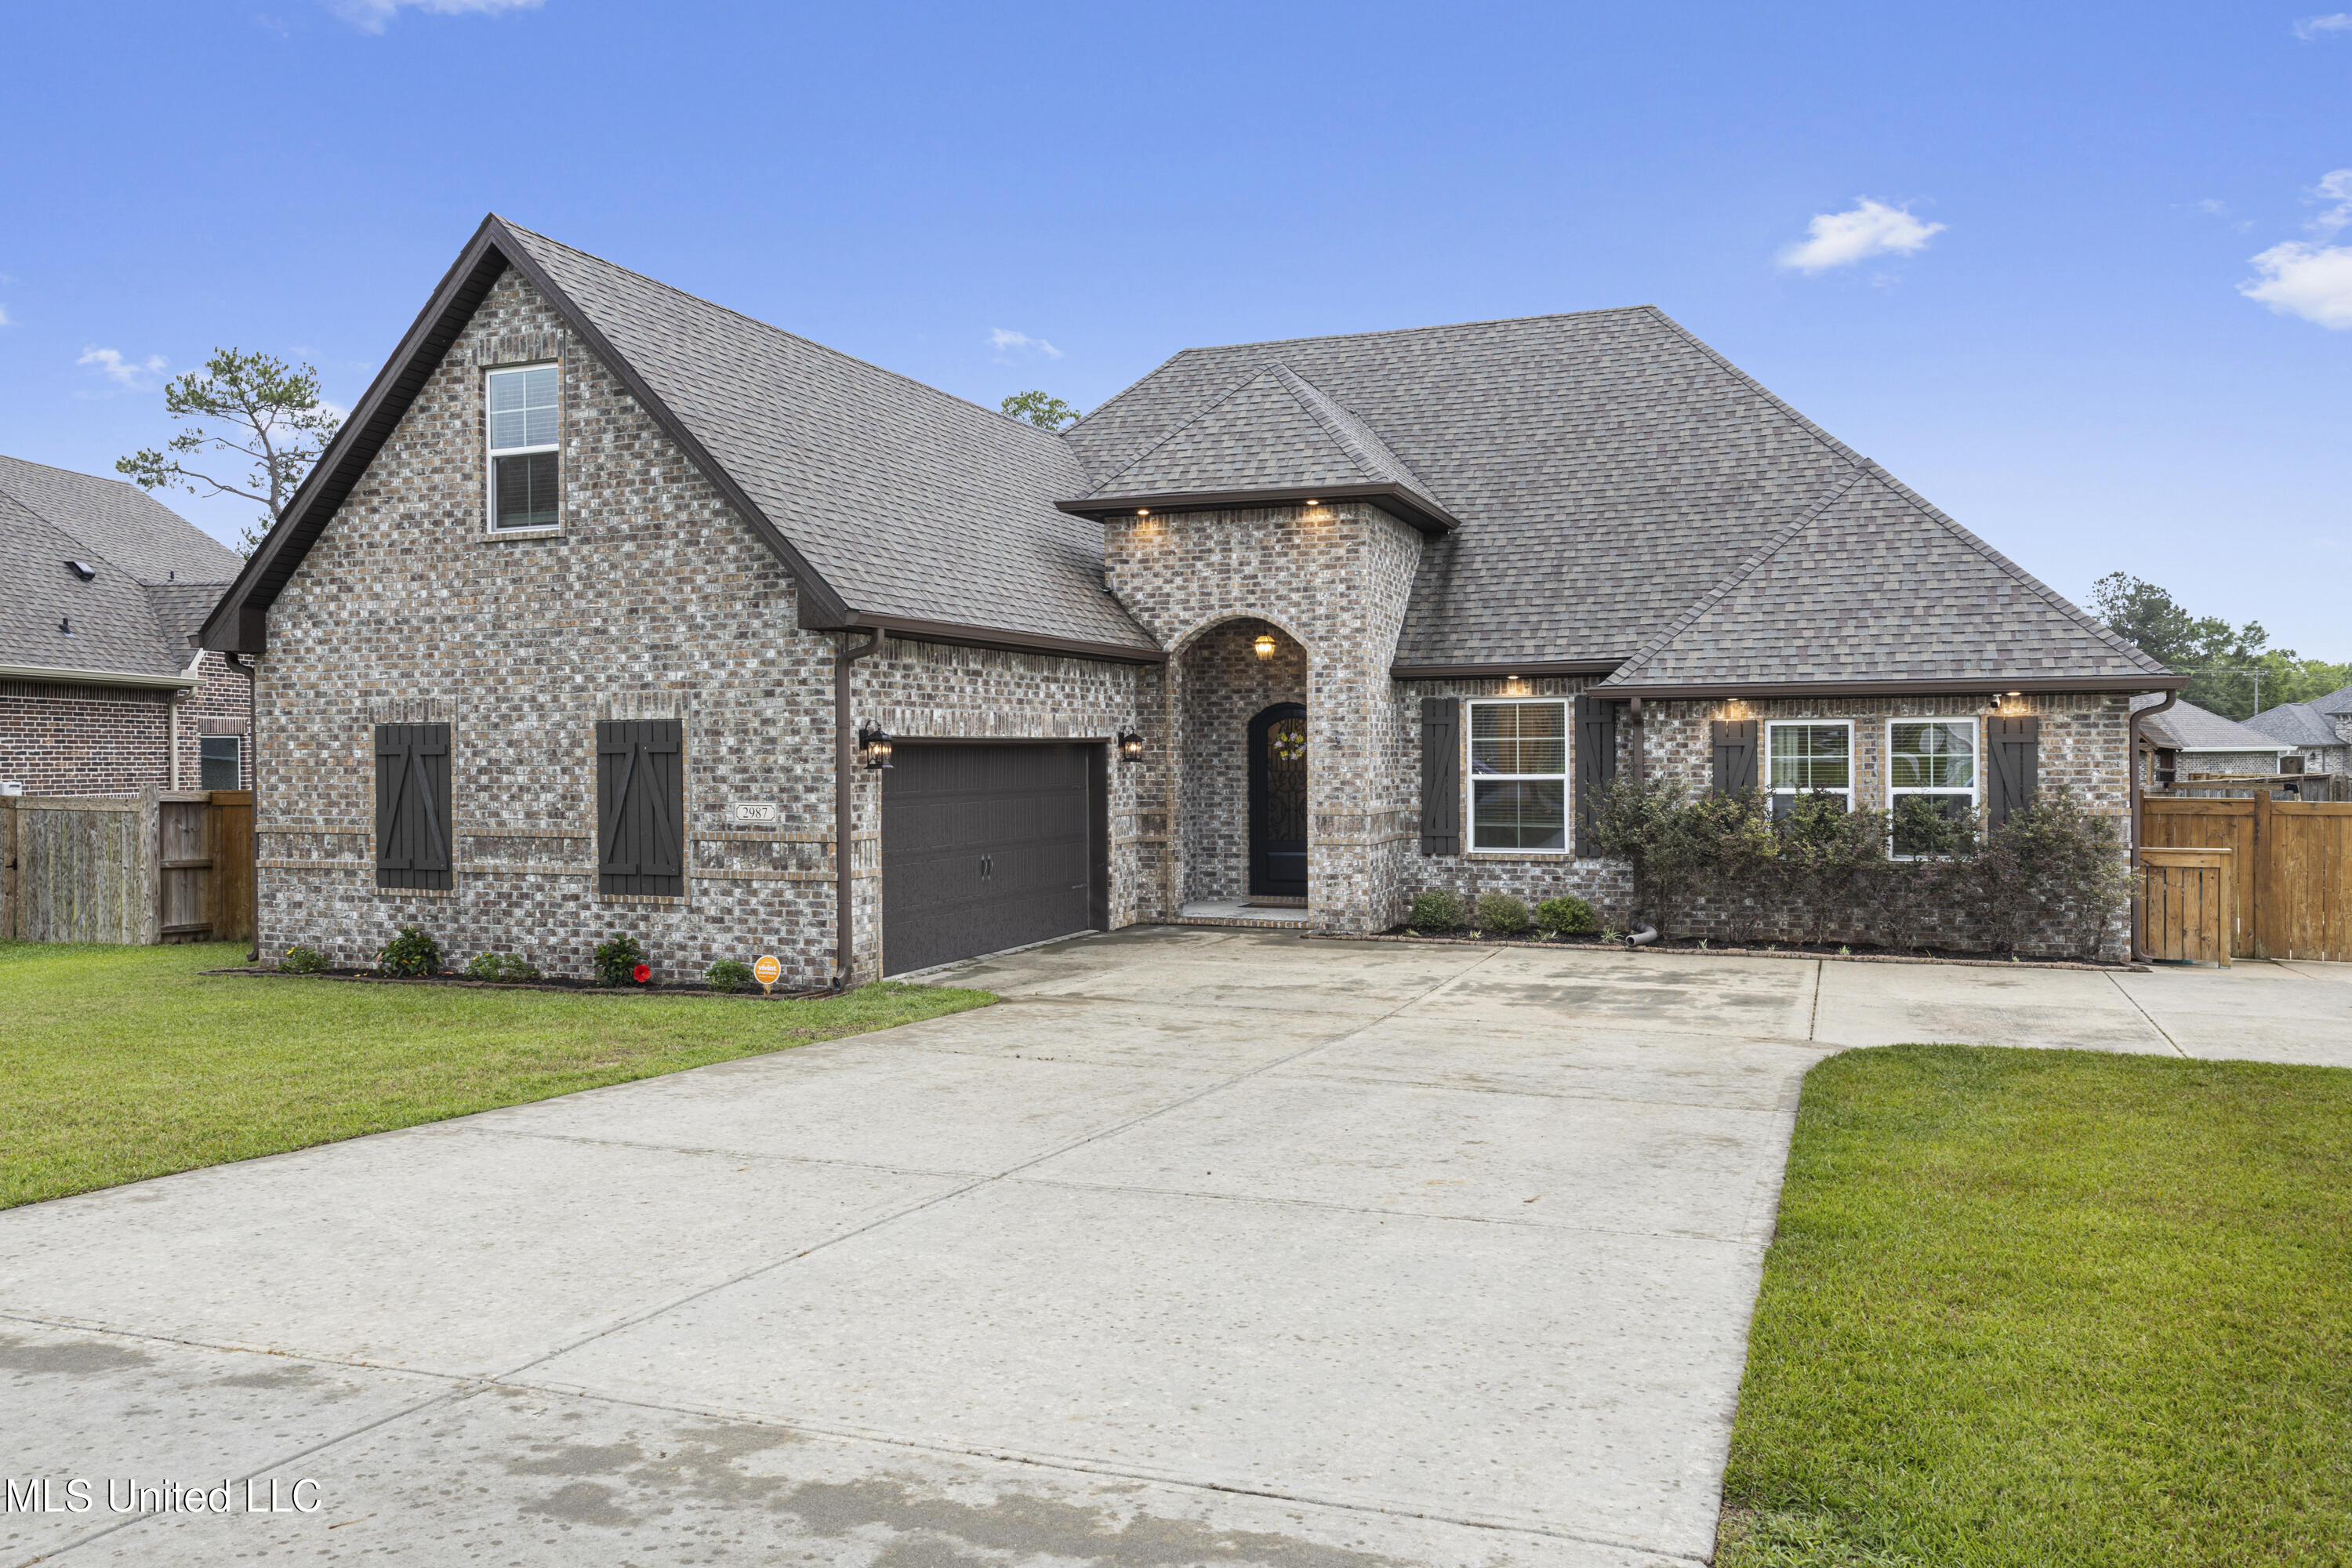
Active
$517,500
5
bds
|
3
ba
|
0
sqft
|
built
2021
2987 Rue Acadian Garden Dr, Biloxi, MS 39532
$-1,127
Cash flow
-11.4%
Cash-on-Cash Return
3.7%
Cap rate
0.5%
Rent to Value Ratio
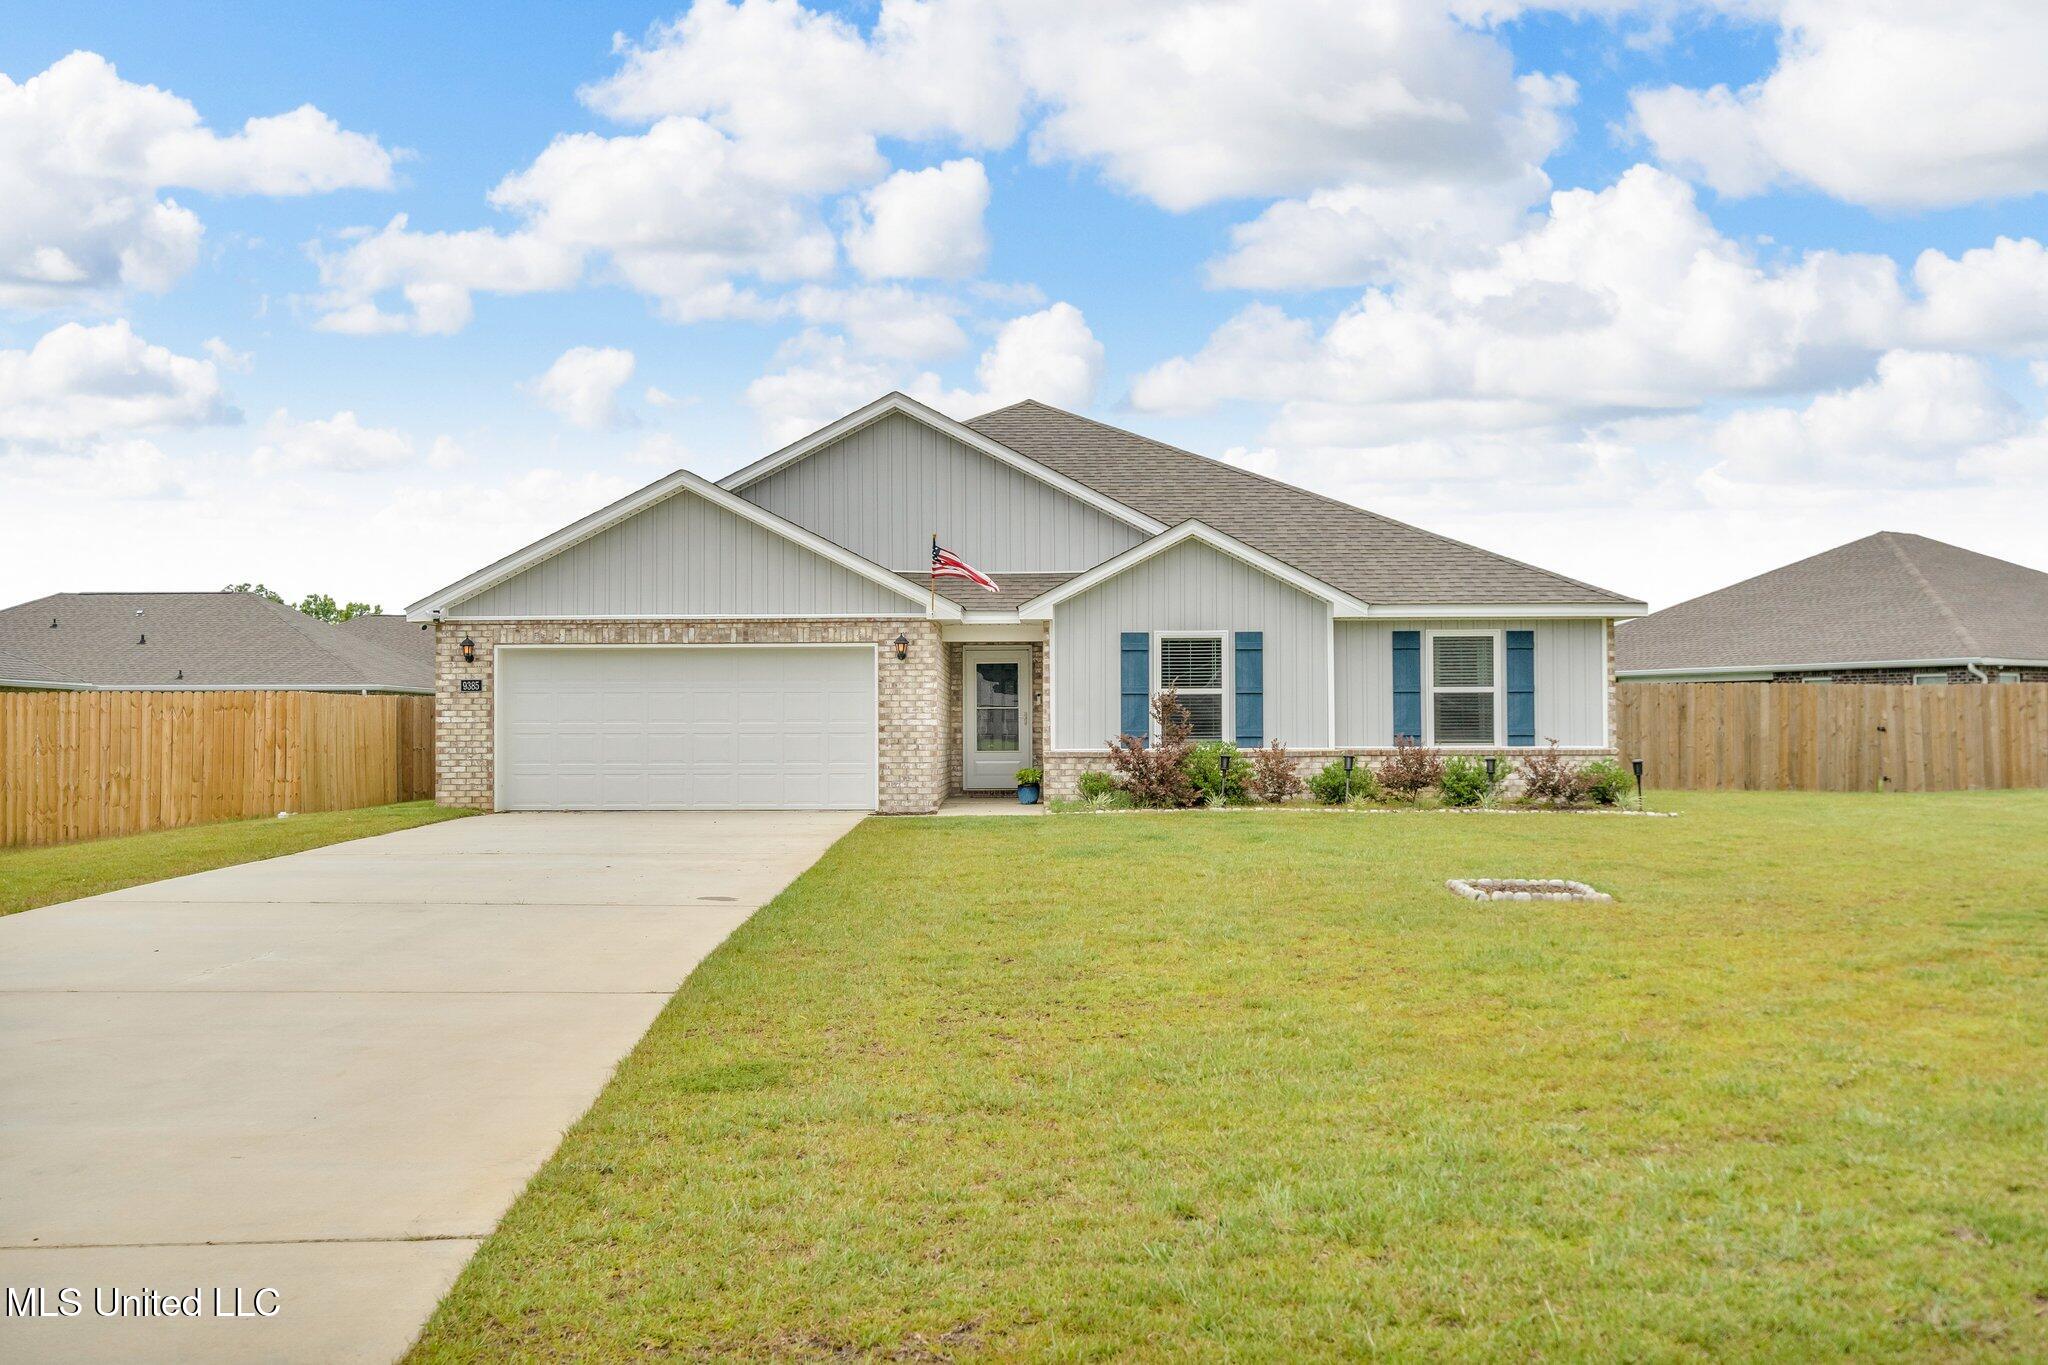
Active
$305,000
4
bds
|
2
ba
|
0
sqft
|
built
2023
9385 Cypress Lake Dr, Biloxi, MS 39532
$-101
Cash flow
-1.7%
Cash-on-Cash Return
5.9%
Cap rate
0.8%
Rent to Value Ratio
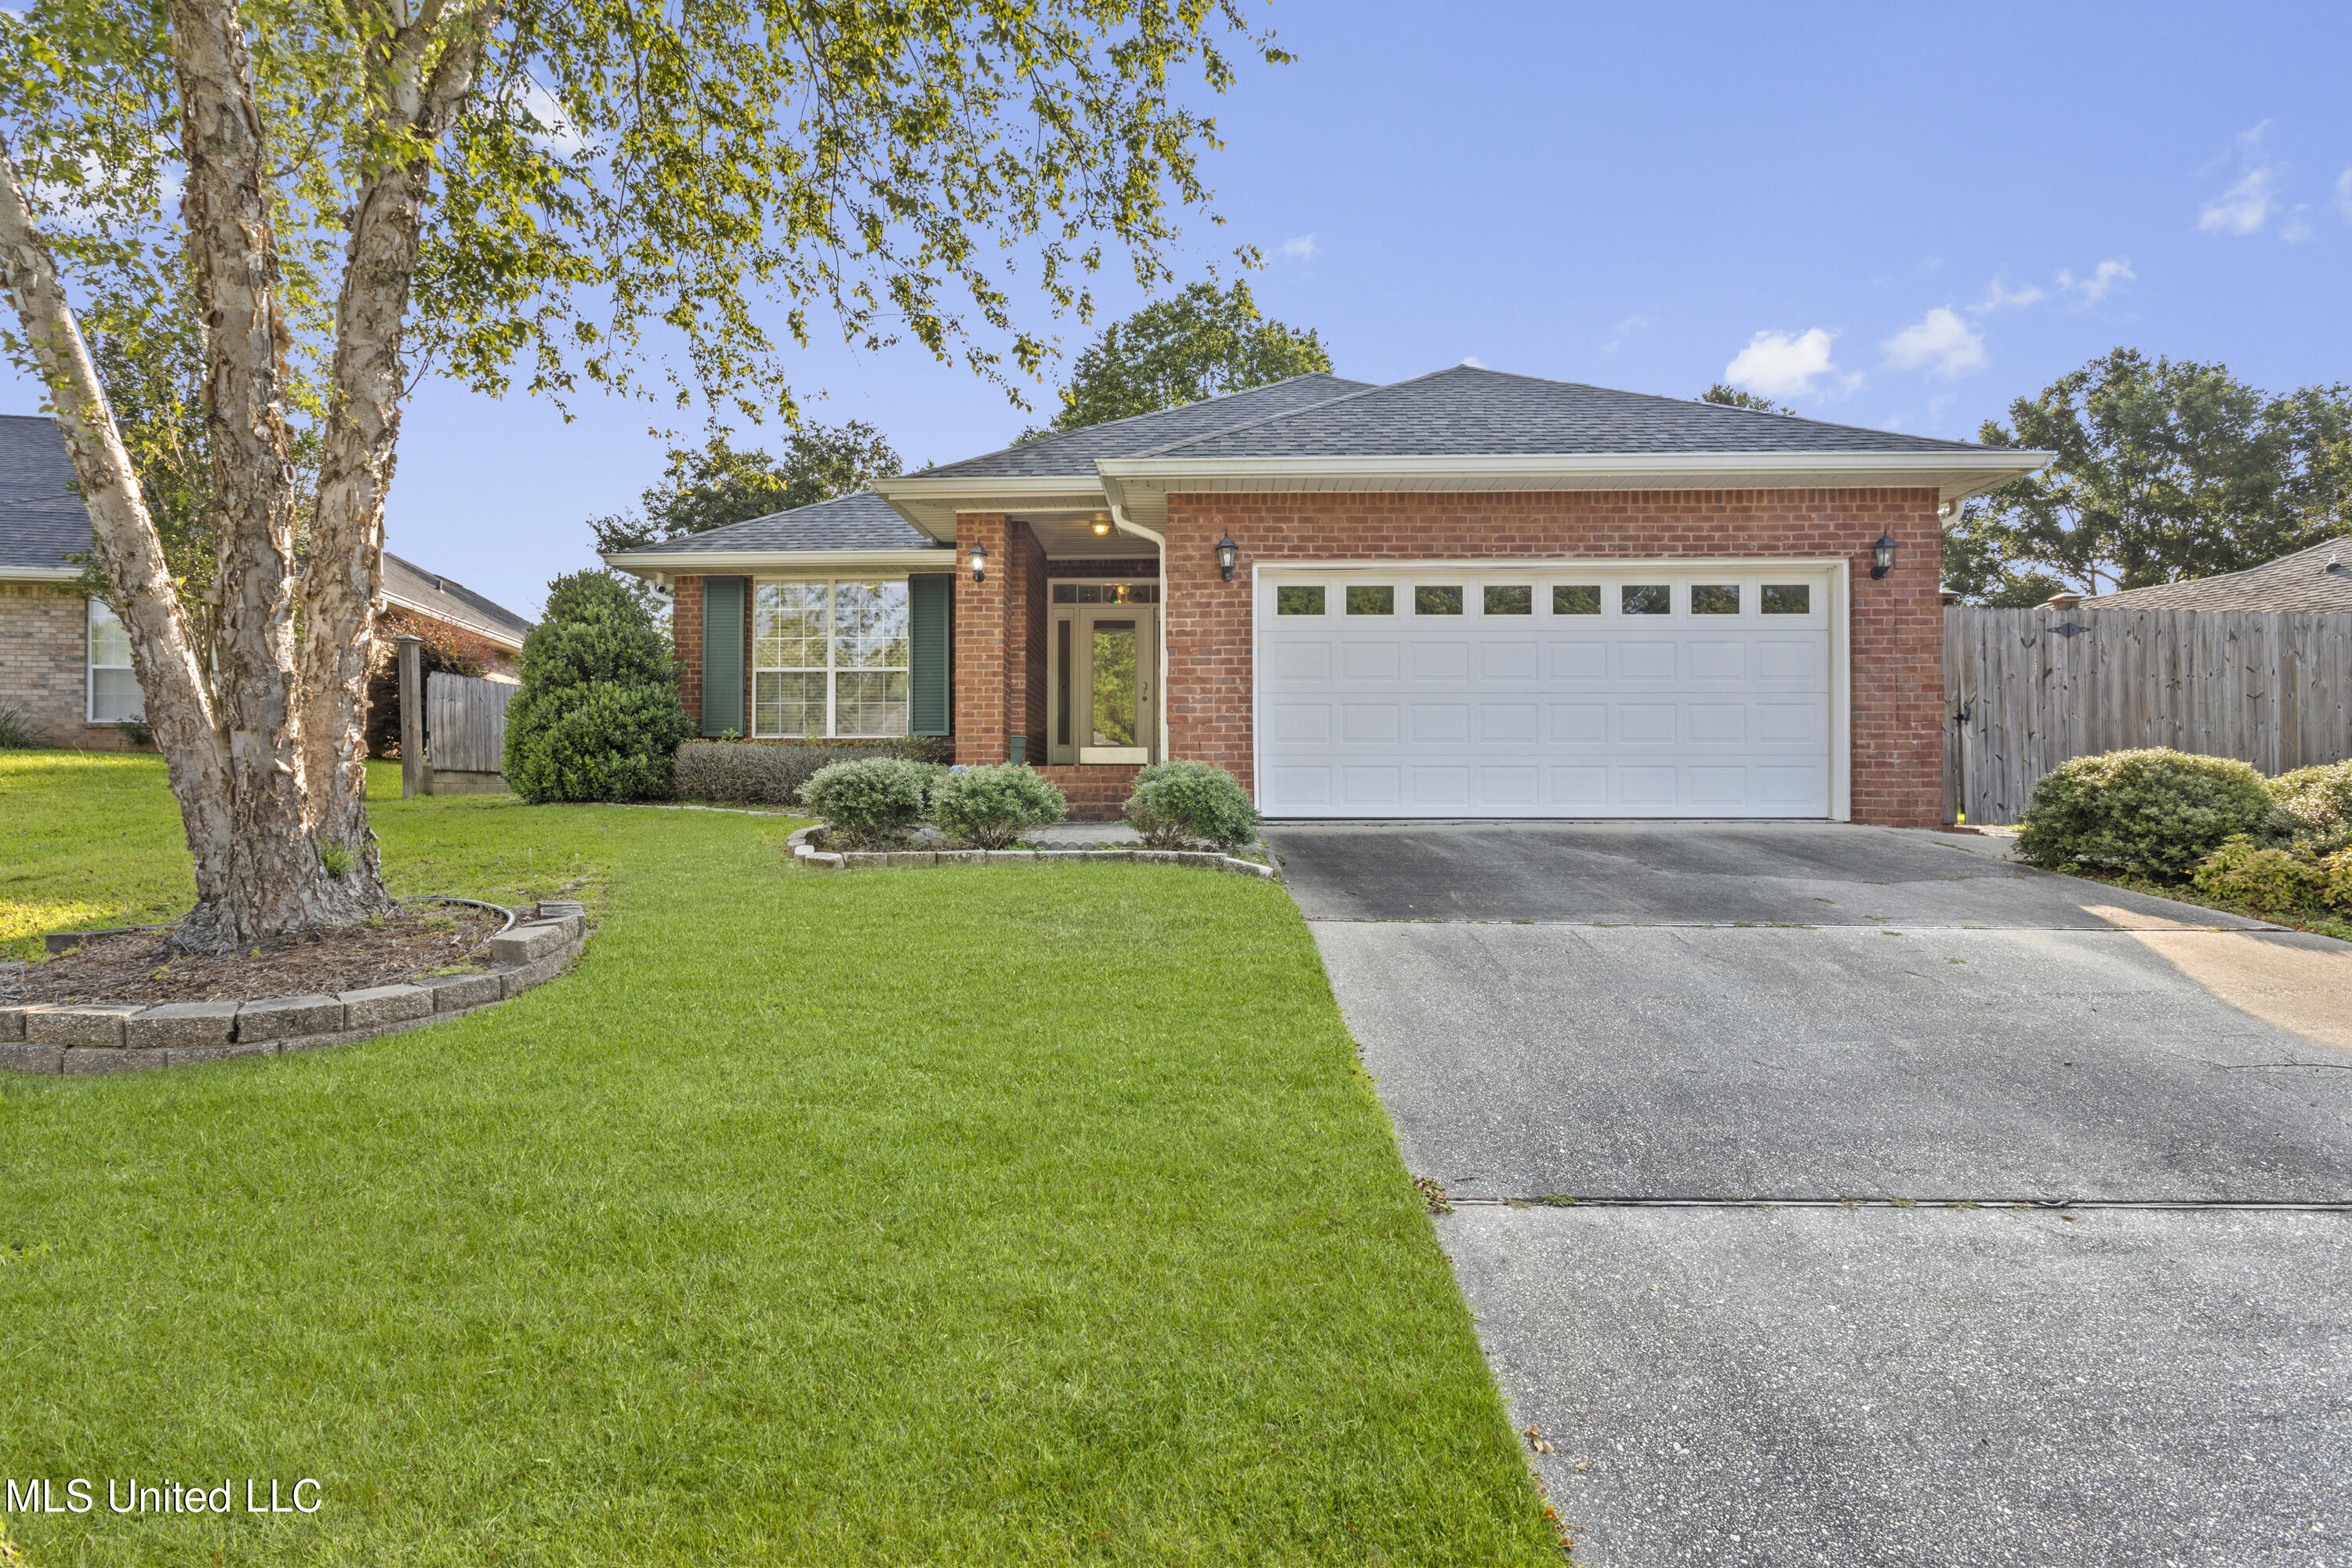
Active
$299,999
4
bds
|
2
ba
|
0
sqft
|
built
2006
15003 Greenwell Cir, Biloxi, MS 39532
$-44
Cash flow
-0.8%
Cash-on-Cash Return
6.1%
Cap rate
0.8%
Rent to Value Ratio
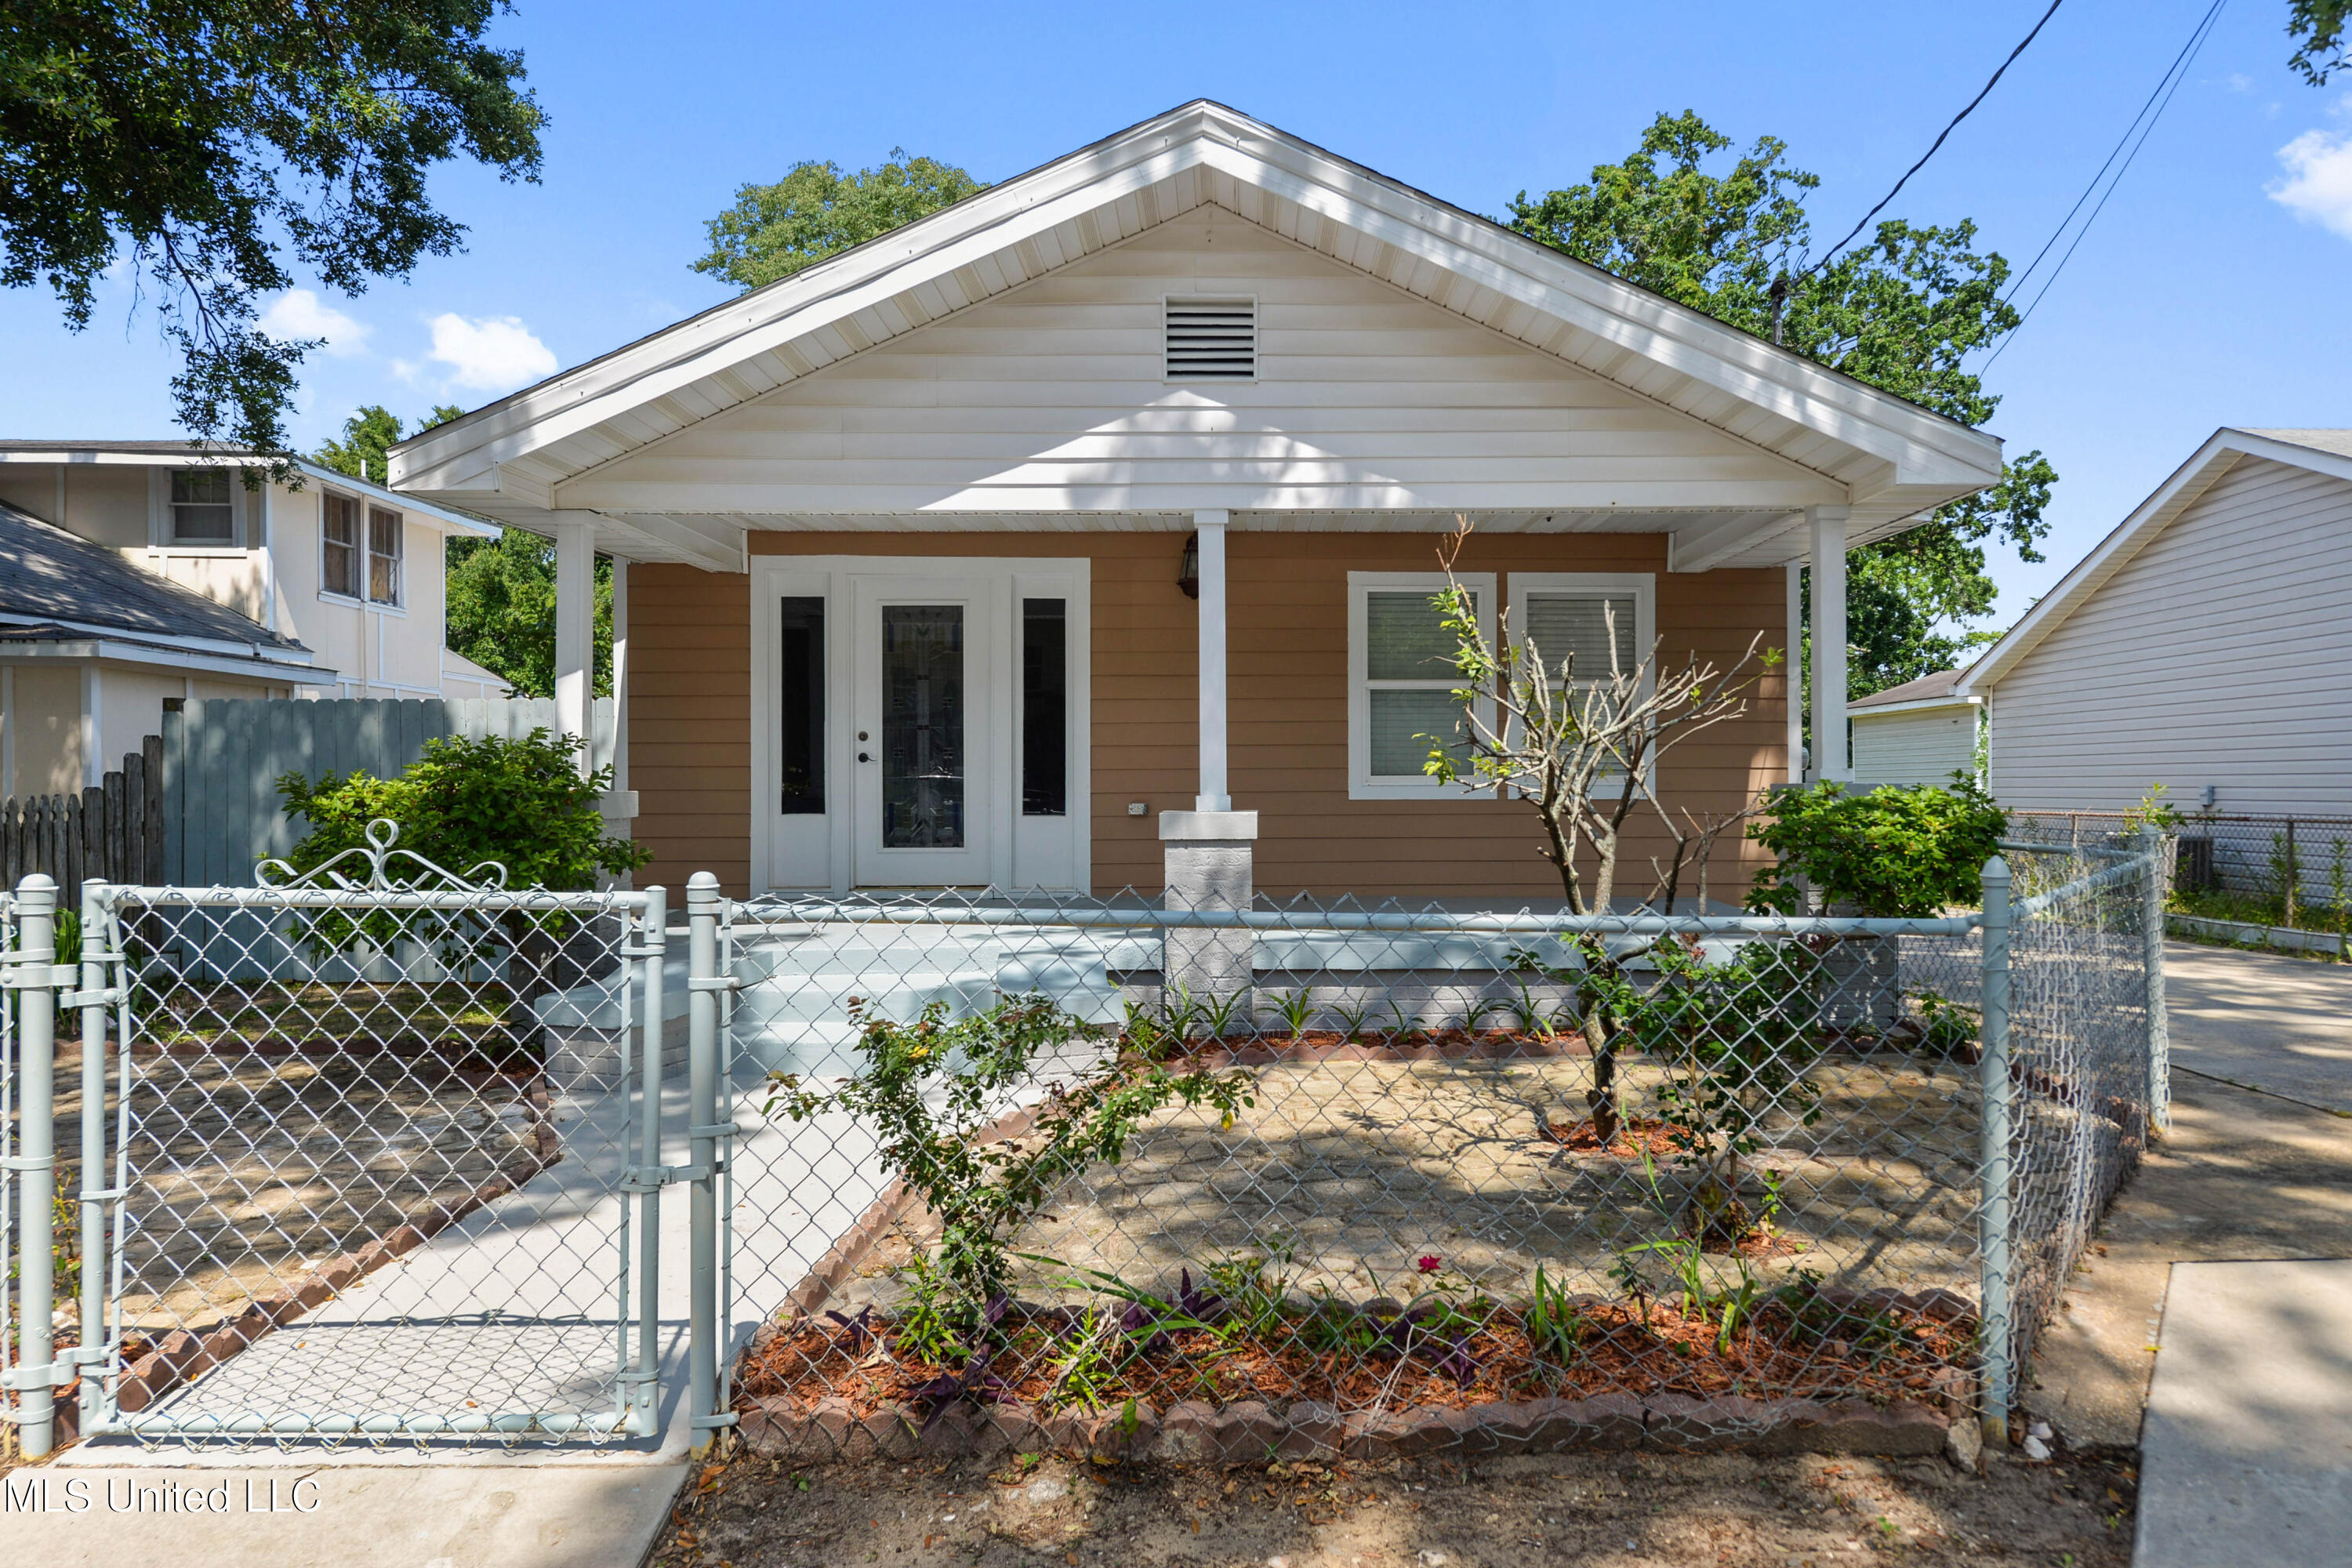
Active
$195,000
3
bds
|
2
ba
|
0
sqft
|
built
1934
184 Hoxie St, Biloxi, MS 39530
$-85
Cash flow
-2.3%
Cash-on-Cash Return
5.8%
Cap rate
0.8%
Rent to Value Ratio
Active
$292,000
3
bds
|
2
ba
|
0
sqft
|
built
1956
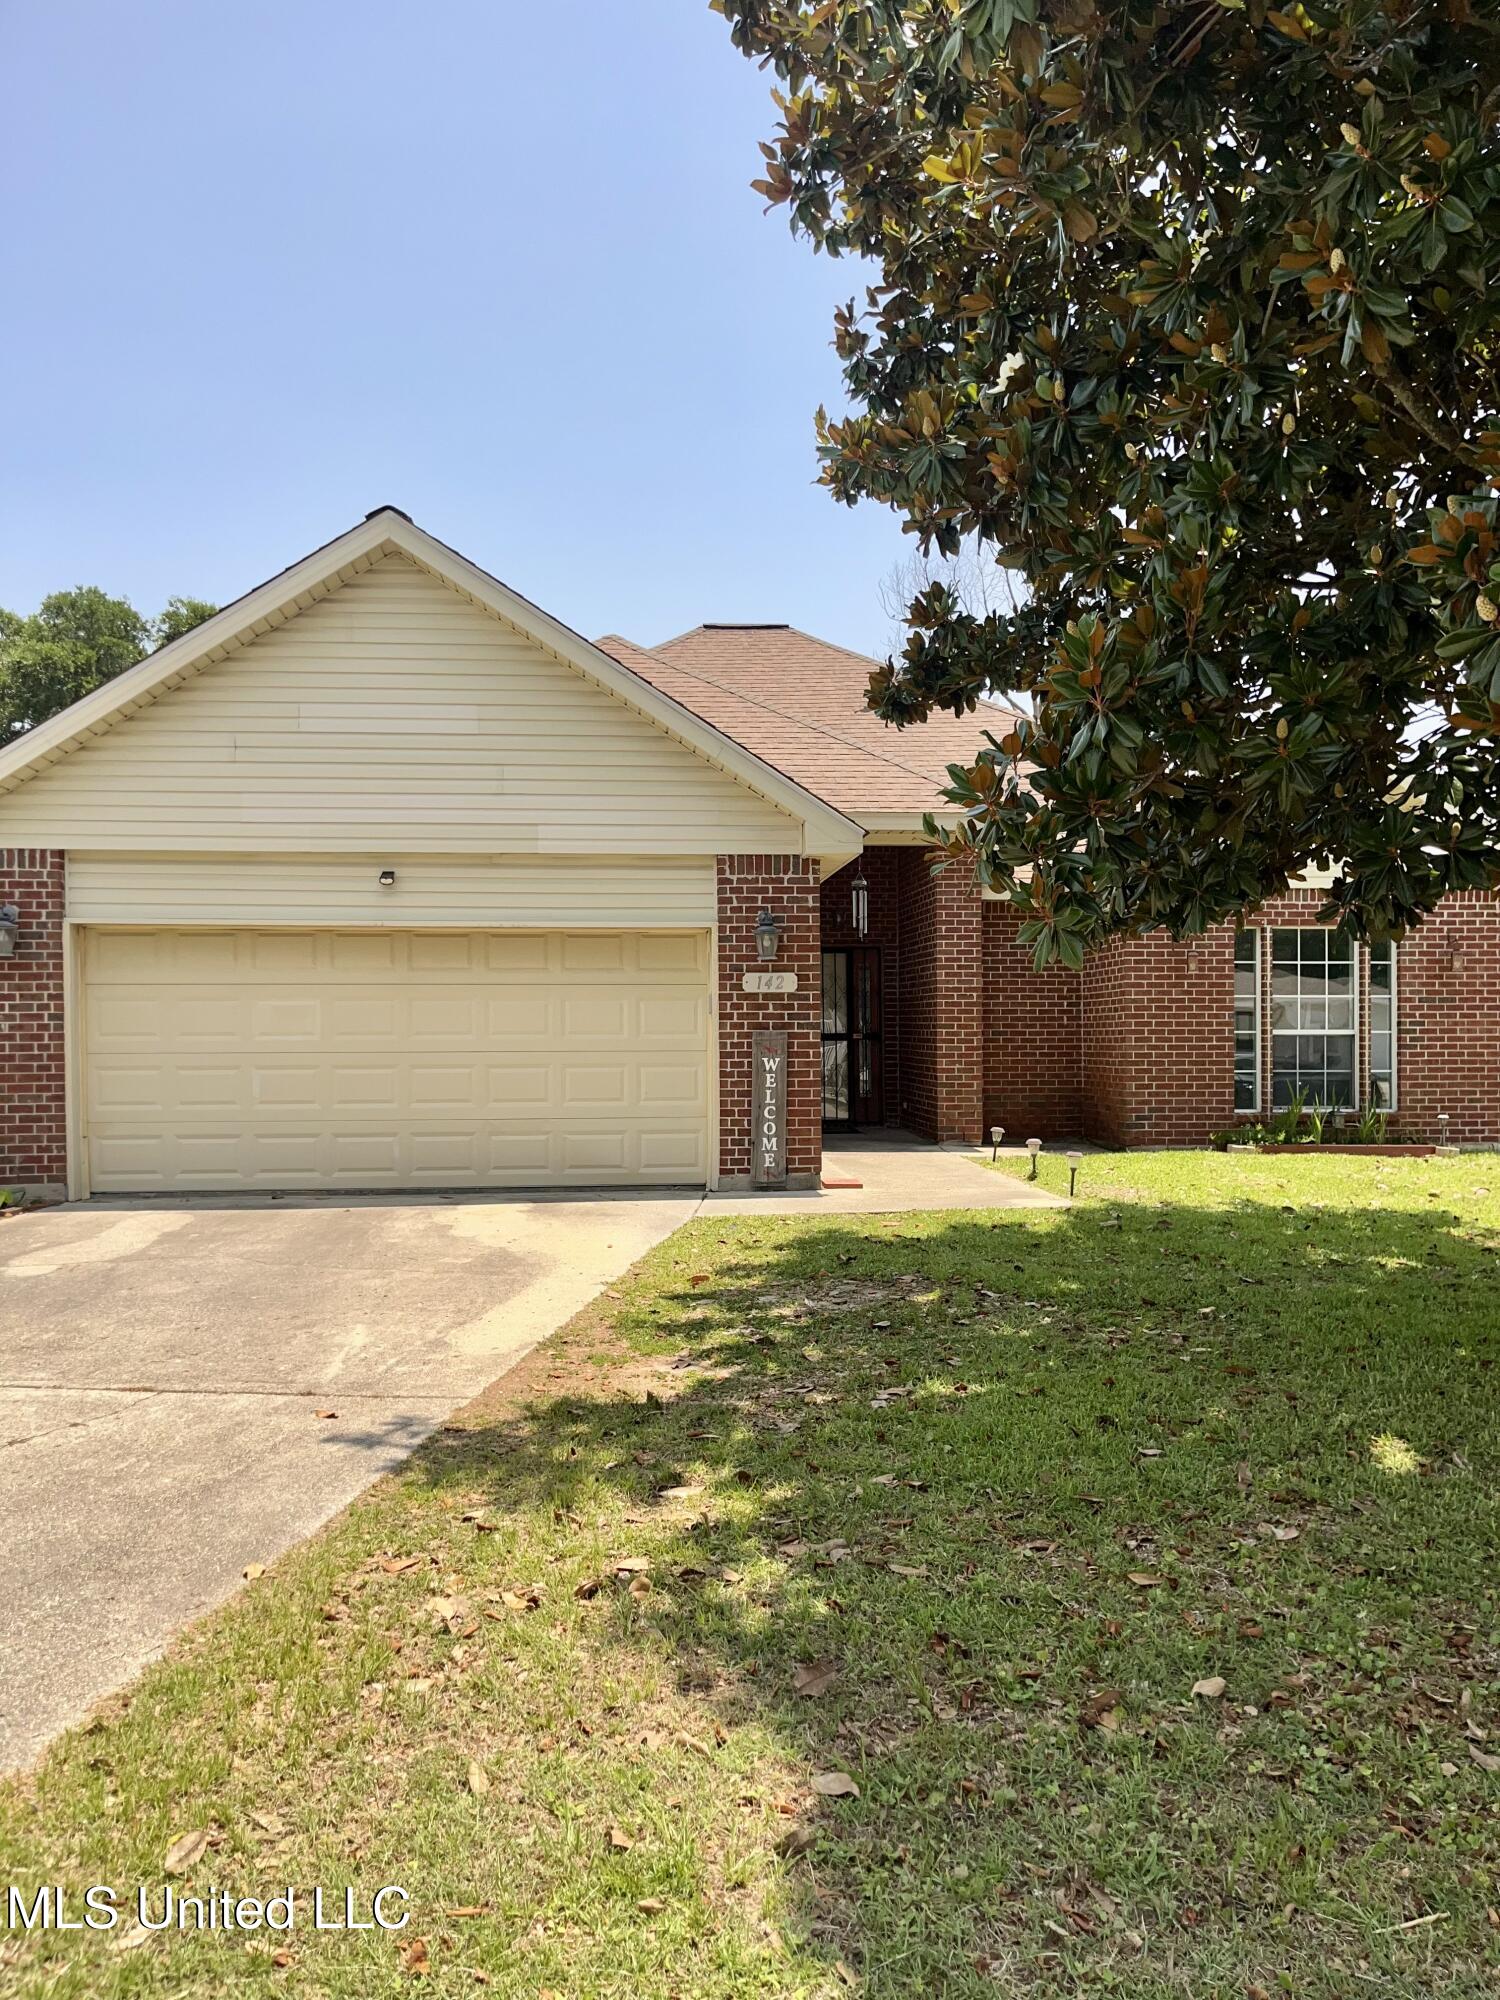
142 Pine Grove Ave, Biloxi, MS 39531
$-76
Cash flow
-1.4%
Cash-on-Cash Return
6.0%
Cap rate
0.8%
Rent to Value Ratio
Active
$280,000
4
bds
|
2
ba
|
0
sqft
|
built
1987
281 7th St, Biloxi, MS 39530
$-50
Cash flow
-0.9%
Cash-on-Cash Return
6.1%
Cap rate
0.8%
Rent to Value Ratio

Active
$269,000
4
bds
|
2
ba
|
0
sqft
|
built
1970
2285 Harkness Ct, Biloxi, MS 39532
$143
Cash flow
2.8%
Cash-on-Cash Return
6.9%
Cap rate
0.9%
Rent to Value Ratio
Active
$529,900
4
bds
|
3
ba
|
0
sqft
|
built
2011
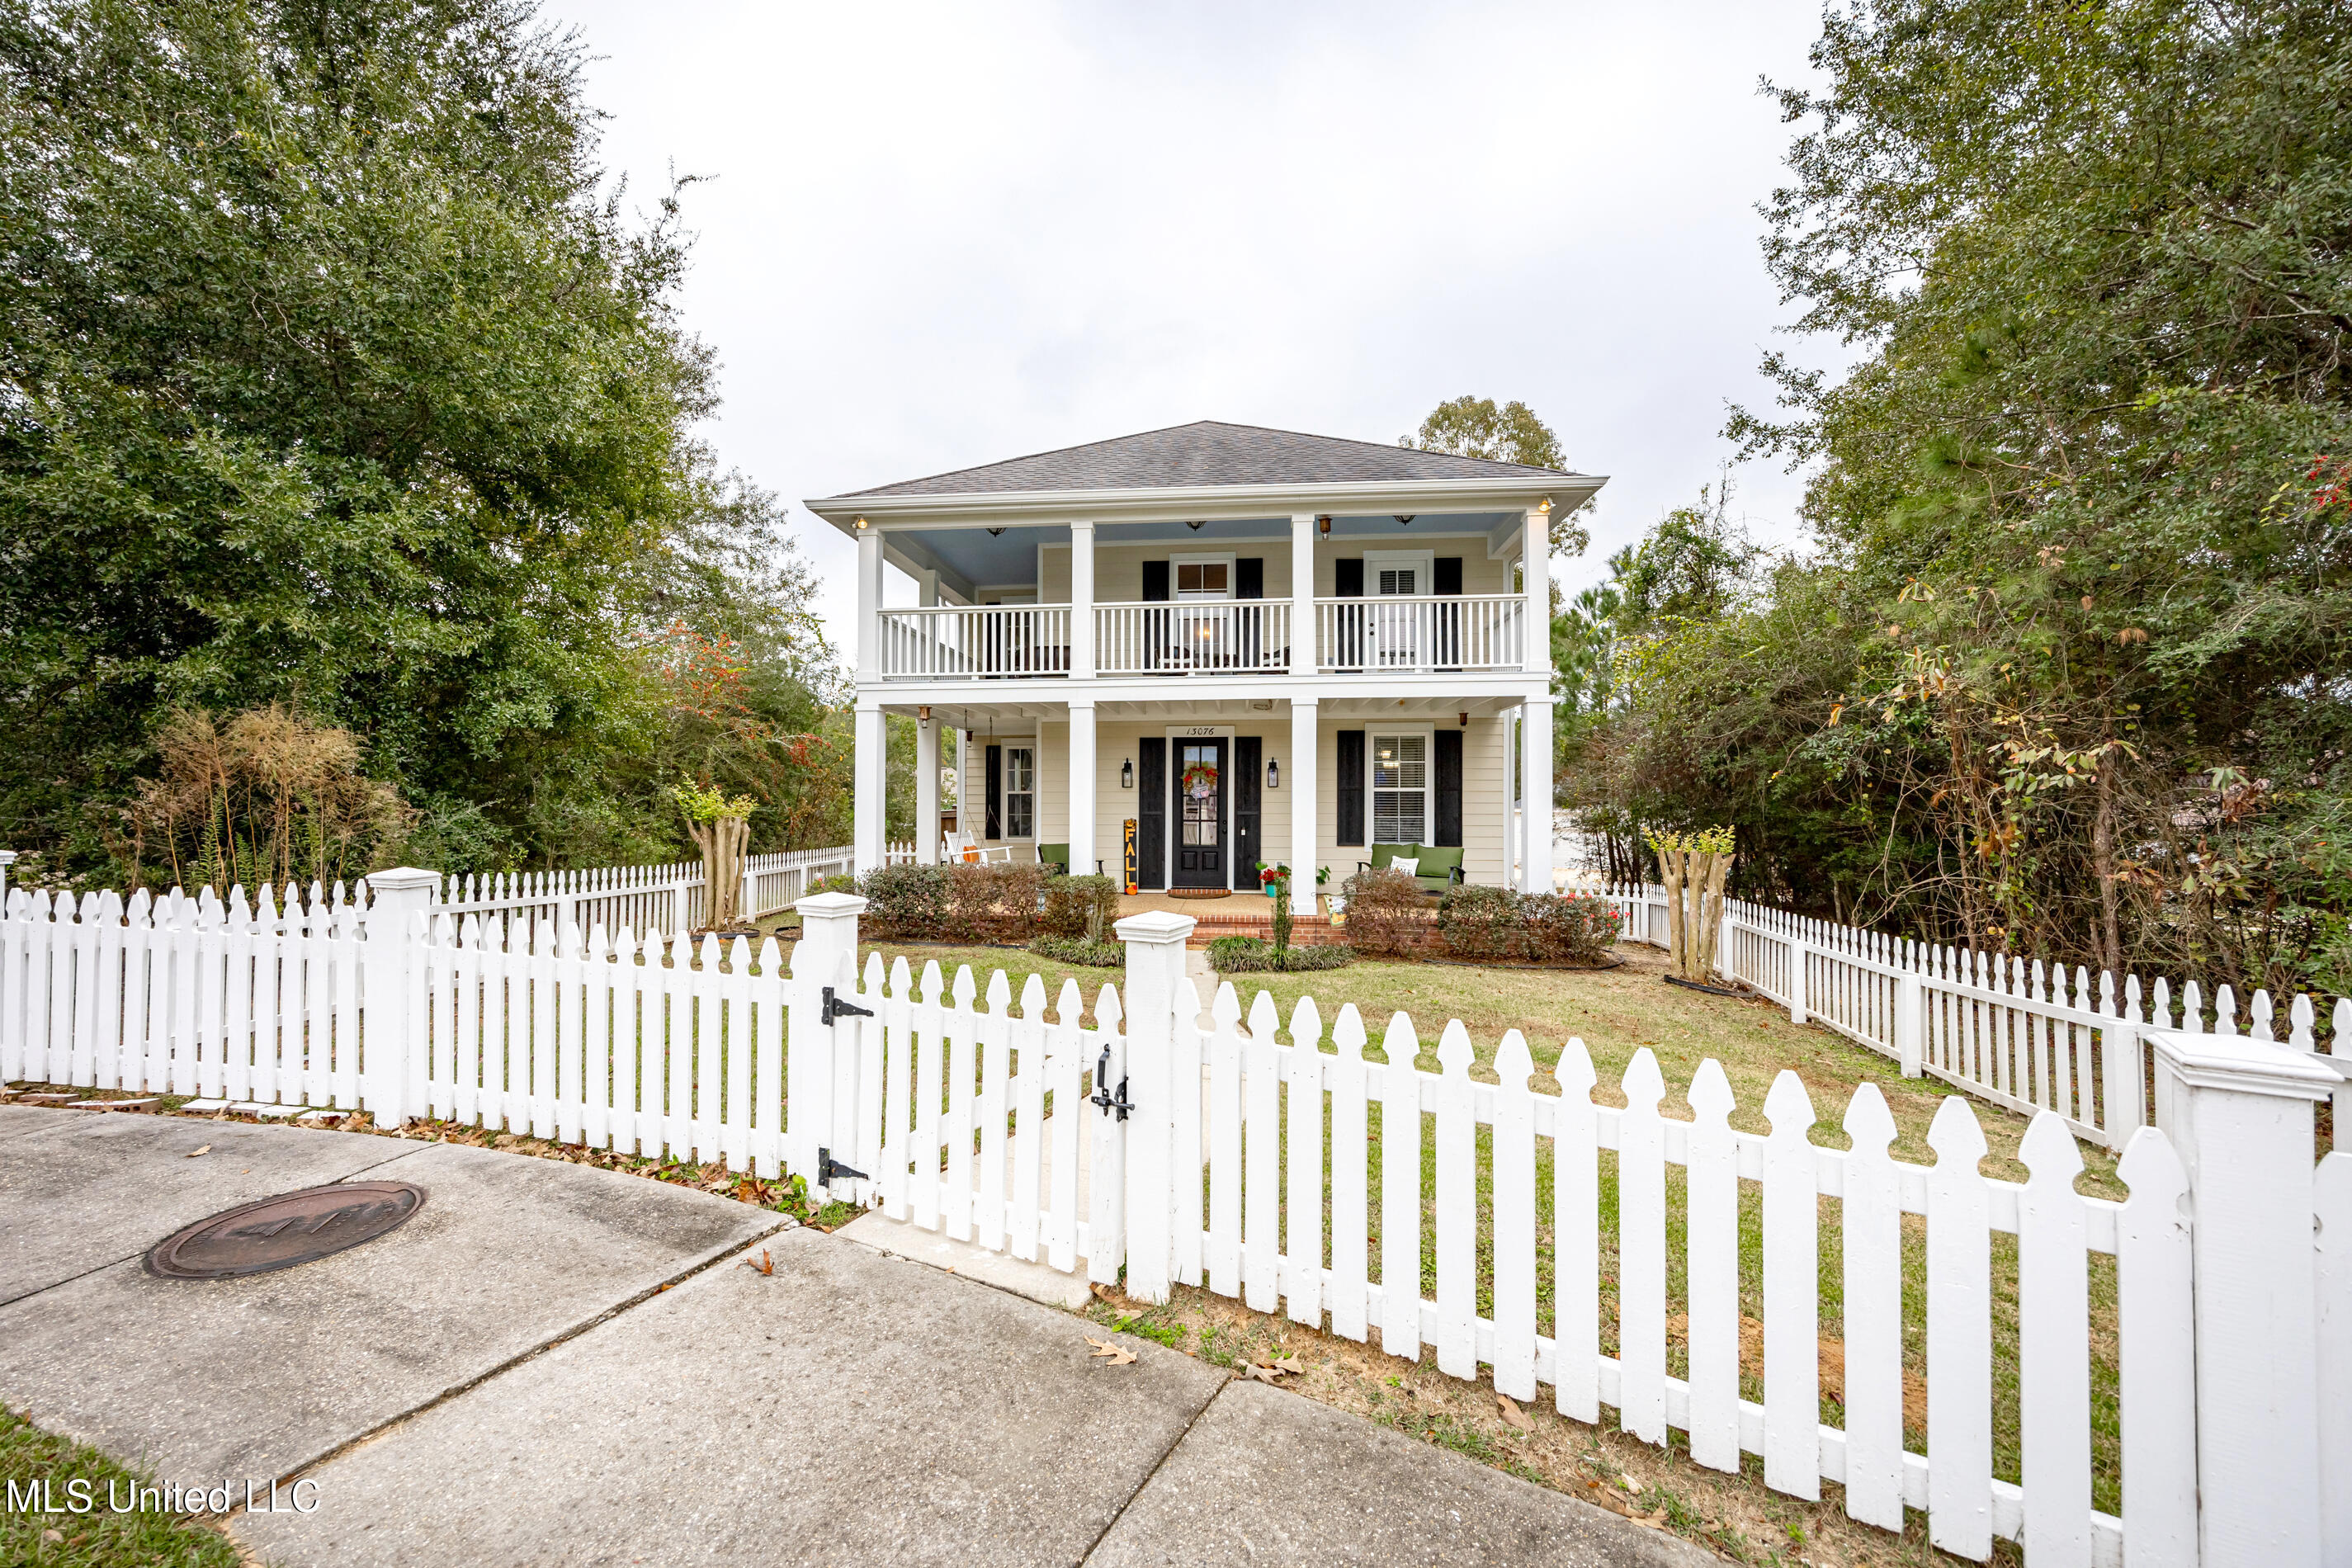
13076 Pine Vly, Biloxi, MS 39532
$-948
Cash flow
-9.3%
Cash-on-Cash Return
4.1%
Cap rate
0.6%
Rent to Value Ratio
Active
$229,900
4
bds
|
2
ba
|
0
sqft
|
built
1974
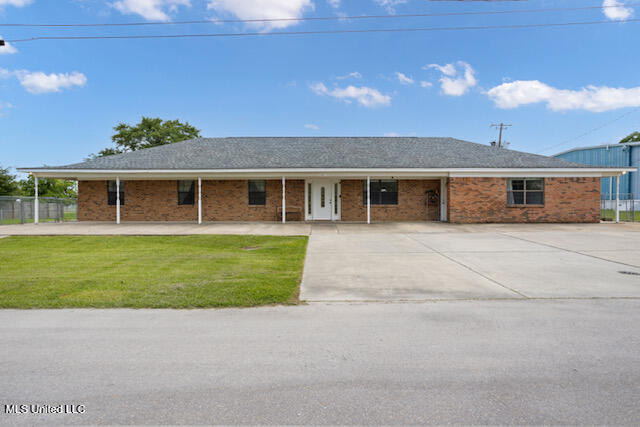
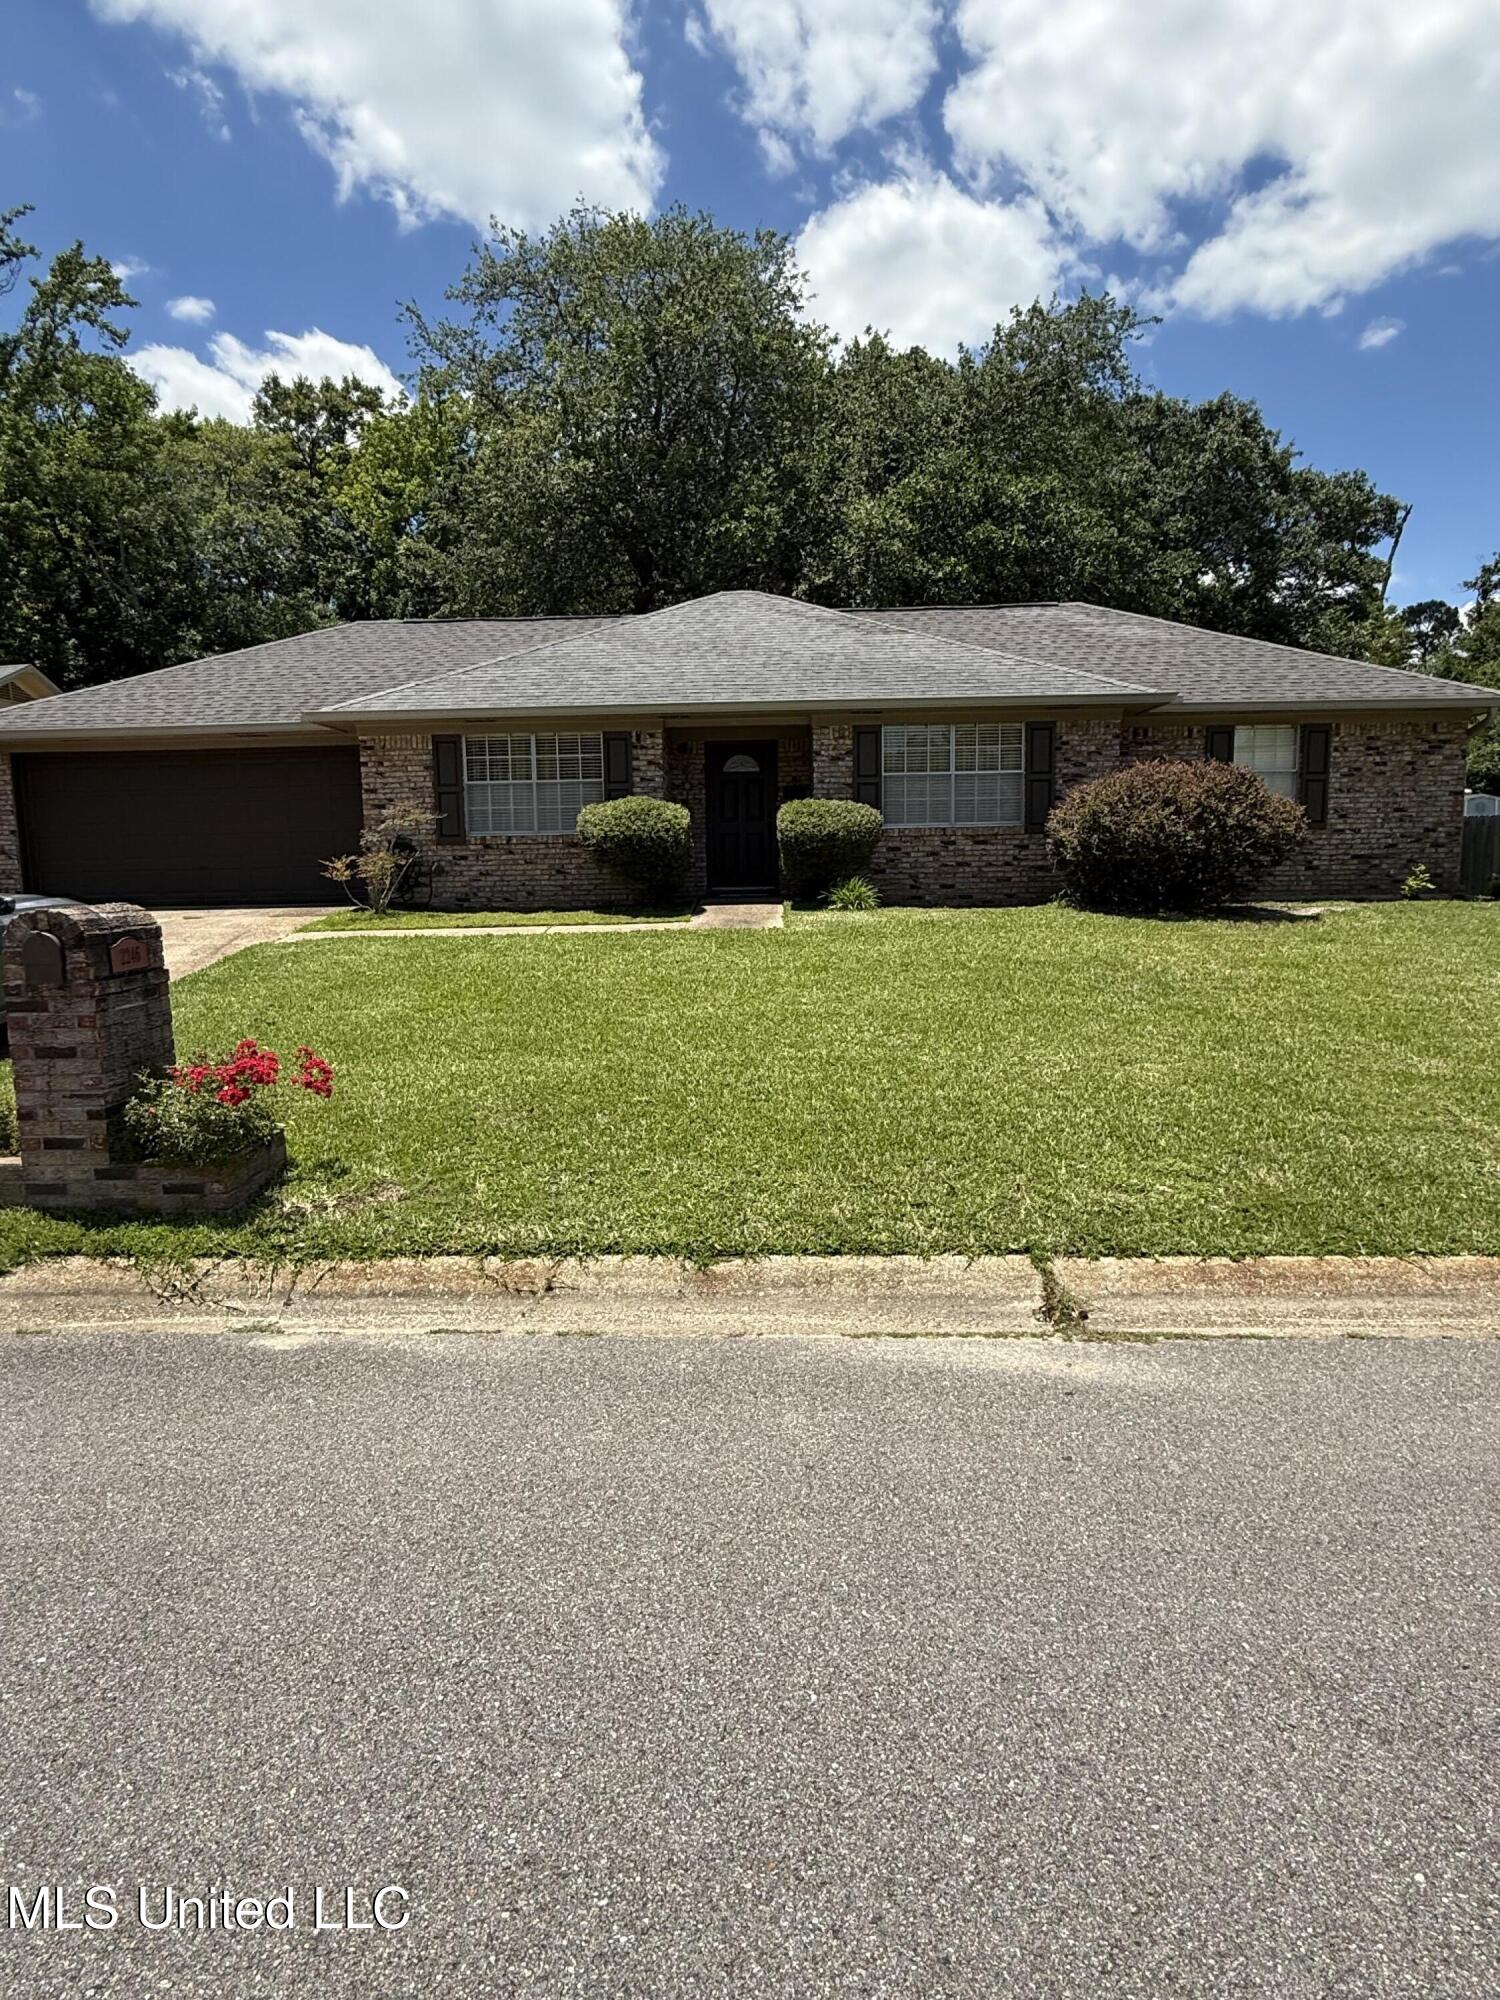
2246 Baywood Dr, Biloxi, MS 39532
$152
Cash flow
3.4%
Cash-on-Cash Return
7.1%
Cap rate
0.9%
Rent to Value Ratio
Active
$259,900
3
bds
|
2
ba
|
0
sqft
|
built
2009
15920 Hardwood Pl, Biloxi, MS 39532
$-178
Cash flow
-3.6%
Cash-on-Cash Return
5.5%
Cap rate
0.8%
Rent to Value Ratio

Active
$359,000
4
bds
|
4
ba
|
0
sqft
|
built
1980
13106 Hudson Krohn Rd, Biloxi, MS 39532
$-535
Cash flow
-7.8%
Cash-on-Cash Return
4.5%
Cap rate
0.6%
Rent to Value Ratio
Active
$274,900
3
bds
|
3
ba
|
0
sqft
|
built
1965
435 Forrest Ave, Biloxi, MS 39530
$-92
Cash flow
-1.7%
Cash-on-Cash Return
5.9%
Cap rate
0.7%
Rent to Value Ratio
Active
$189,900
4
bds
|
3
ba
|
0
sqft
|
built
1961
1028 Esposito St, Biloxi, MS 39530
$179
Cash flow
4.9%
Cash-on-Cash Return
7.4%
Cap rate
0.9%
Rent to Value Ratio

Active
$699,900
5
bds
|
3
ba
|
0
sqft
|
built
1977
416 Woodland Park Dr, Biloxi, MS 39531
$-1,129
Cash flow
-8.4%
Cash-on-Cash Return
4.3%
Cap rate
0.6%
Rent to Value Ratio
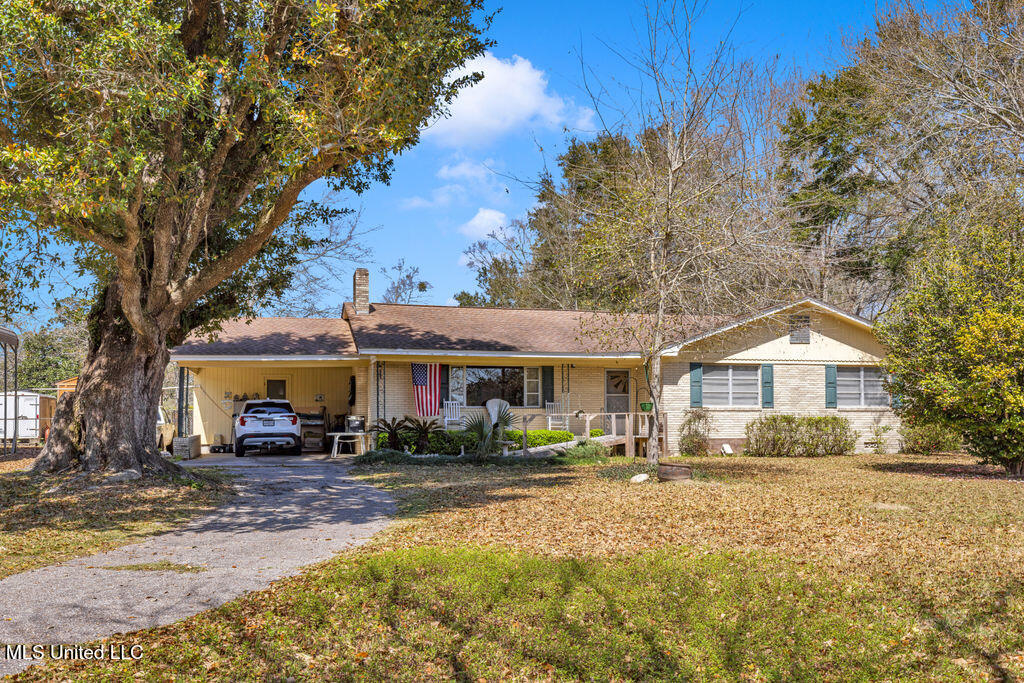
Active
$208,000
3
bds
|
2
ba
|
0
sqft
|
built
1958
15900 Van Eaton Cir, Biloxi, MS 39532
$40
Cash flow
1.0%
Cash-on-Cash Return
6.5%
Cap rate
0.8%
Rent to Value Ratio
Active
$105,000
2
bds
|
1
ba
|
0
sqft
|
built
1950
15917 Van Eaton Cir, Biloxi, MS 39532
$252
Cash flow
12.5%
Cash-on-Cash Return
9.2%
Cap rate
1.2%
Rent to Value Ratio