Biloxi, MS Investment Properties for Sale
Browse homes for sale and investment properties in Biloxi, MS. Refine your search by price, property type, or more.
Best cash flowing properties in Biloxi, MS

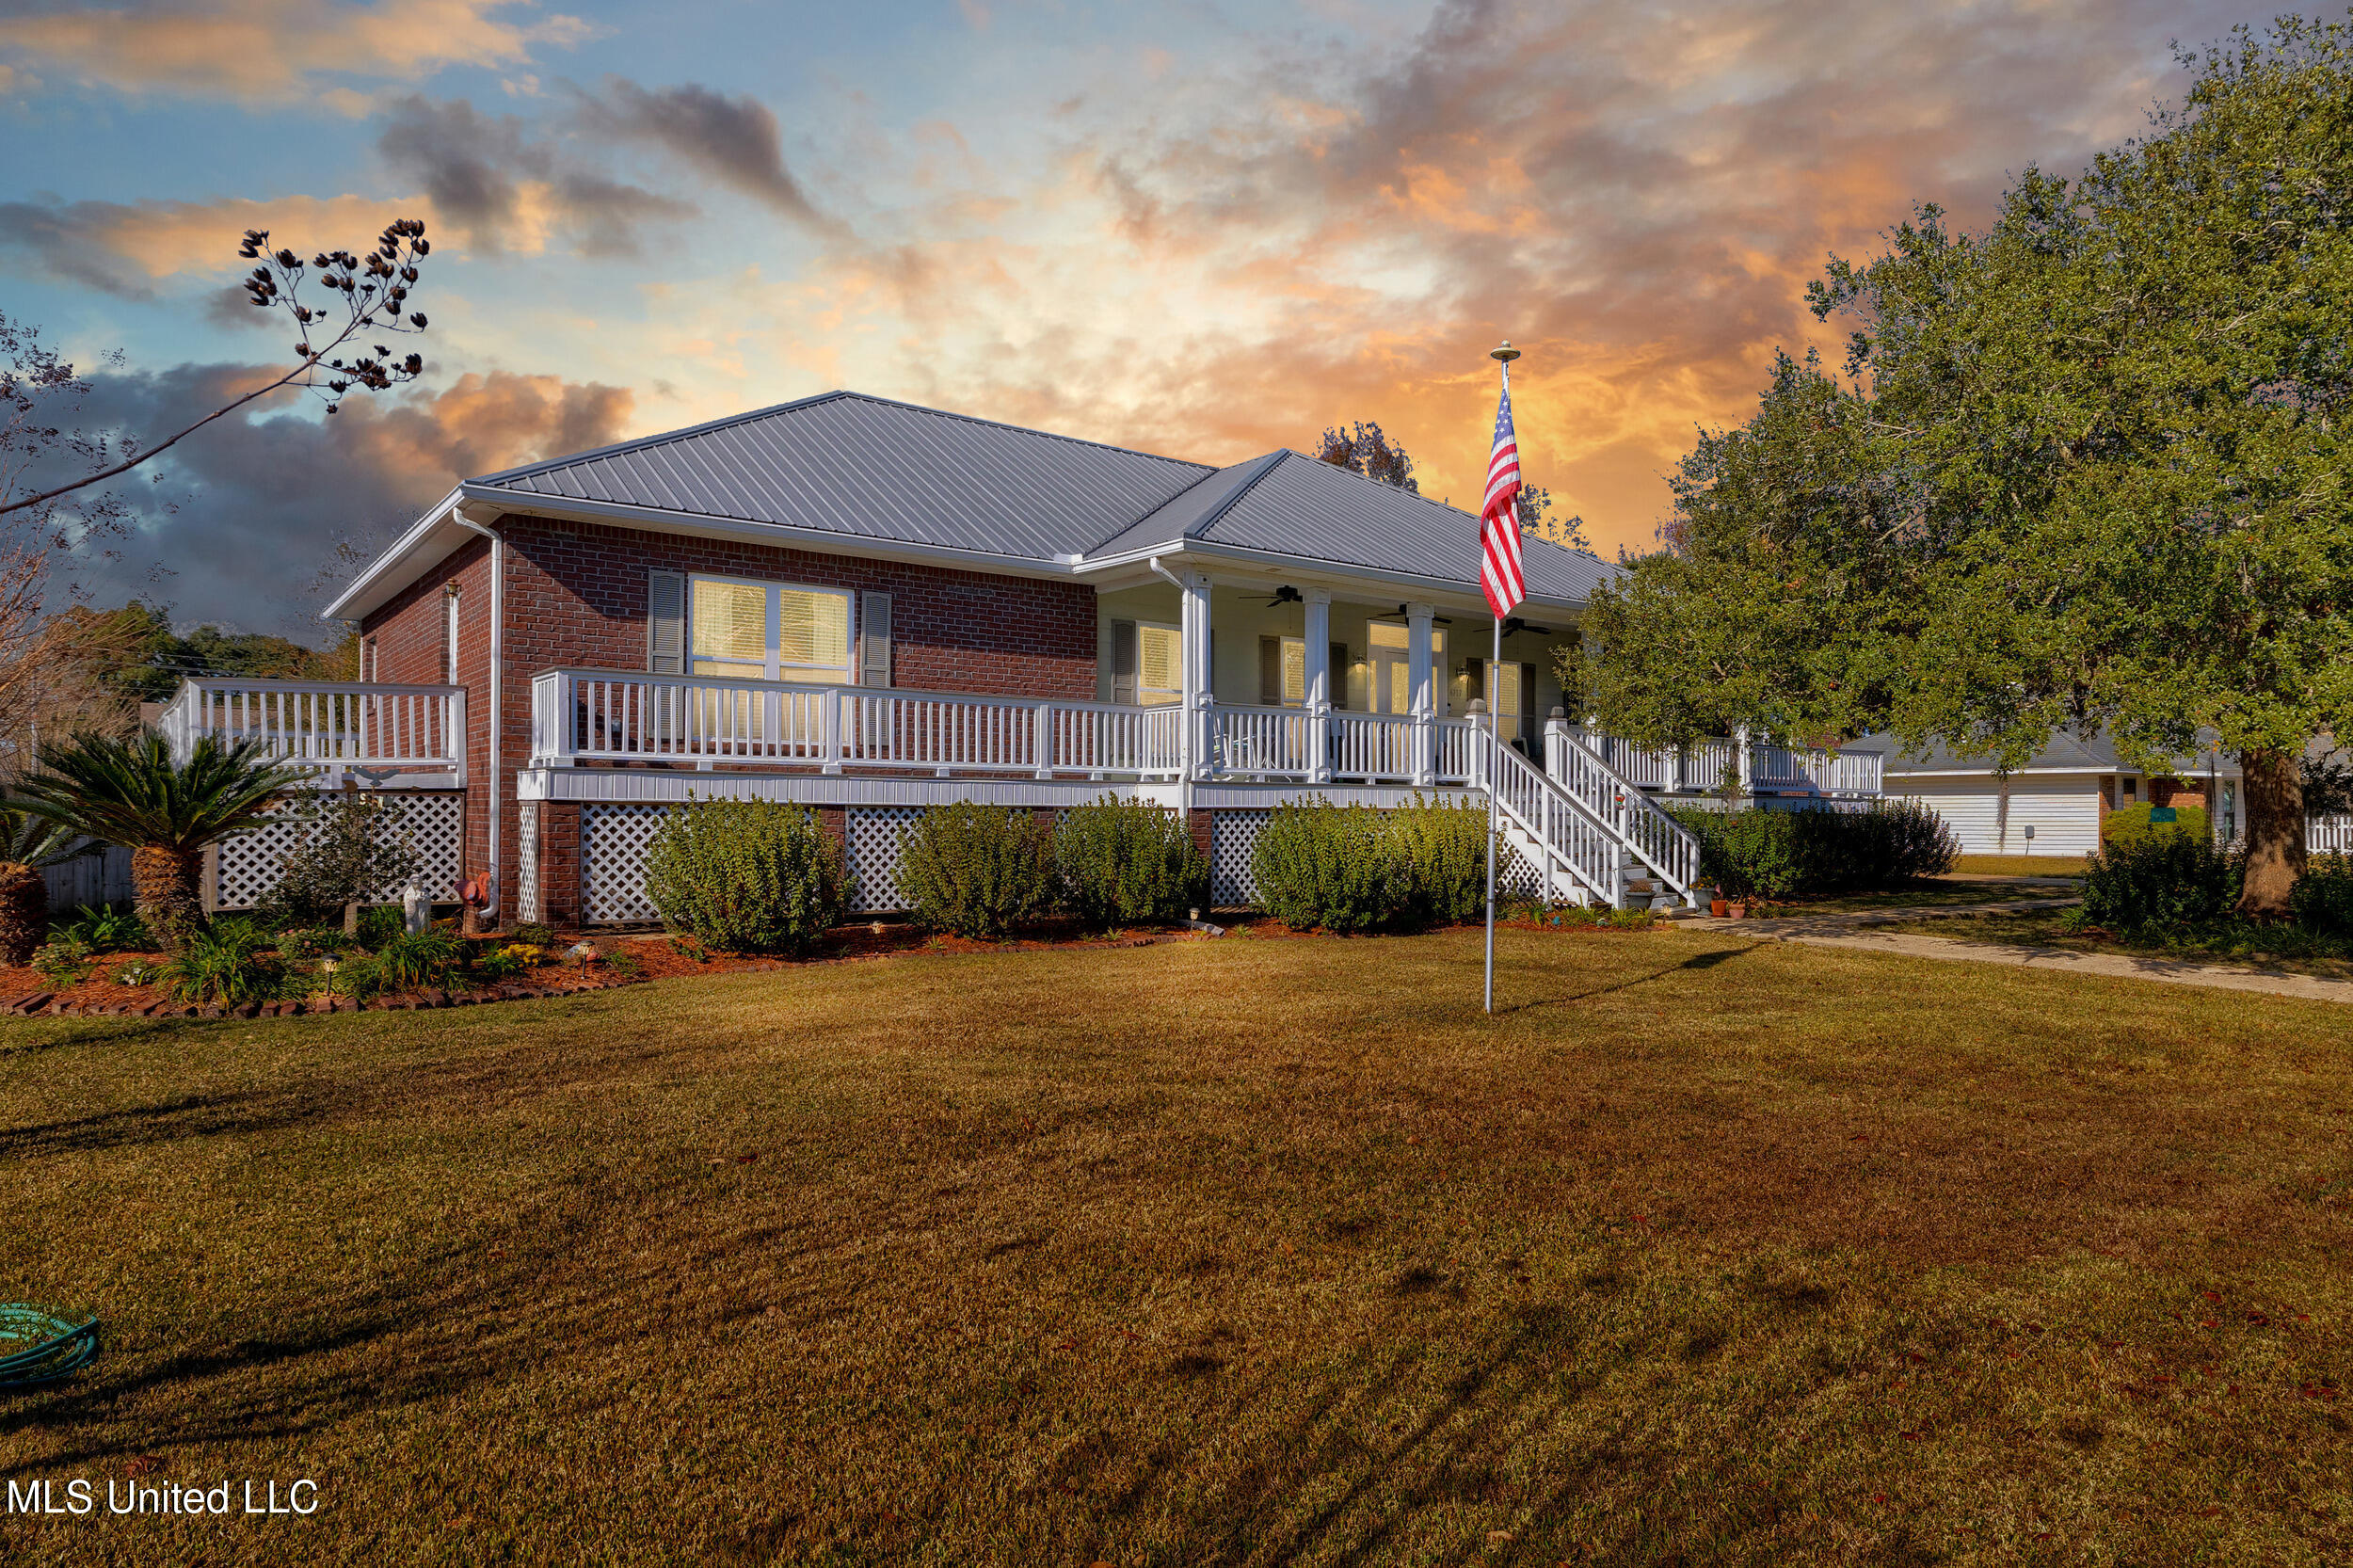
Active
$424,900
5
bds
|
3
ba
|
0
sqft
|
built
1980
441 Linda Dr, Biloxi, MS 39531
$457
Cash flow
5.6%
Cash-on-Cash Return
7.6%
Cap rate
1.1%
Rent to Value Ratio

Active
$259,000
2
bds
|
1
ba
|
0
sqft
|
built
1965
9201 Woolmarket Rd, Biloxi, MS 39532
$250
Cash flow
5.0%
Cash-on-Cash Return
7.4%
Cap rate
1.0%
Rent to Value Ratio
223 out of 246 properties for sale in Biloxi, MS
Limited Results Shown
Create a free account, or log in to reveal all property listings and enjoy the complete experience.
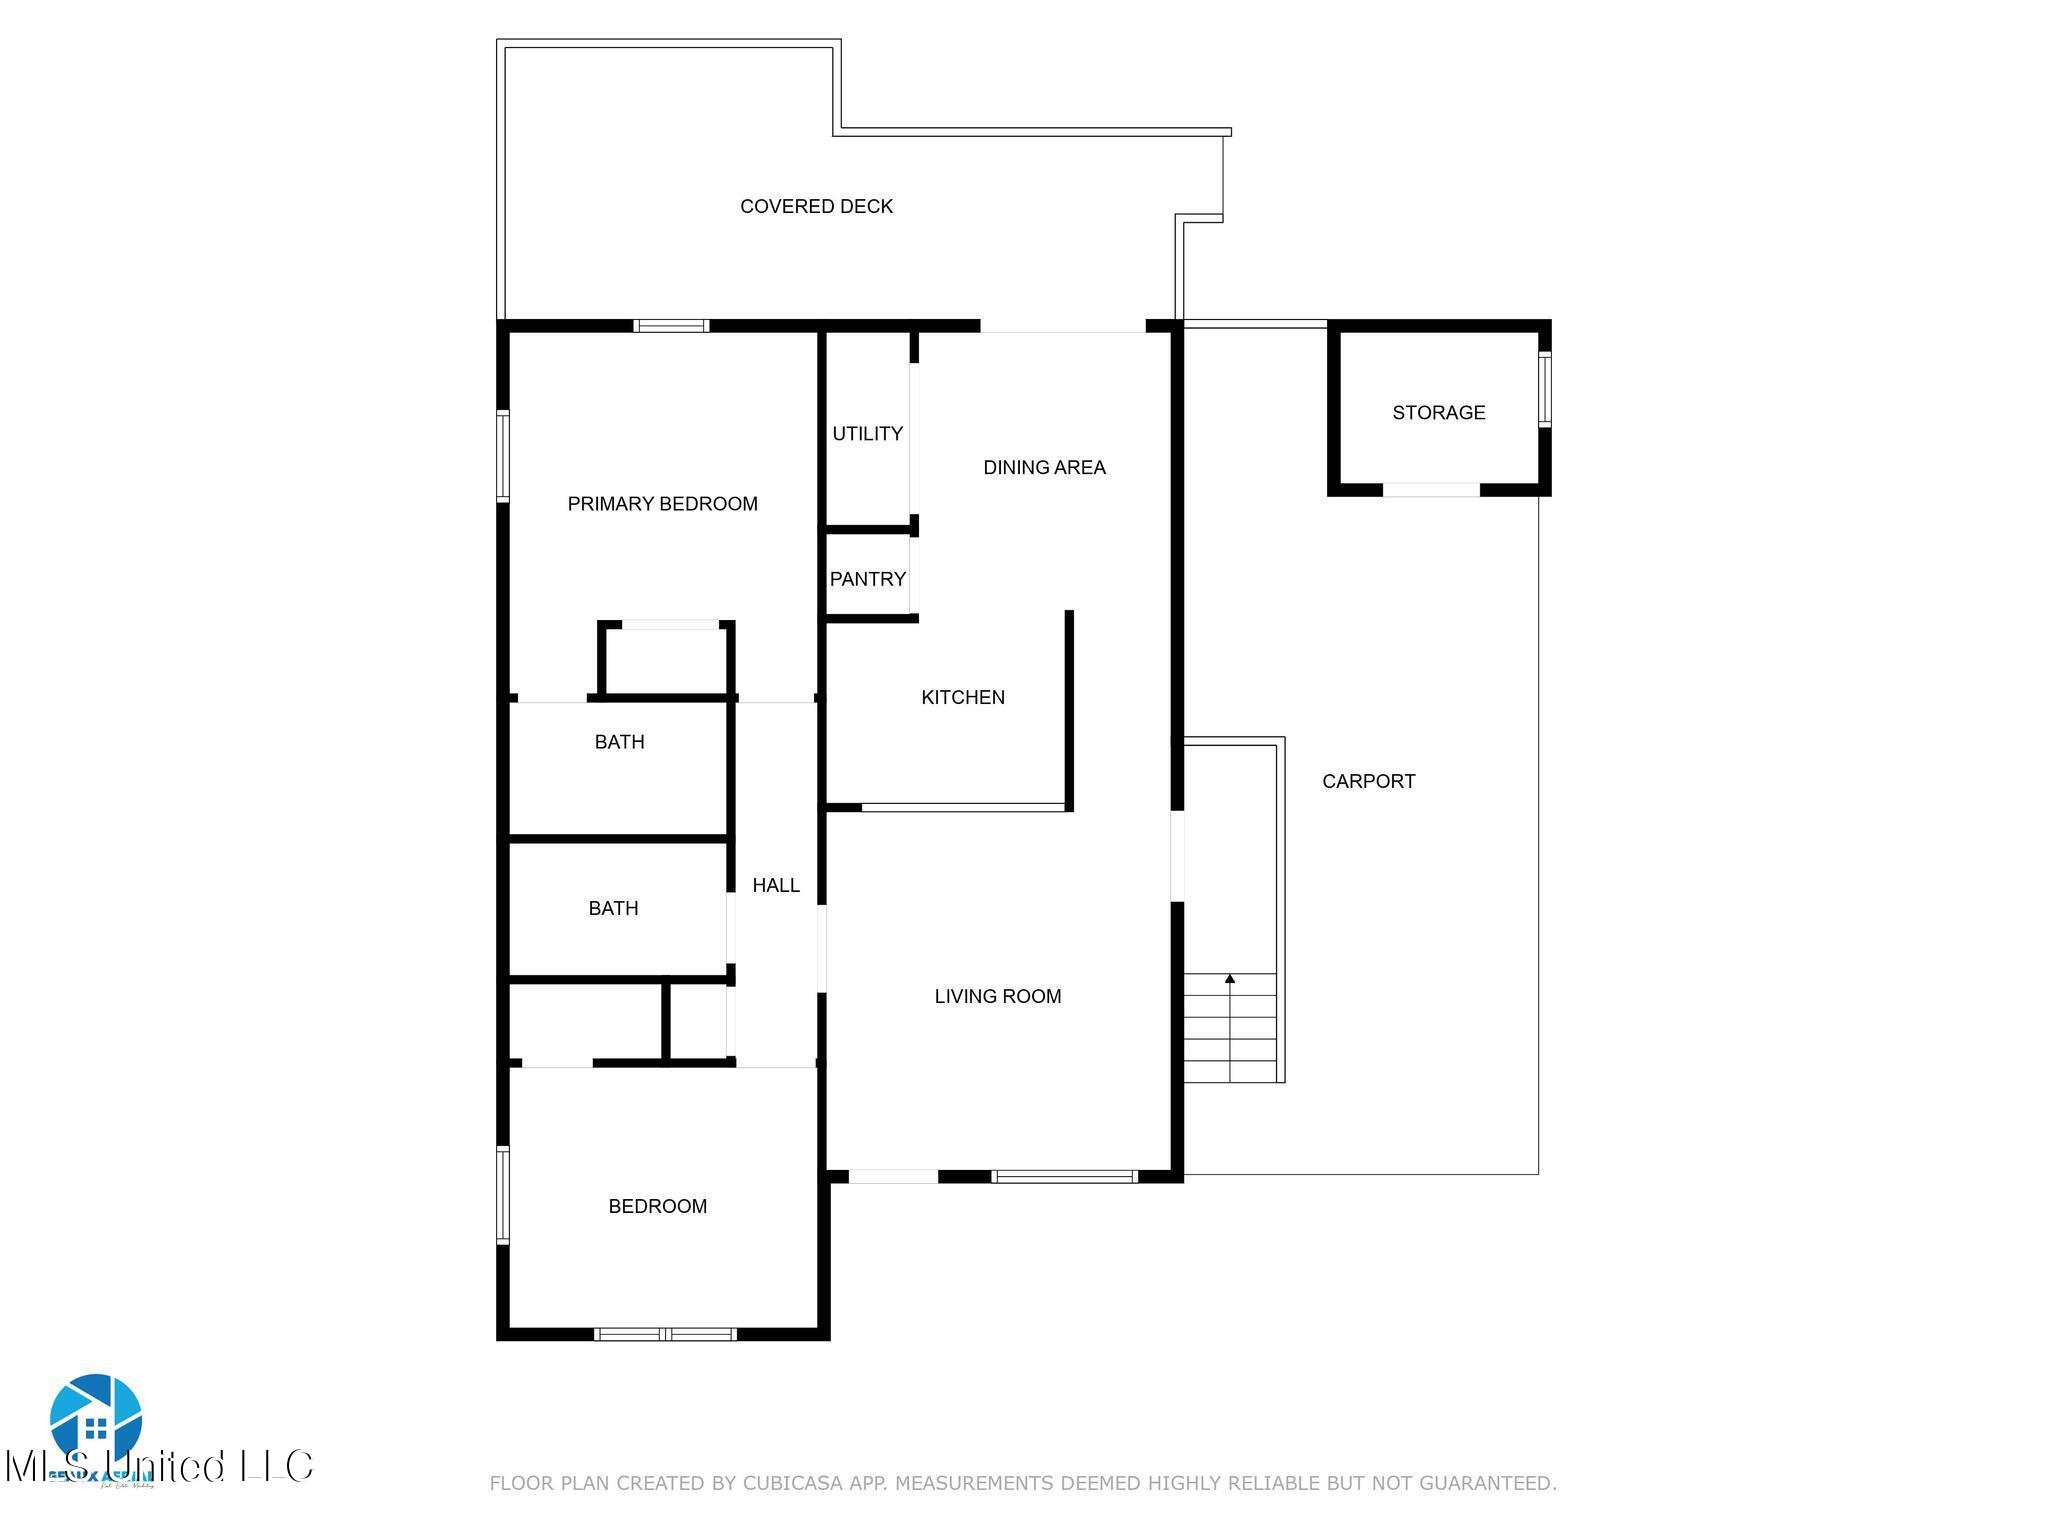
Active
$145,000
2
bds
|
2
ba
|
0
sqft
|
built
1930
281 Dorries St, Biloxi, MS 39530
$163
Cash flow
5.9%
Cash-on-Cash Return
7.6%
Cap rate
1.0%
Rent to Value Ratio

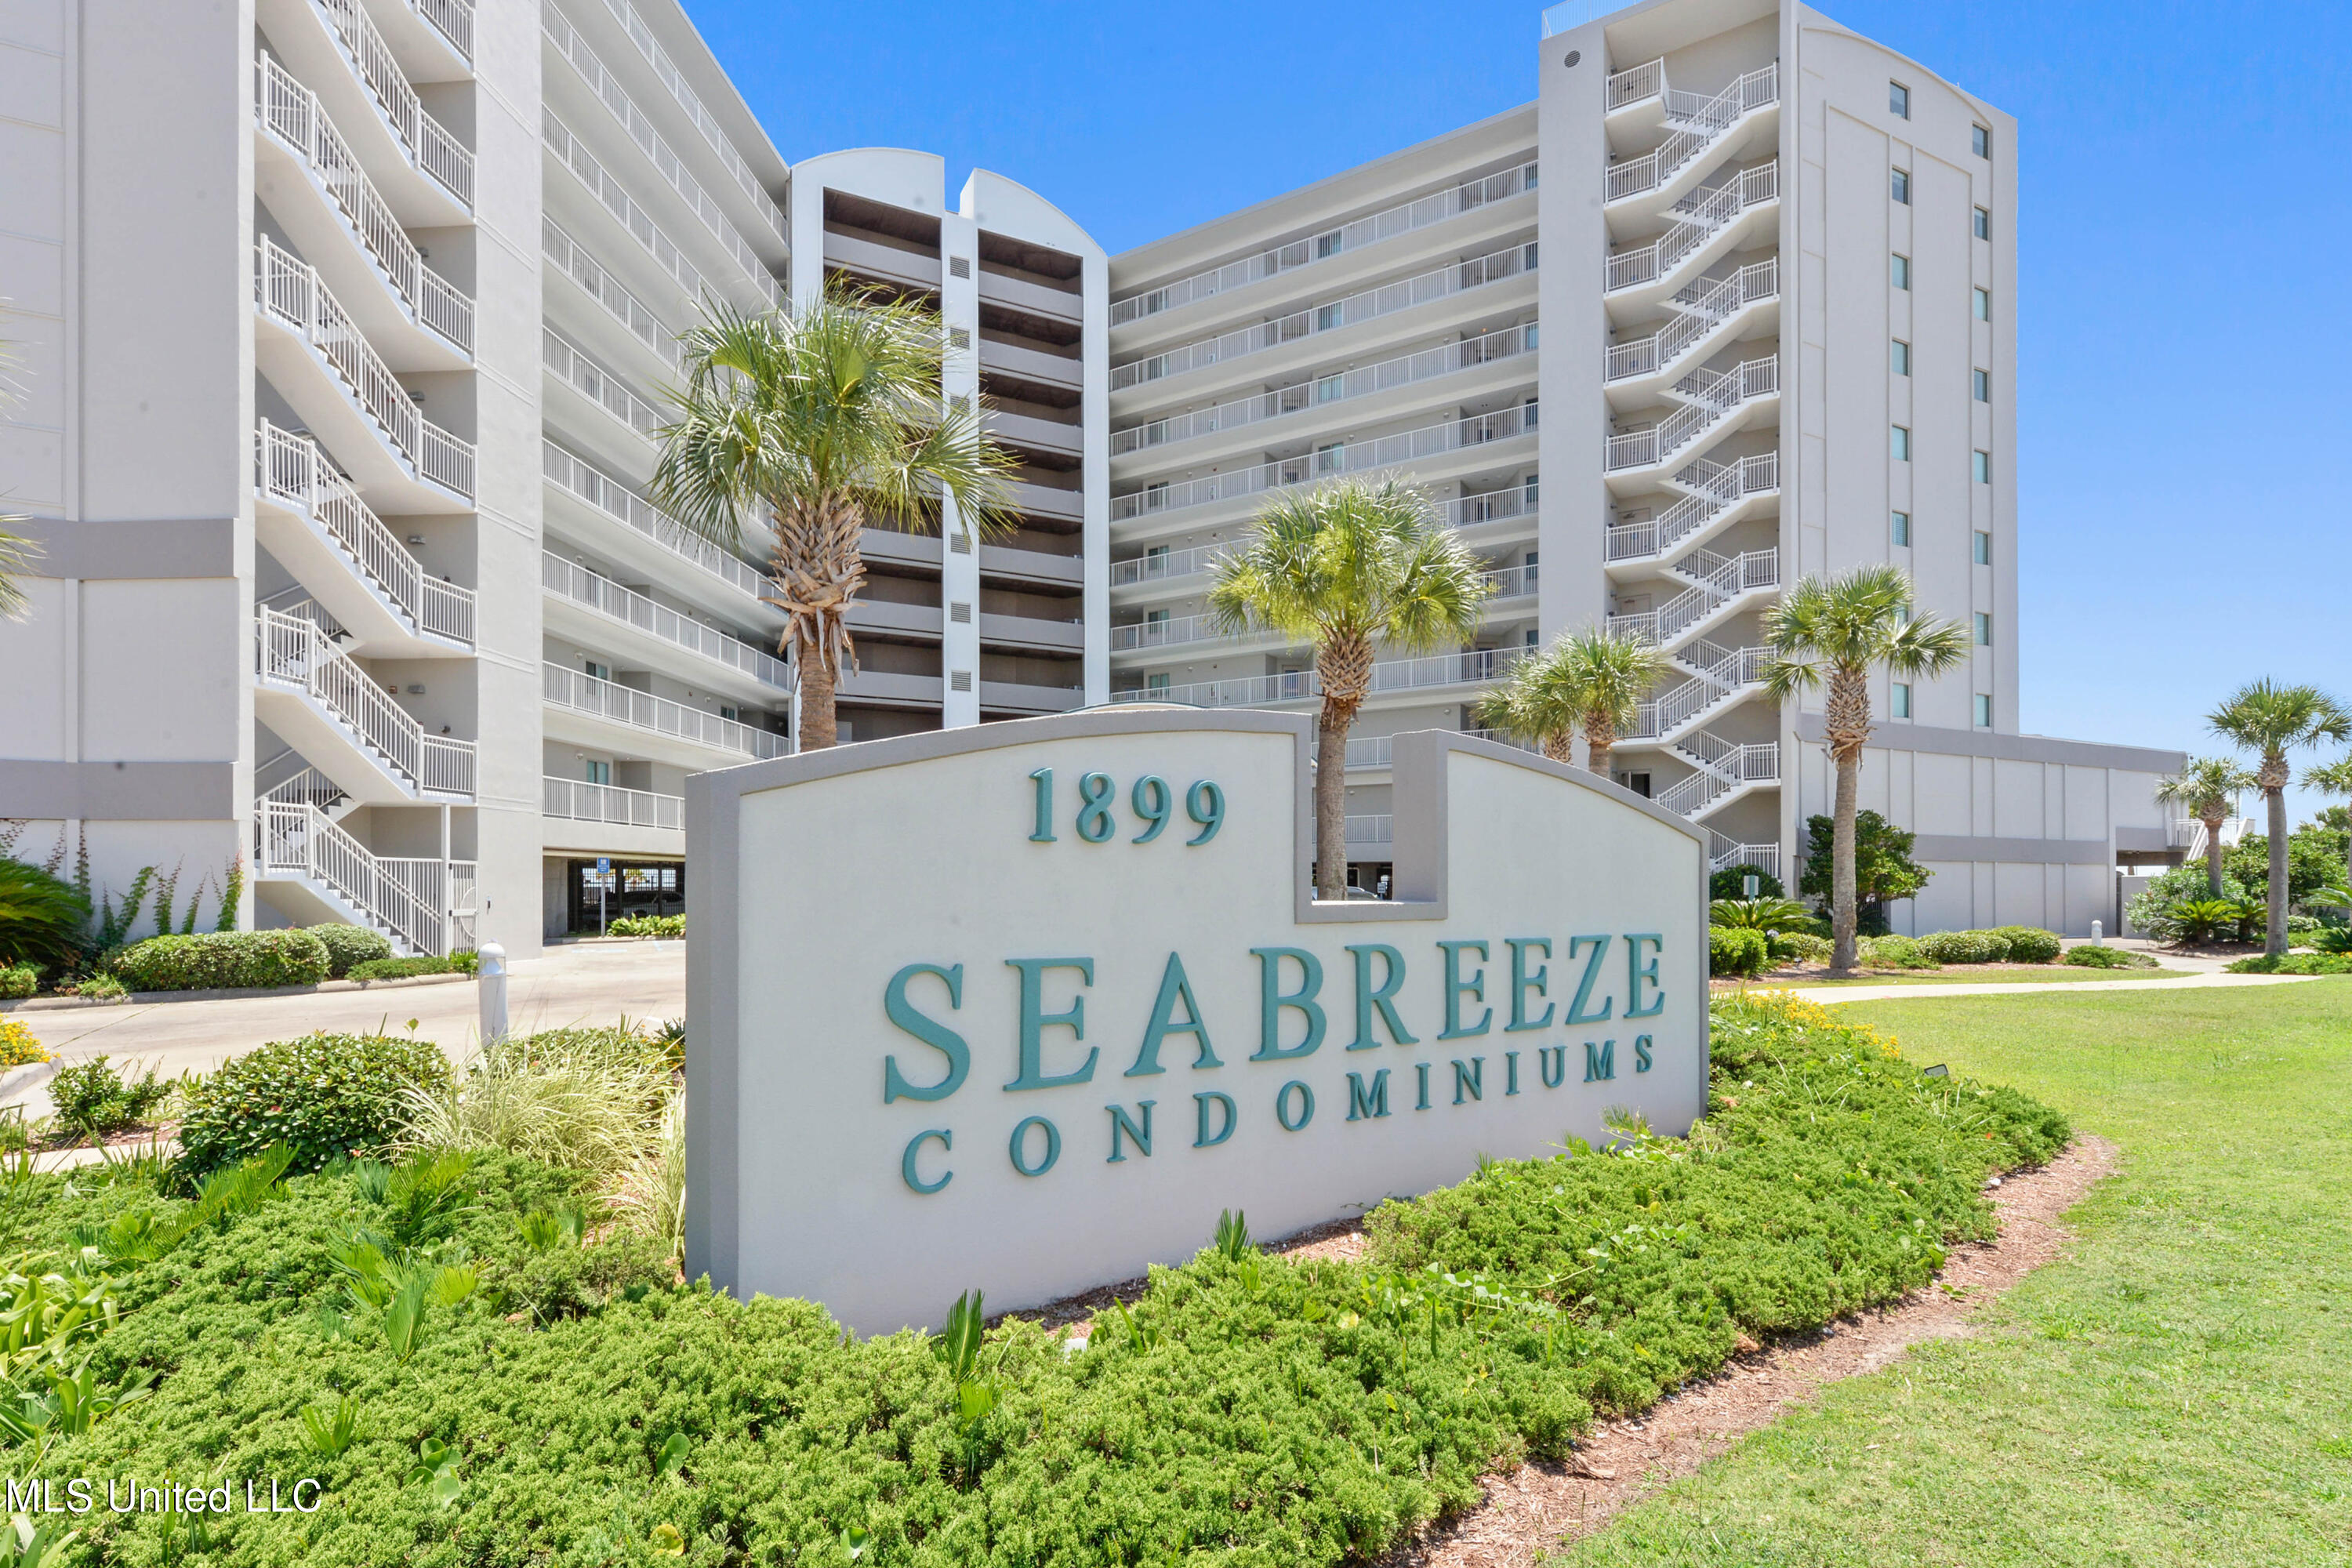
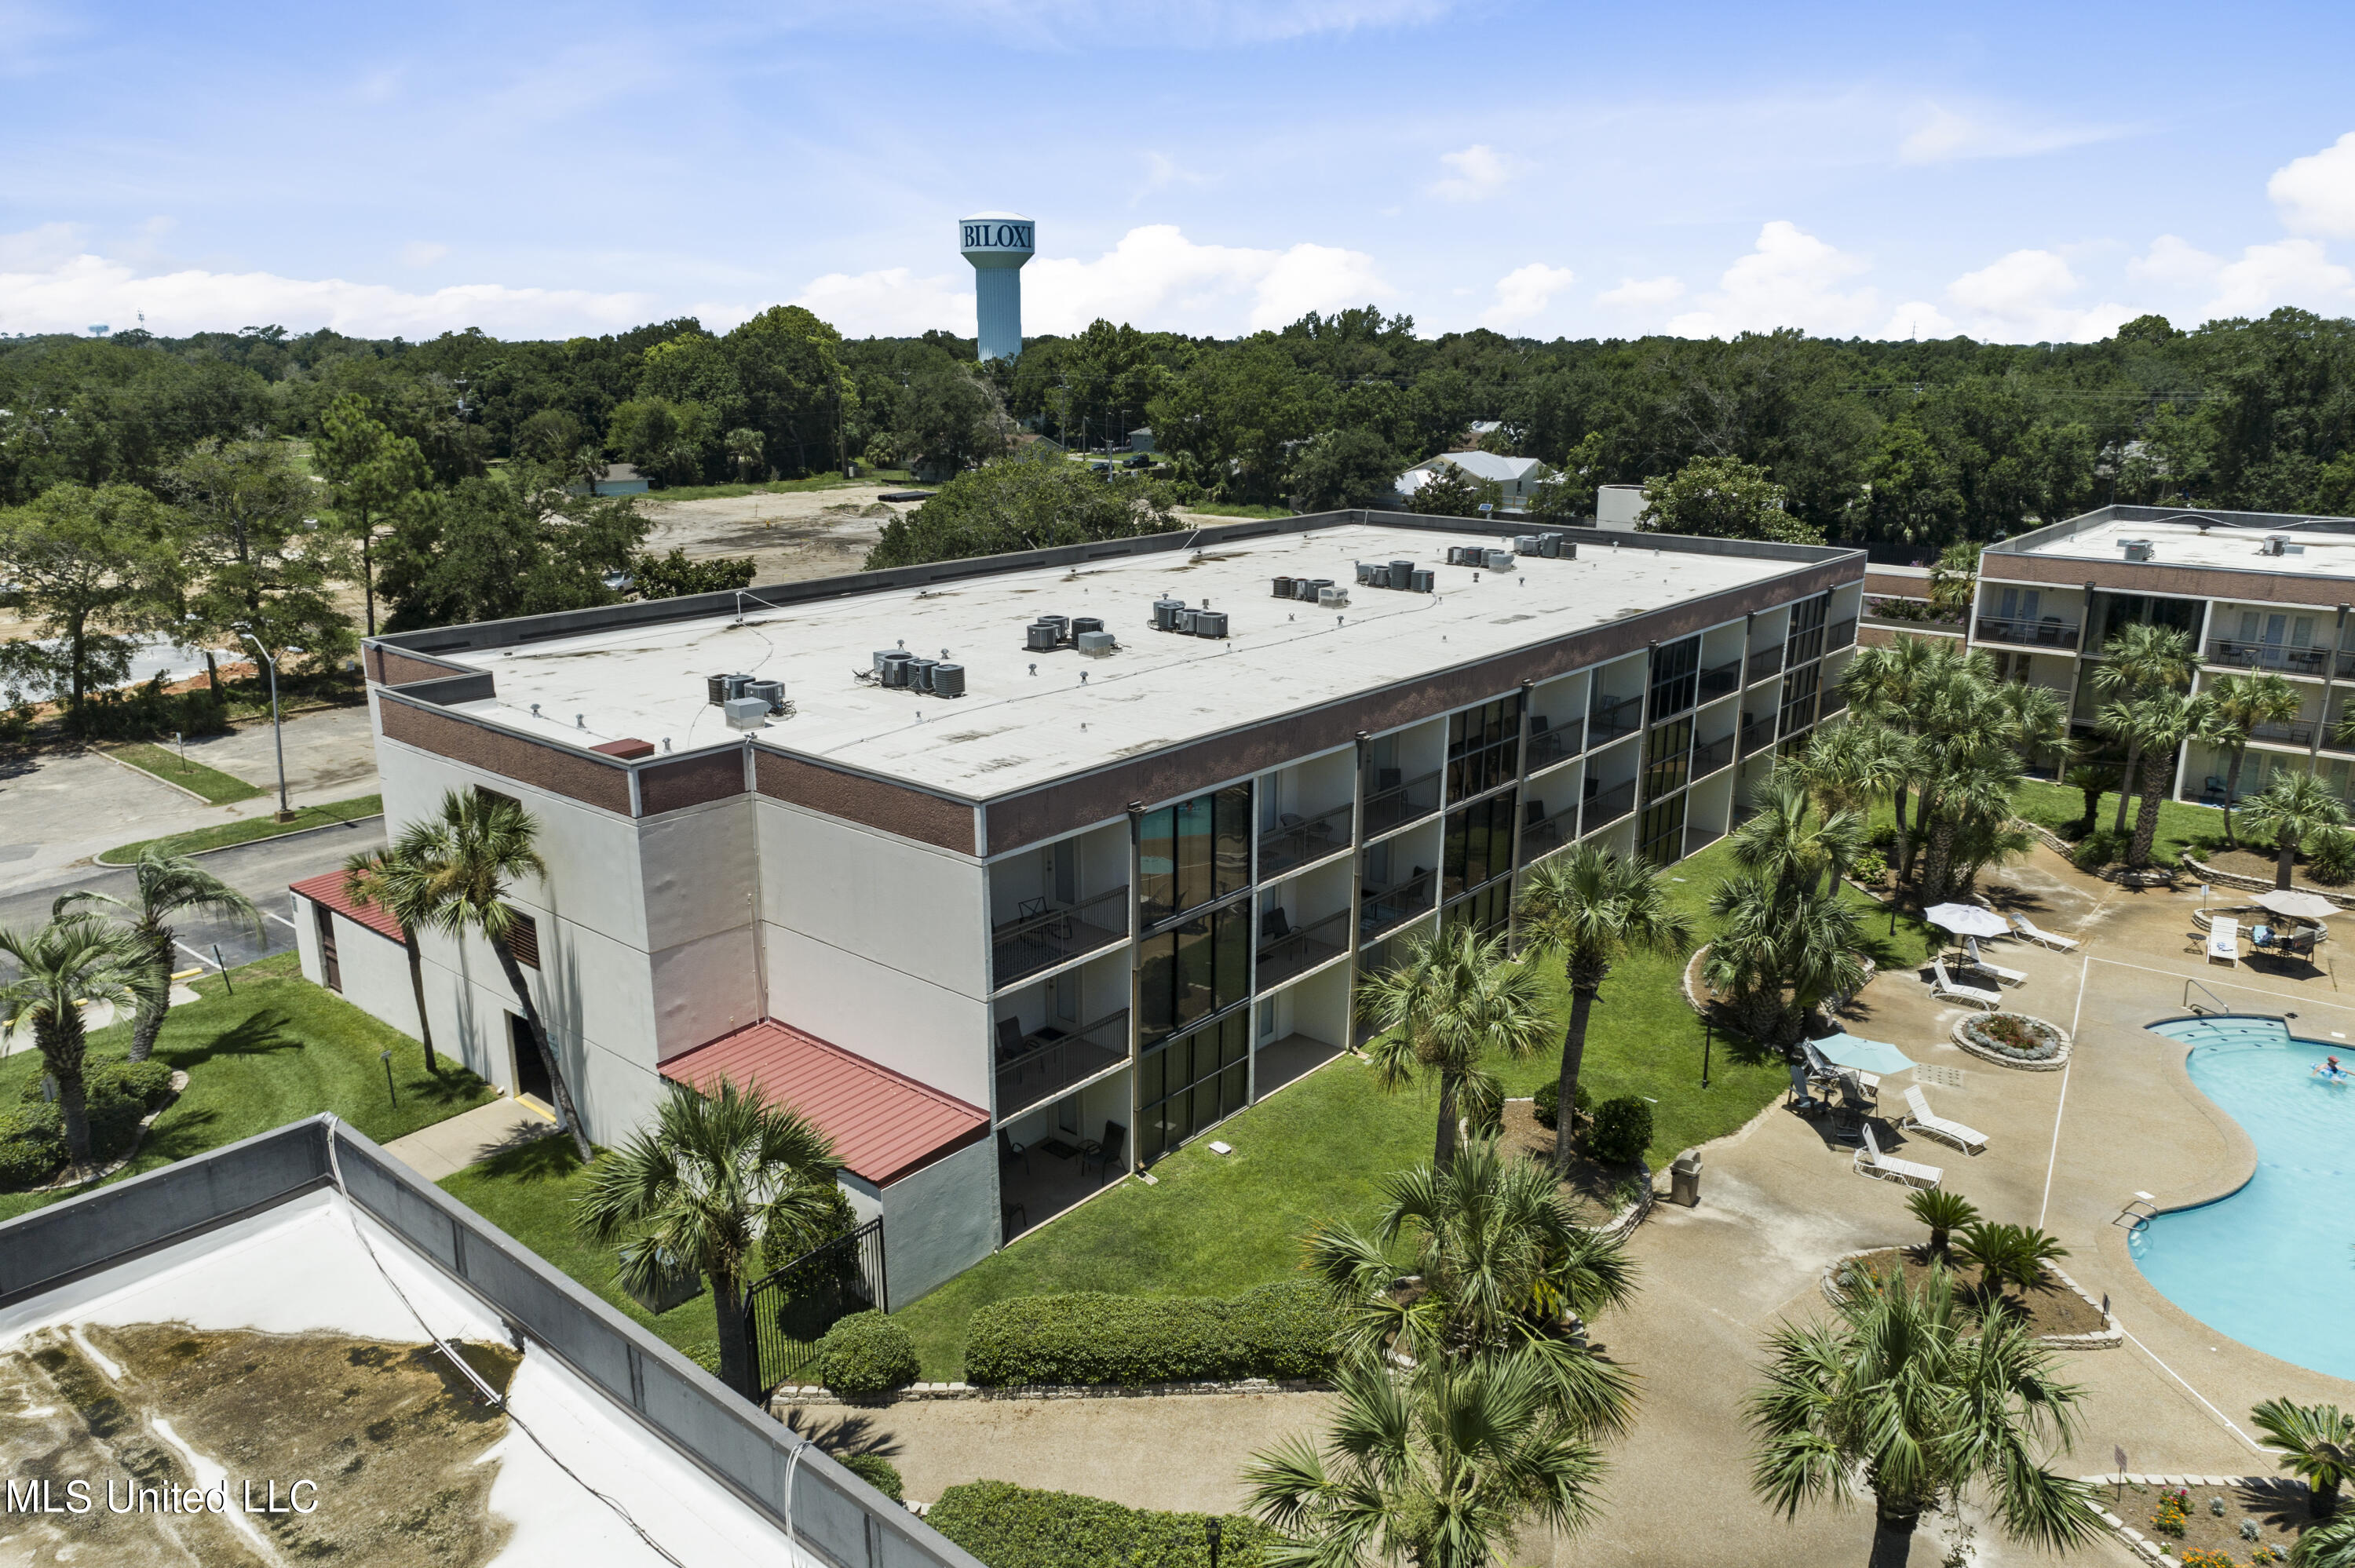
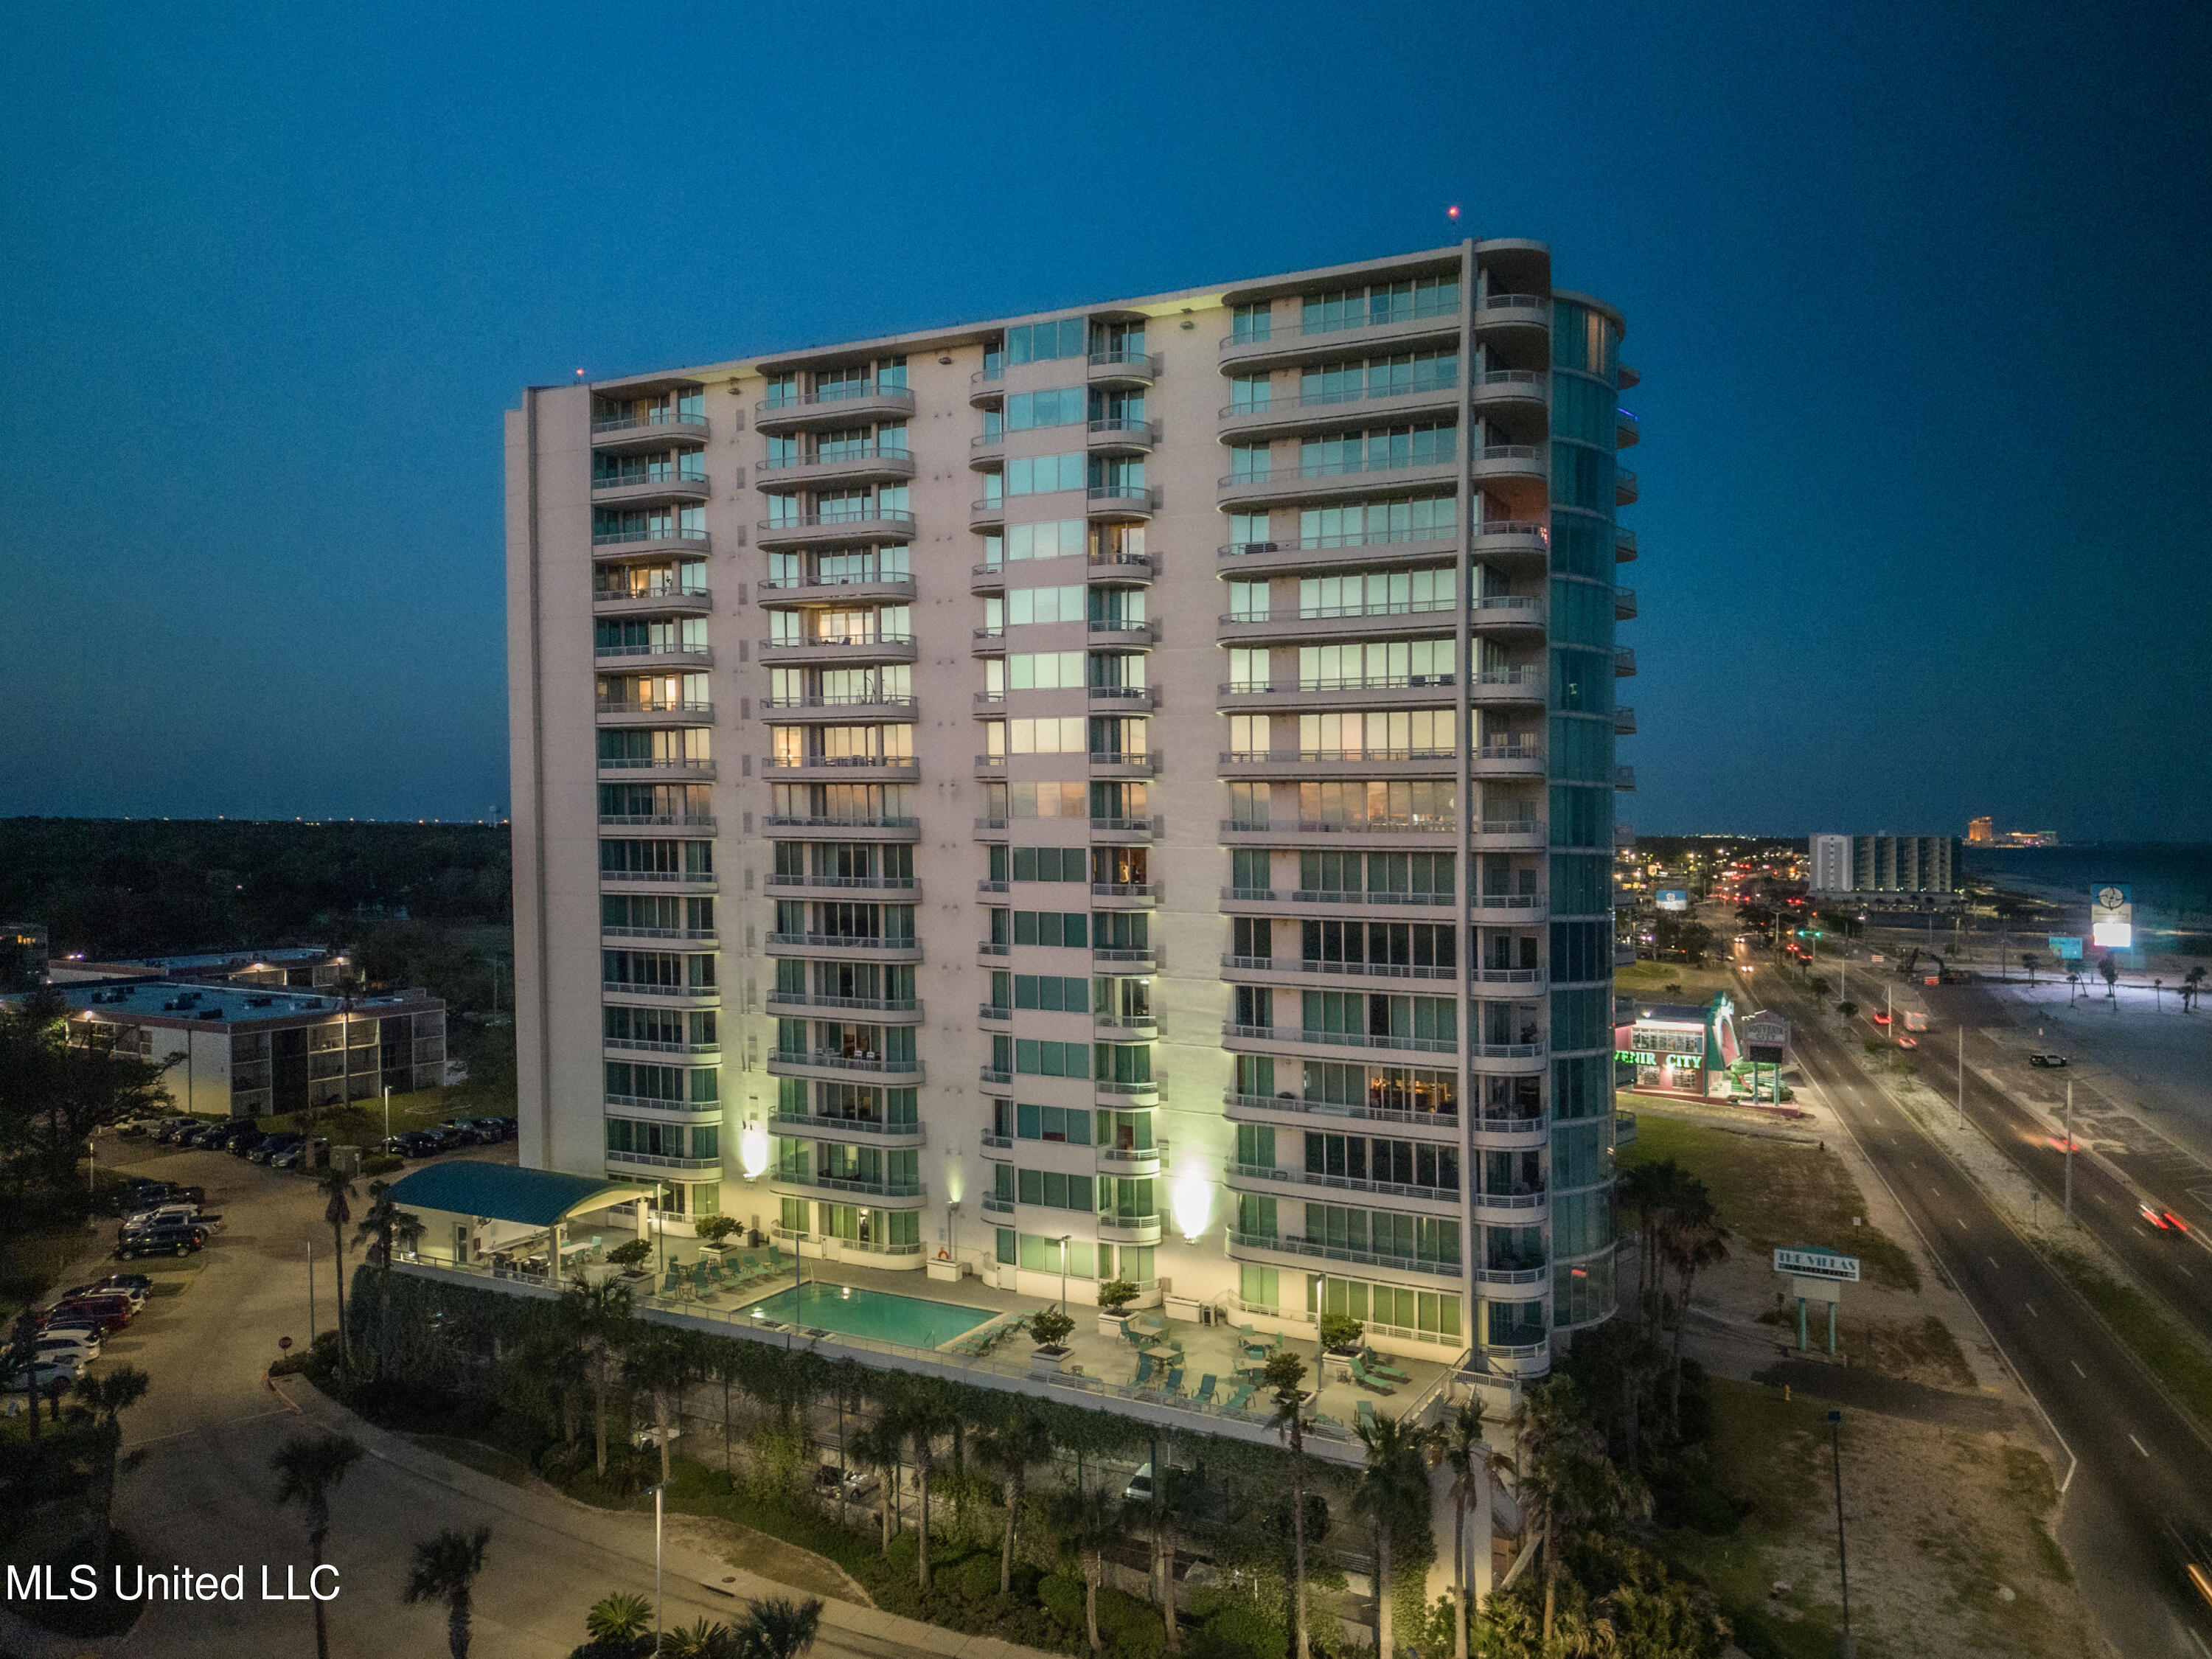
Active
$350,000
2
bds
|
2
ba
|
0
sqft
|
built
2006
1899 Beach Blvd, Biloxi, MS 39531
$-1,458
Cash flow
-21.7%
Cash-on-Cash Return
1.3%
Cap rate
0.6%
Rent to Value Ratio
Active
$424,900
5
bds
|
3
ba
|
0
sqft
|
built
1980
441 Linda Dr, Biloxi, MS 39531
$457
Cash flow
5.6%
Cash-on-Cash Return
7.6%
Cap rate
1.1%
Rent to Value Ratio
Active
$685,000
3
bds
|
3
ba
|
0
sqft
|
built
2017
112 Edgewater Dr, Biloxi, MS 39531
$-1,172
Cash flow
-8.9%
Cash-on-Cash Return
4.2%
Cap rate
0.5%
Rent to Value Ratio
Active
$519,000
3
bds
|
3
ba
|
0
sqft
|
built
2006
1899 Beach Blvd, Biloxi, MS 39531
$-785
Cash flow
-7.9%
Cash-on-Cash Return
4.5%
Cap rate
0.7%
Rent to Value Ratio

Active
$209,900
2
bds
|
2
ba
|
0
sqft
|
built
1965
1282 Beach Blvd, Biloxi, MS 39530
$-334
Cash flow
-8.3%
Cash-on-Cash Return
4.4%
Cap rate
1.0%
Rent to Value Ratio
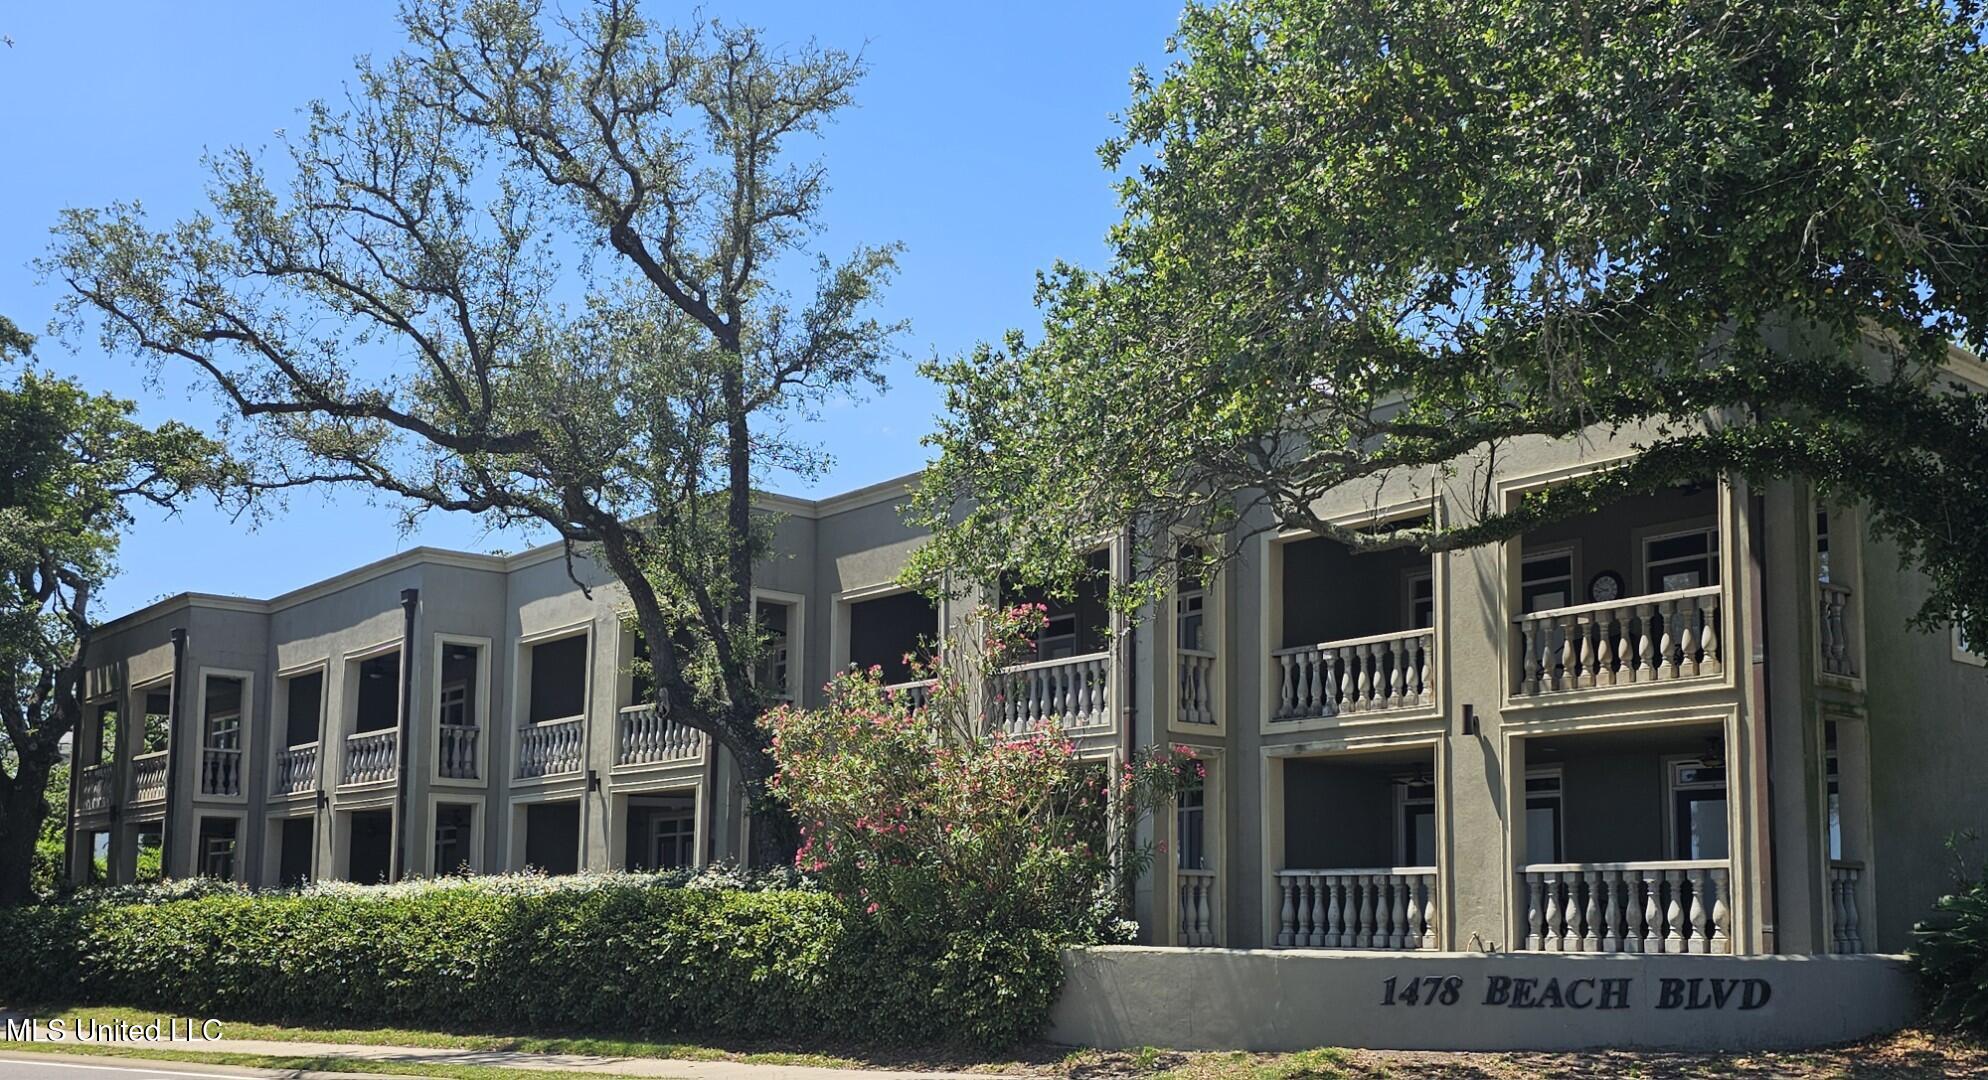
Active
$550,000
3
bds
|
3
ba
|
0
sqft
|
built
1999
1478 Beach Blvd, Biloxi, MS 39530
$-1,474
Cash flow
-14.0%
Cash-on-Cash Return
3.1%
Cap rate
0.6%
Rent to Value Ratio
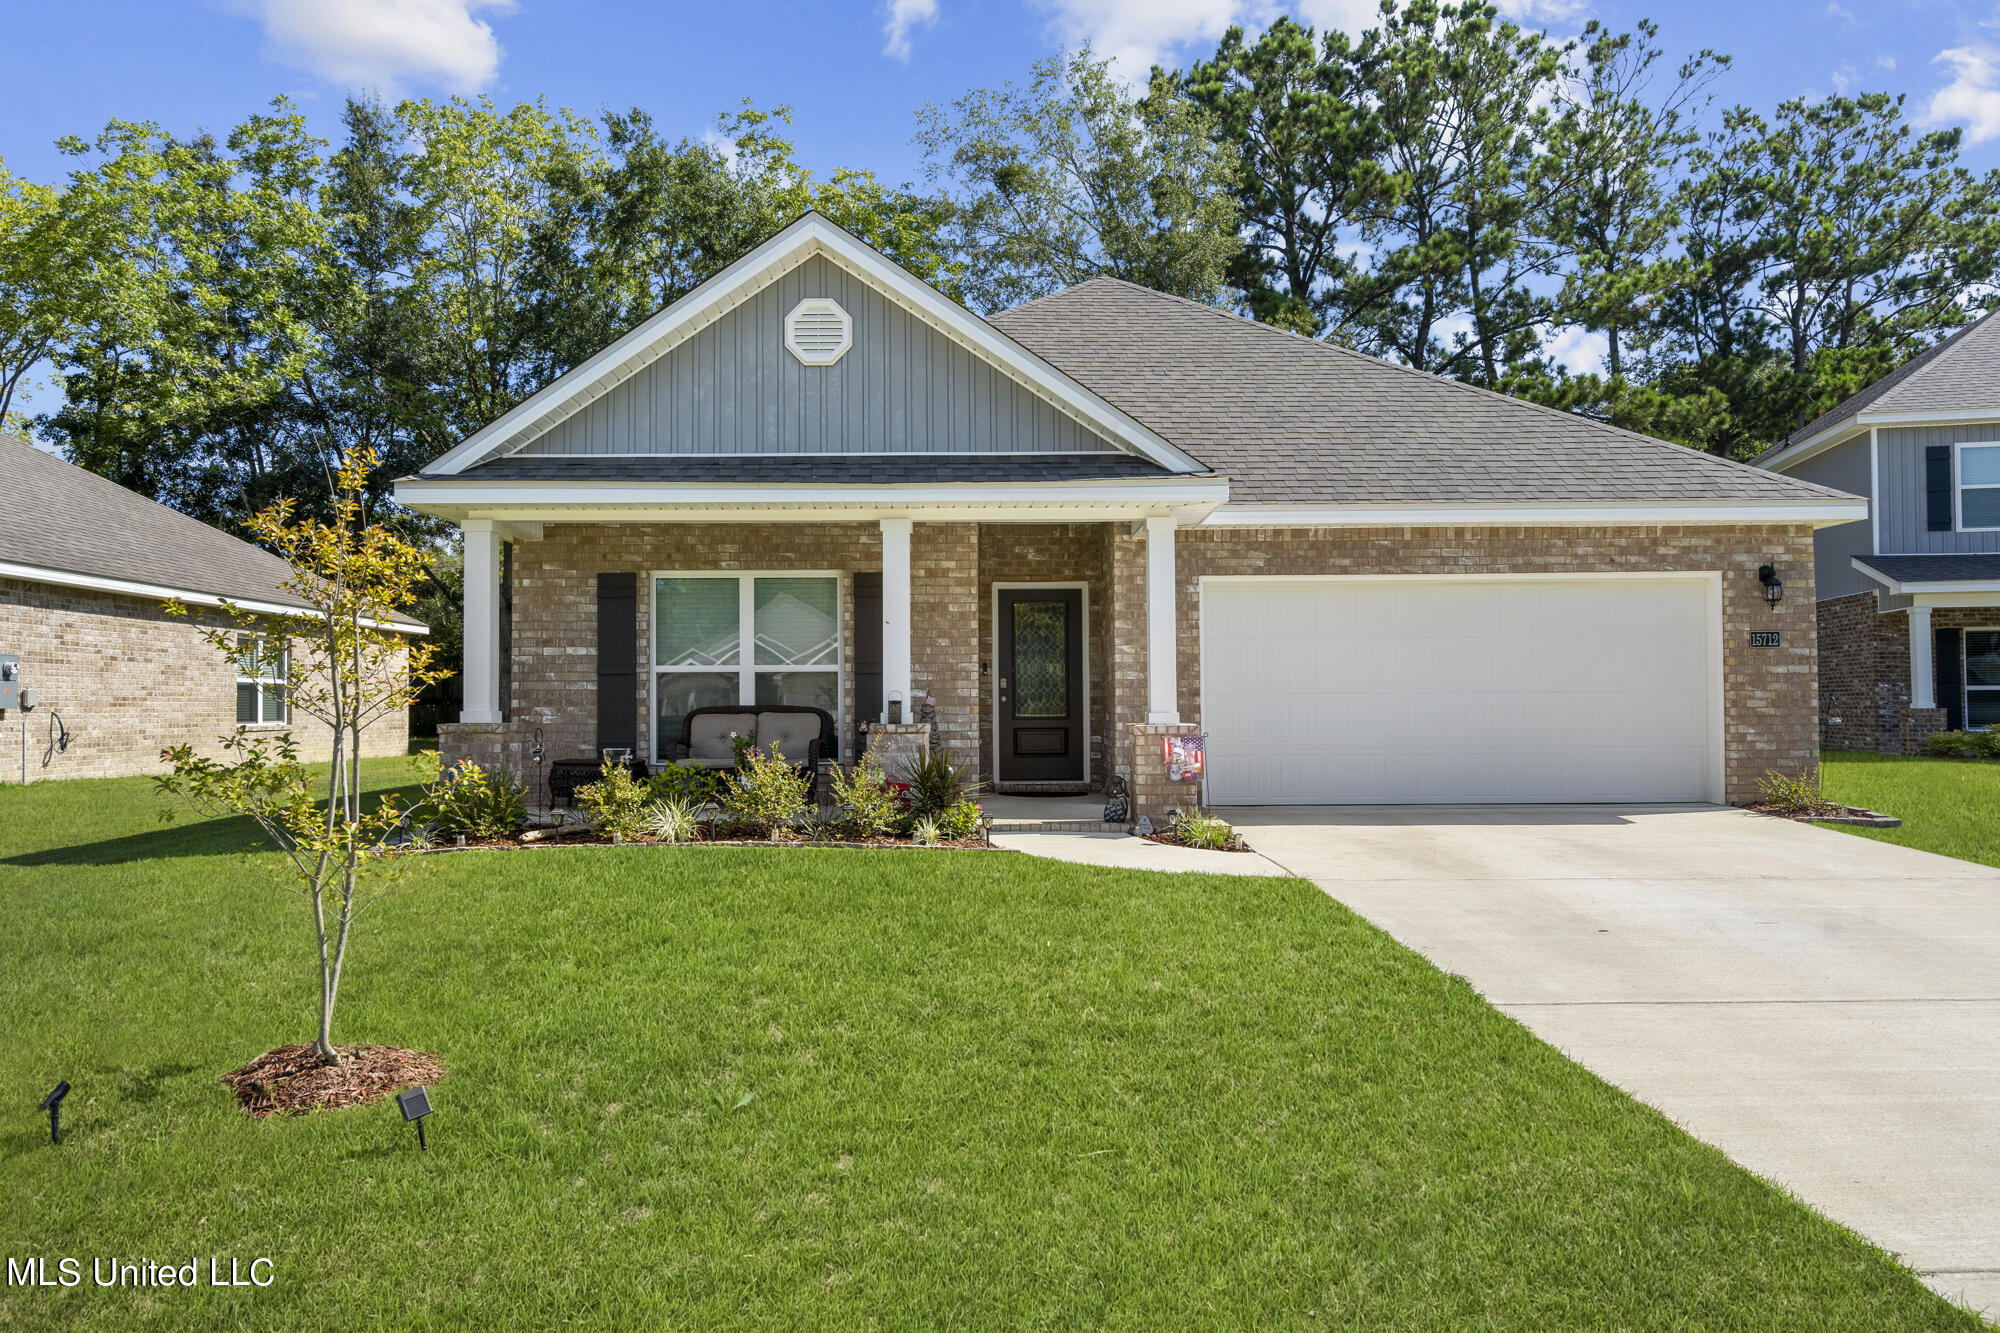
Active
$315,000
4
bds
|
2
ba
|
0
sqft
|
built
2023
15712 Poydras Cir, Biloxi, MS 39532
$50
Cash flow
0.8%
Cash-on-Cash Return
6.5%
Cap rate
0.8%
Rent to Value Ratio

Active
$360,000
2
bds
|
2
ba
|
0
sqft
|
built
2007
2060 Beach Blvd, Biloxi, MS 39531
$-794
Cash flow
-11.5%
Cash-on-Cash Return
3.6%
Cap rate
0.9%
Rent to Value Ratio
Active
$269,000
3
bds
|
3
ba
|
0
sqft
|
built
1996
2106 Lauren Dr, Biloxi, MS 39532
$-206
Cash flow
-4.0%
Cash-on-Cash Return
5.4%
Cap rate
0.7%
Rent to Value Ratio

Active
$290,000
1
bds
|
1
ba
|
0
sqft
|
built
2007
2060 Beach Blvd, Biloxi, MS 39531
$-334
Cash flow
-6.0%
Cash-on-Cash Return
4.9%
Cap rate
0.8%
Rent to Value Ratio
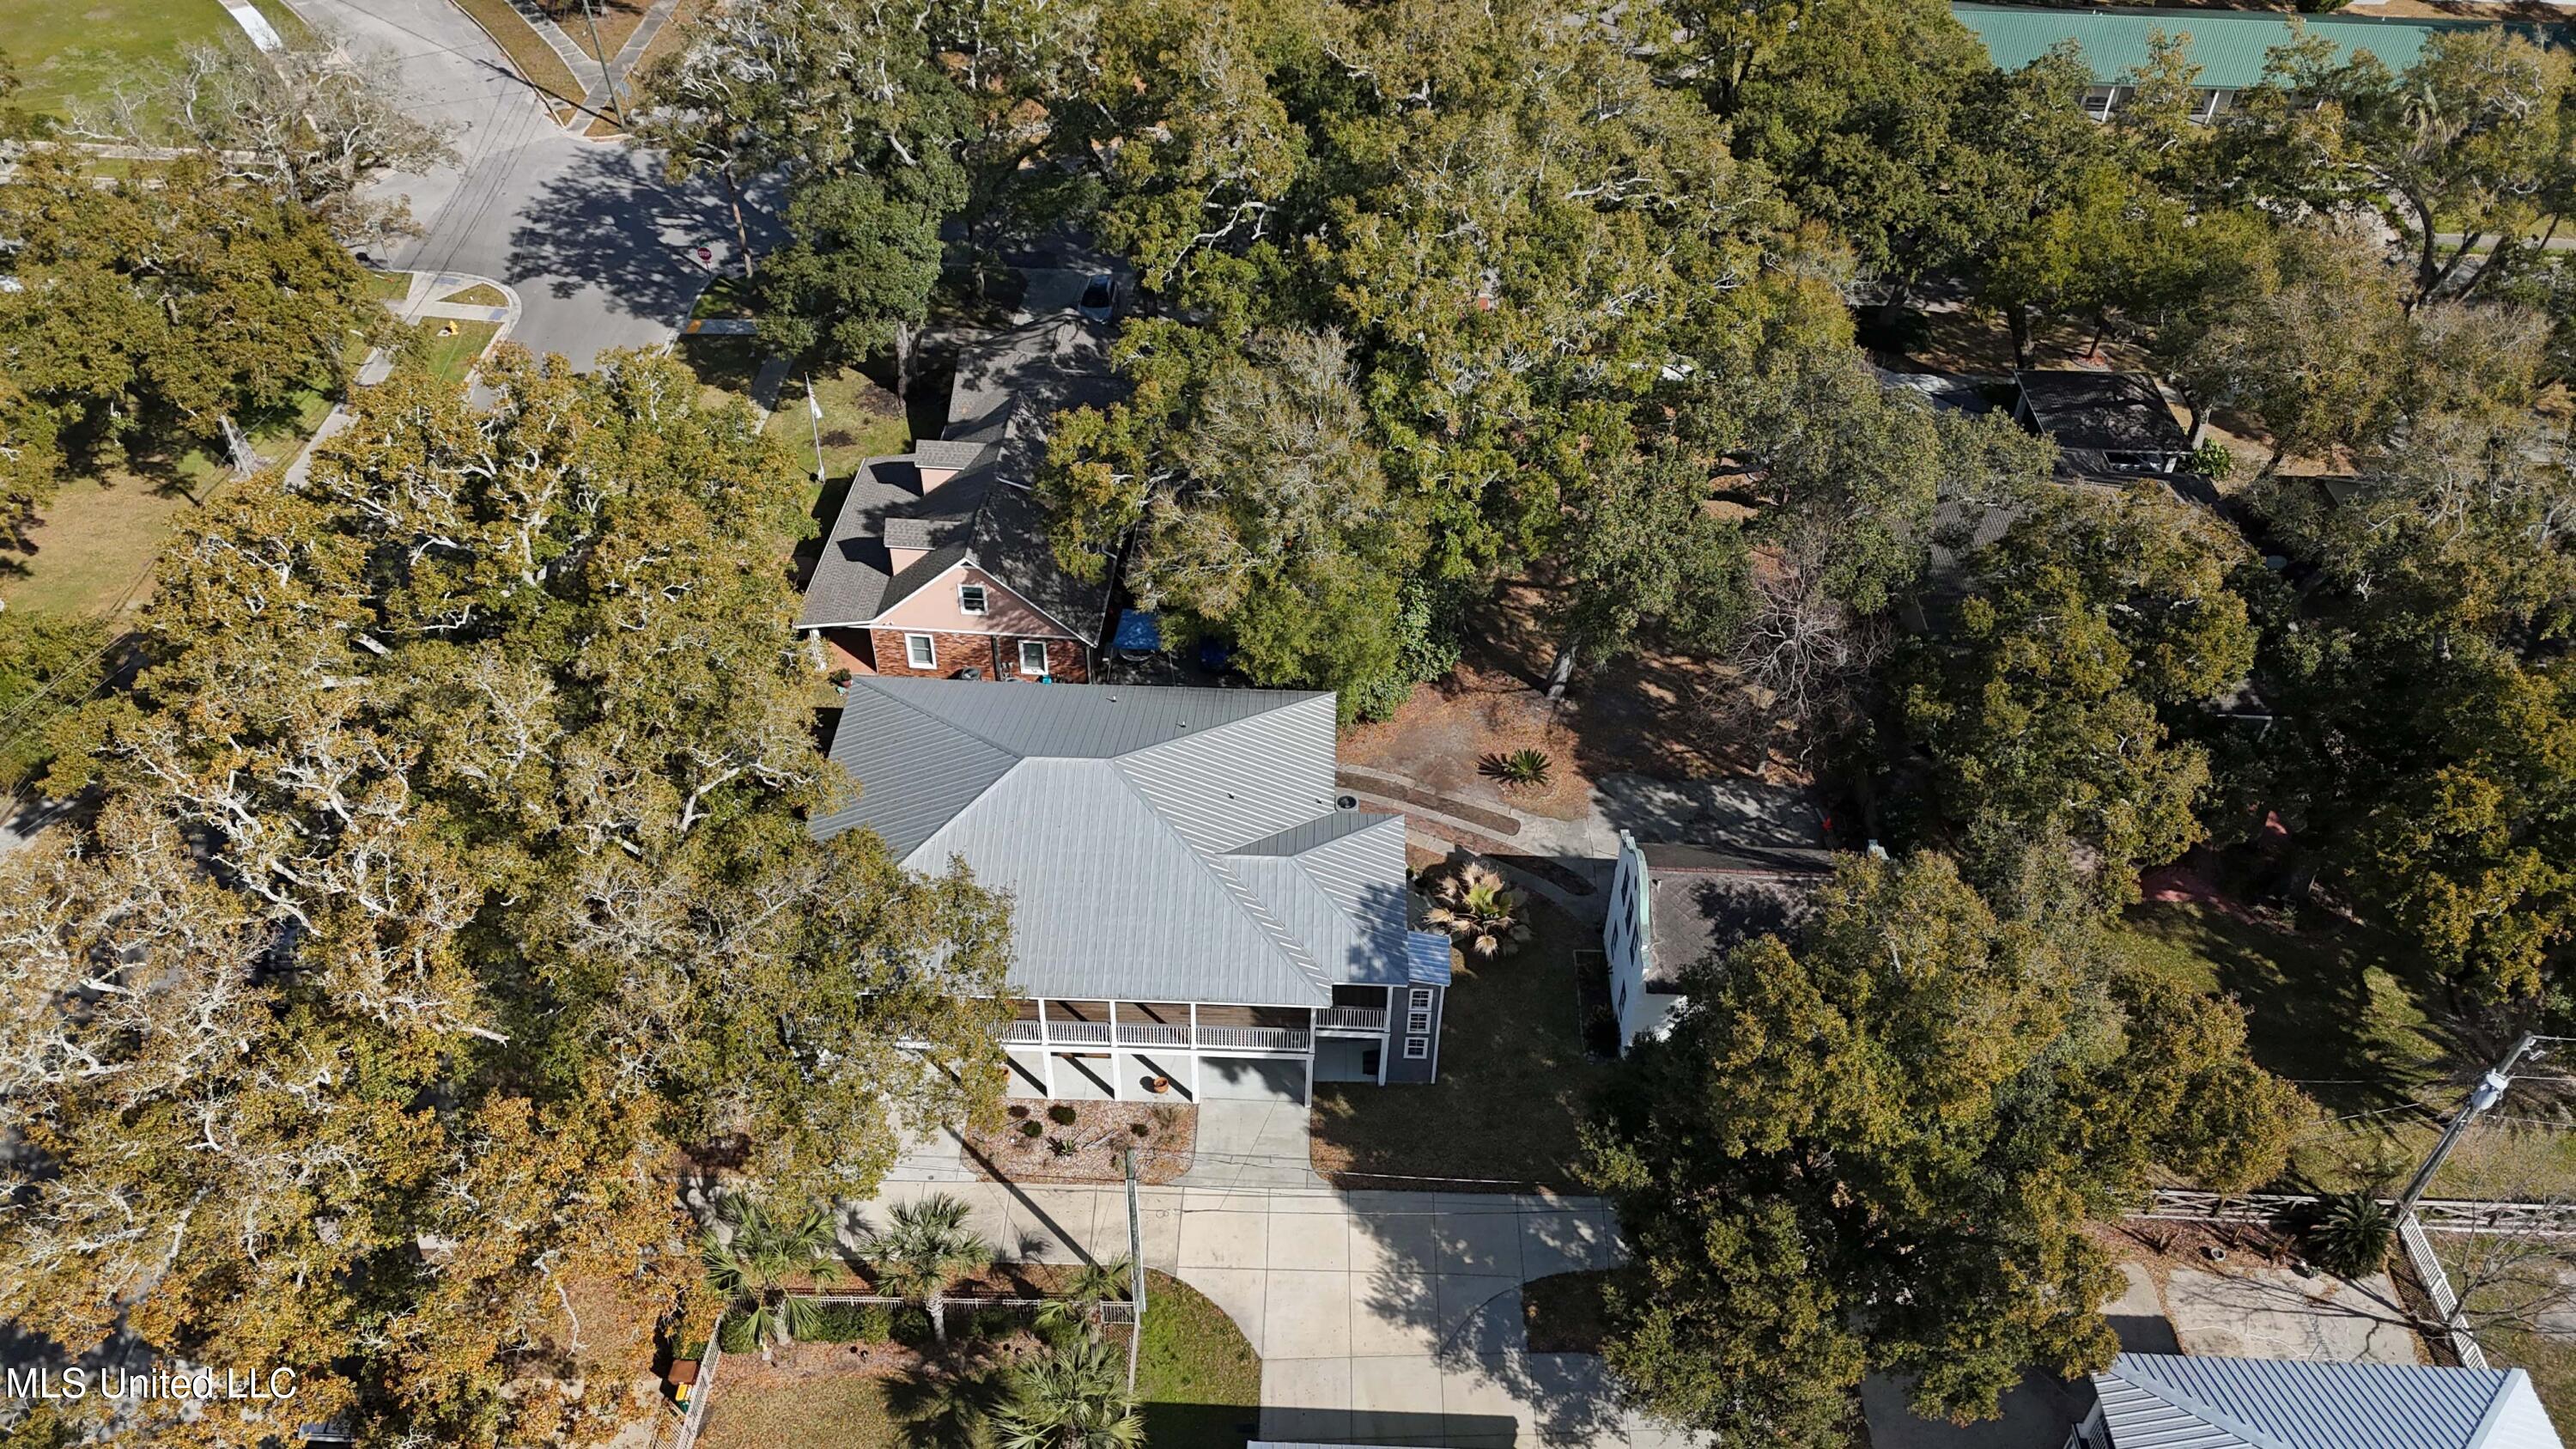
Active
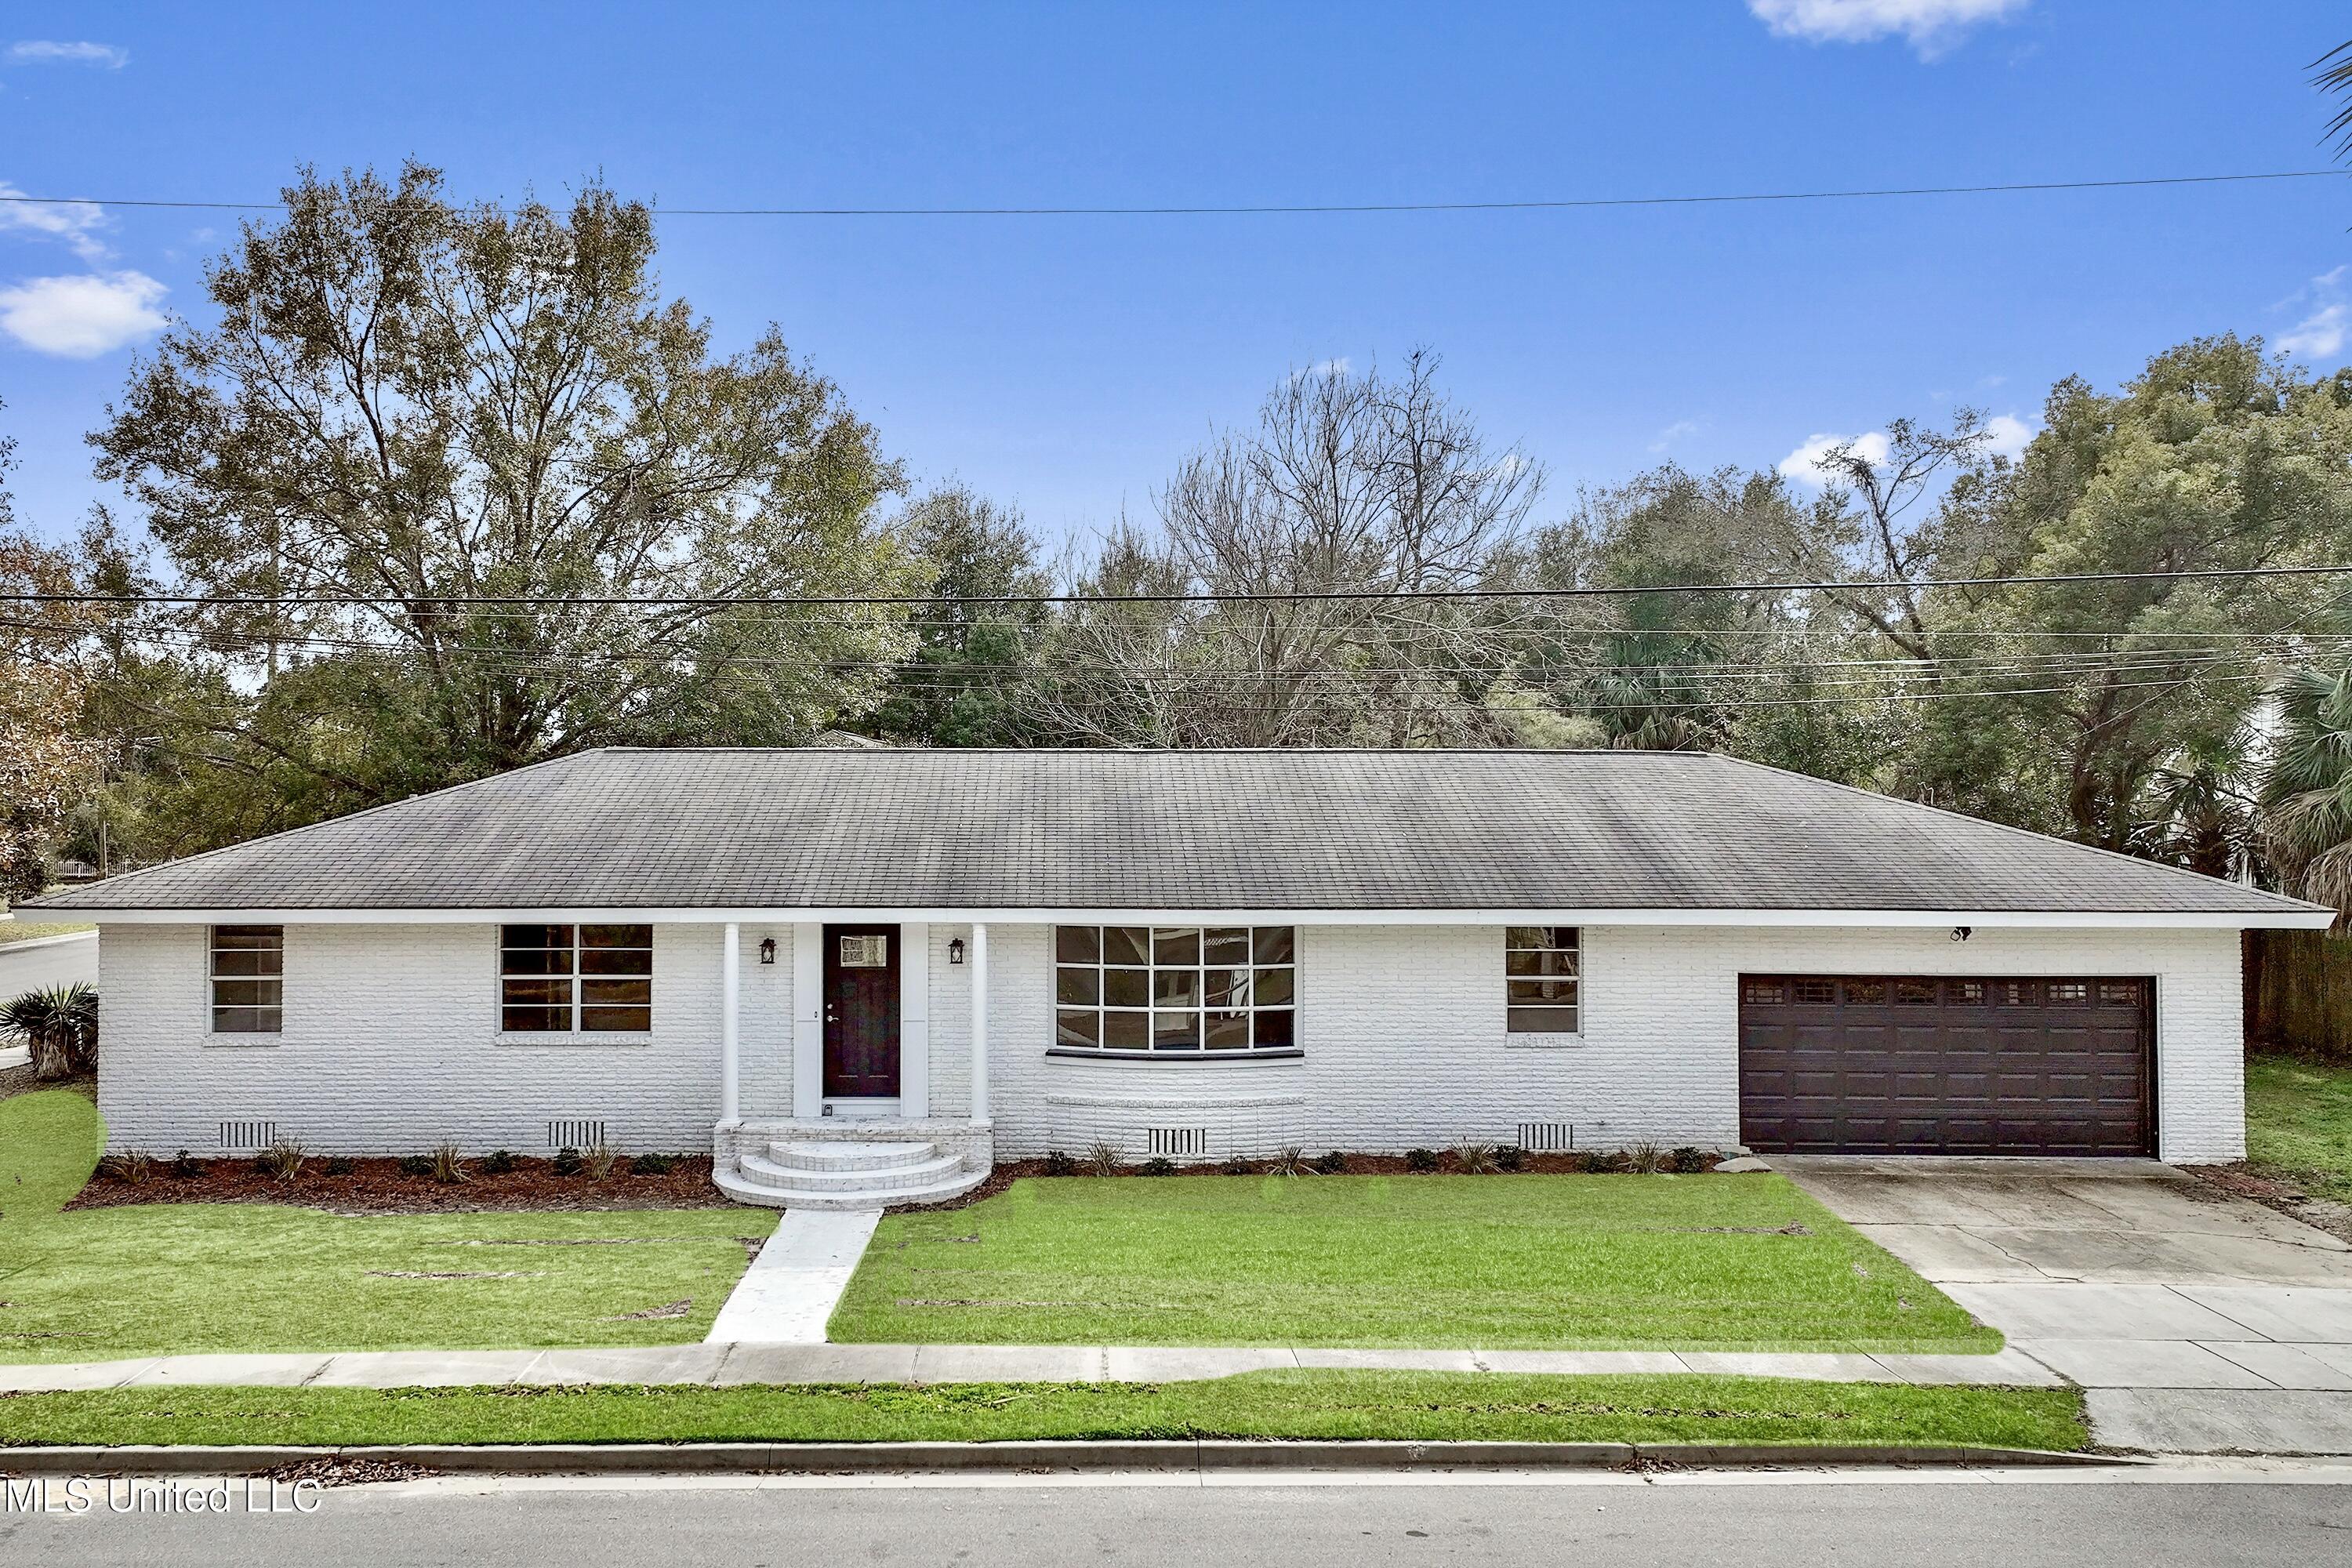
$349,900
3
bds
|
2
ba
|
0
sqft
|
built
1994
408 Saylor Dr, Biloxi, MS 39531
$-148
Cash flow
-2.2%
Cash-on-Cash Return
5.8%
Cap rate
0.7%
Rent to Value Ratio
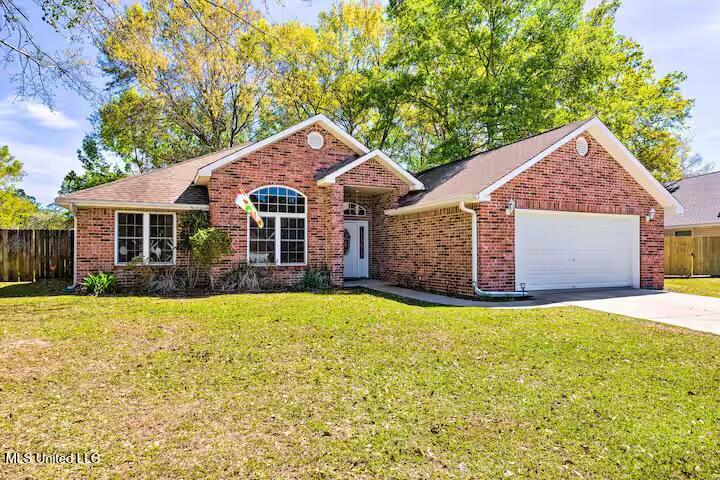
Active
$325,000
4
bds
|
2
ba
|
0
sqft
|
built
2001
6901 Rue Mornay N, Biloxi, MS 39532
$-132
Cash flow
-2.1%
Cash-on-Cash Return
5.8%
Cap rate
0.8%
Rent to Value Ratio

Active
$365,500
5
bds
|
3
ba
|
0
sqft
|
built
2019
9135 Rock Creek Dr, Biloxi, MS 39532
$-285
Cash flow
-4.1%
Cash-on-Cash Return
5.3%
Cap rate
0.7%
Rent to Value Ratio

Active
$399,900
5
bds
|
3
ba
|
0
sqft
|
built
2020
7081 Glen Eagle Dr, Biloxi, MS 39532
$-347
Cash flow
-4.5%
Cash-on-Cash Return
5.2%
Cap rate
0.7%
Rent to Value Ratio
Active
$279,000
4
bds
|
2
ba
|
0
sqft
|
built
2007
15020 Thelma St, Biloxi, MS 39532
$88
Cash flow
1.6%
Cash-on-Cash Return
6.7%
Cap rate
0.9%
Rent to Value Ratio
Active
$445,000
4
bds
|
3
ba
|
0
sqft
|
built
1980
13781 John Lee Rd, Biloxi, MS 39532
$-546
Cash flow
-6.4%
Cash-on-Cash Return
4.8%
Cap rate
0.6%
Rent to Value Ratio
Active
$356,500
4
bds
|
3
ba
|
0
sqft
|
built
1960
140 Azalea Dr, Biloxi, MS 39530
$-62
Cash flow
-0.9%
Cash-on-Cash Return
6.1%
Cap rate
0.8%
Rent to Value Ratio
Active
$259,000
2
bds
|
1
ba
|
0
sqft
|
built
1965
9201 Woolmarket Rd, Biloxi, MS 39532
$250
Cash flow
5.0%
Cash-on-Cash Return
7.4%
Cap rate
1.0%
Rent to Value Ratio

Active
$524,900
3
bds
|
3
ba
|
0
sqft
|
built
2006
1899 Beach Blvd, Biloxi, MS 39531
$-1,781
Cash flow
-17.7%
Cash-on-Cash Return
2.2%
Cap rate
0.7%
Rent to Value Ratio

Active
$135,600
3
bds
|
1
ba
|
0
sqft
|
built
1948
205 Hopkins Blvd, Biloxi, MS 39530
$173
Cash flow
6.7%
Cash-on-Cash Return
7.8%
Cap rate
1.0%
Rent to Value Ratio
Active
$284,000
2
bds
|
1
ba
|
0
sqft
|
built
1924
970 Division St, Biloxi, MS 39530
$147
Cash flow
2.7%
Cash-on-Cash Return
6.9%
Cap rate
0.8%
Rent to Value Ratio

Active
$179,900
3
bds
|
3
ba
|
0
sqft
|
built
1949
1059 Lafayette St, Biloxi, MS 39530
$188
Cash flow
5.5%
Cash-on-Cash Return
7.5%
Cap rate
1.0%
Rent to Value Ratio
Active
$749,999
5
bds
|
5
ba
|
0
sqft
|
built
2002
2509 S Shore Dr, Biloxi, MS 39532
$-1,680
Cash flow
-11.7%
Cash-on-Cash Return
3.6%
Cap rate
0.5%
Rent to Value Ratio

Active
$379,900
3
bds
|
3
ba
|
0
sqft
|
built
1944
118 Saint Peter St, Biloxi, MS 39530
$-119
Cash flow
-1.6%
Cash-on-Cash Return
5.9%
Cap rate
0.7%
Rent to Value Ratio
Active
$1,075,000
4
bds
|
4
ba
|
0
sqft
|
built
2014
15105 Hummingbird Ln, Biloxi, MS 39532
$-3,565
Cash flow
-17.3%
Cash-on-Cash Return
2.3%
Cap rate
0.4%
Rent to Value Ratio
Active
$229,900
2
bds
|
2
ba
|
0
sqft
|
built
1982
2046 Beach Blvd, Biloxi, MS 39531
$-550
Cash flow
-12.5%
Cash-on-Cash Return
3.4%
Cap rate
0.9%
Rent to Value Ratio
Active
$449,900
2
bds
|
2
ba
|
0
sqft
|
built
2007
2060 Beach Blvd, Biloxi, MS 39531
$-1,313
Cash flow
-15.2%
Cash-on-Cash Return
2.8%
Cap rate
0.7%
Rent to Value Ratio
Active
$299,900
3
bds
|
2
ba
|
0
sqft
|
built
1960
1079 Frank P Corso St, Biloxi, MS 39530
$231
Cash flow
4.0%
Cash-on-Cash Return
7.2%
Cap rate
0.9%
Rent to Value Ratio
Active
$264,900
2
bds
|
2
ba
|
0
sqft
|
built
1982
2046 Beach Blvd, Biloxi, MS 39531
$-493
Cash flow
-9.7%
Cash-on-Cash Return
4.0%
Cap rate
0.8%
Rent to Value Ratio
Active
$365,000
3
bds
|
2
ba
|
0
sqft
|
built
1998
6904 Southwind Dr, Biloxi, MS 39532
$-82
Cash flow
-1.2%
Cash-on-Cash Return
6.0%
Cap rate
0.8%
Rent to Value Ratio
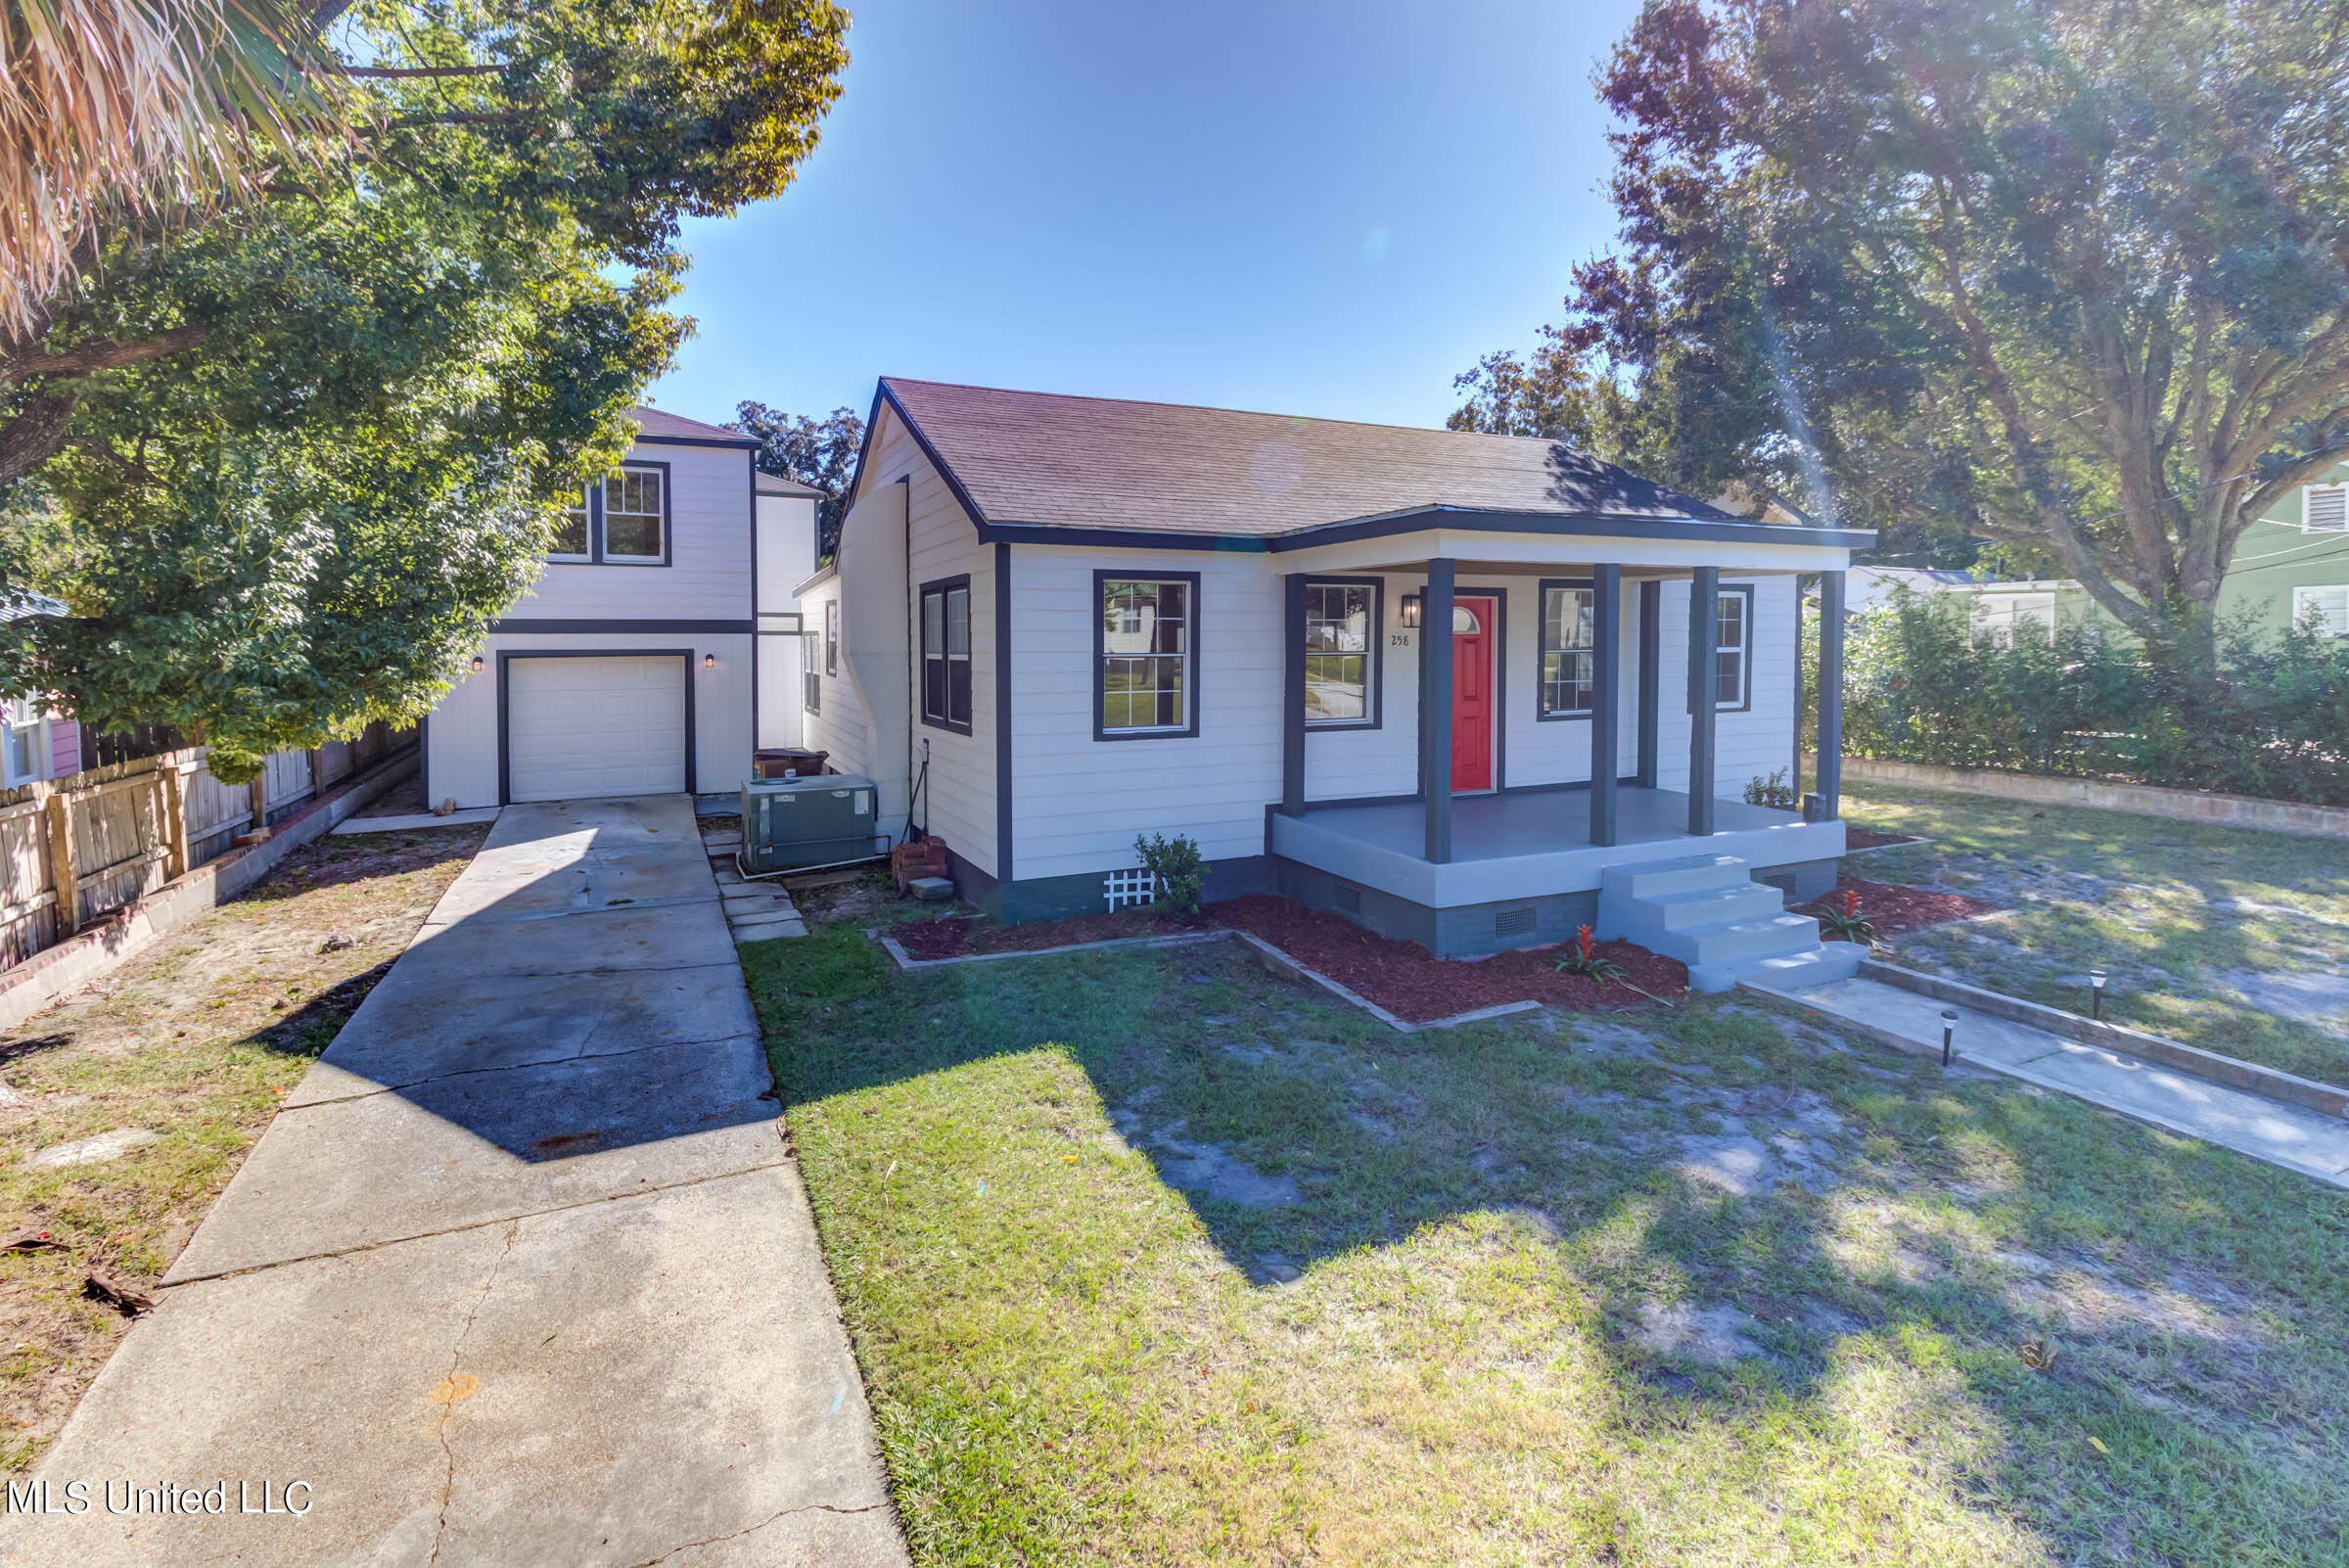
Active
$225,000
2
bds
|
1
ba
|
0
sqft
|
built
1946
258 Porter Ave, Biloxi, MS 39530
$59
Cash flow
1.4%
Cash-on-Cash Return
6.6%
Cap rate
0.9%
Rent to Value Ratio
Active
$250,000
3
bds
|
2
ba
|
0
sqft
|
built
2000
13056 Hudson Krohn Rd, Biloxi, MS 39532
$-22
Cash flow
-0.5%
Cash-on-Cash Return
6.2%
Cap rate
0.8%
Rent to Value Ratio
Active
$160,400
3
bds
|
2
ba
|
0
sqft
|
built
1974
16020 Cherry Dr, Biloxi, MS 39532
$14
Cash flow
0.5%
Cash-on-Cash Return
6.4%
Cap rate
0.9%
Rent to Value Ratio
Active
$495,000
4
bds
|
3
ba
|
0
sqft
|
built
2015
12039 Carls Cv, Biloxi, MS 39532
$-840
Cash flow
-8.9%
Cash-on-Cash Return
4.2%
Cap rate
0.6%
Rent to Value Ratio
Active
$455,000
5
bds
|
4
ba
|
0
sqft
|
built
2004
2509 Provence Pl, Biloxi, MS 39531
$-546
Cash flow
-6.3%
Cash-on-Cash Return
4.8%
Cap rate
0.7%
Rent to Value Ratio
Active
$359,900
2
bds
|
2
ba
|
0
sqft
|
built
2007
2060 Beach Blvd, Biloxi, MS 39531
$-1,019
Cash flow
-14.8%
Cash-on-Cash Return
2.9%
Cap rate
0.8%
Rent to Value Ratio
Active
$138,500
1
bds
|
1
ba
|
0
sqft
|
built
1967
1664 Beach Blvd, Biloxi, MS 39531
$-99
Cash flow
-3.7%
Cash-on-Cash Return
5.4%
Cap rate
1.0%
Rent to Value Ratio
Active
$419,000
4
bds
|
5
ba
|
0
sqft
|
built
2007
6717 Martinique Dr, Biloxi, MS 39532
$-165
Cash flow
-2.1%
Cash-on-Cash Return
5.8%
Cap rate
0.7%
Rent to Value Ratio

Active
$899,000
3
bds
|
4
ba
|
0
sqft
|
built
2008
6100 Ascot Dr, Biloxi, MS 39532
$-2,074
Cash flow
-12.0%
Cash-on-Cash Return
3.5%
Cap rate
0.5%
Rent to Value Ratio