Birmingham, AL Investment Properties for Sale
Browse homes for sale and investment properties in Birmingham, AL. Refine your search by price, property type, or more.
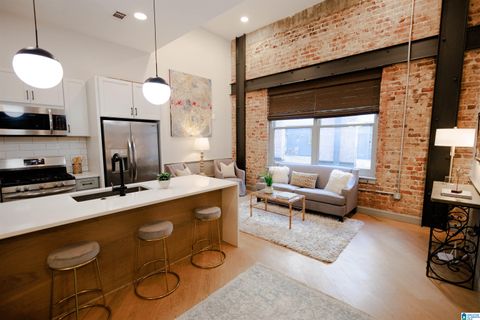
Best cash flowing properties in Birmingham, AL
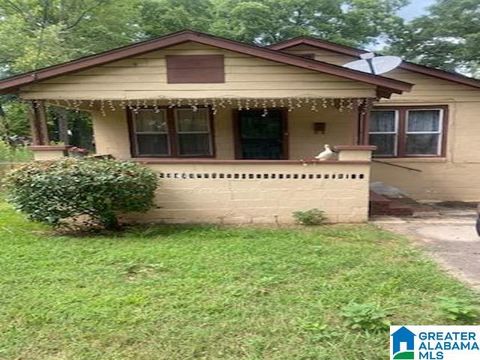
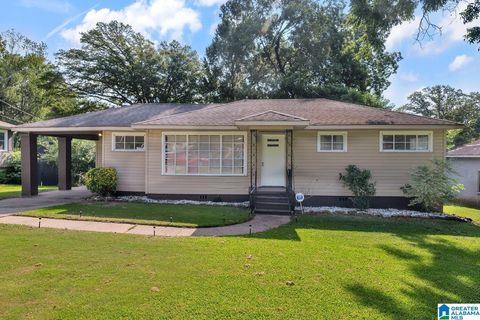
Active
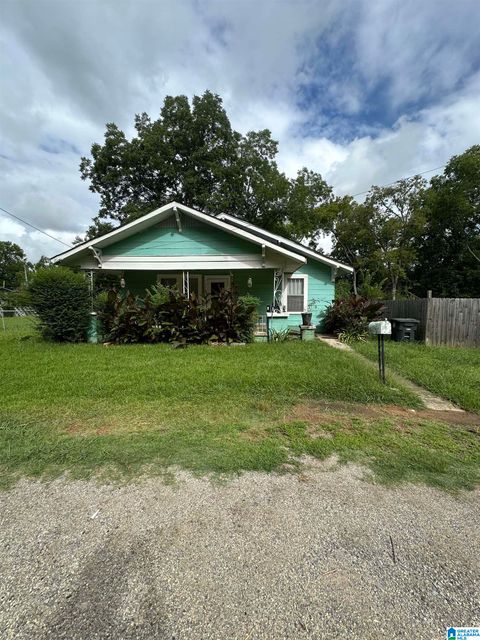
$57,000
3
bds
|
1
ba
|
1,638
sqft
|
built
1930
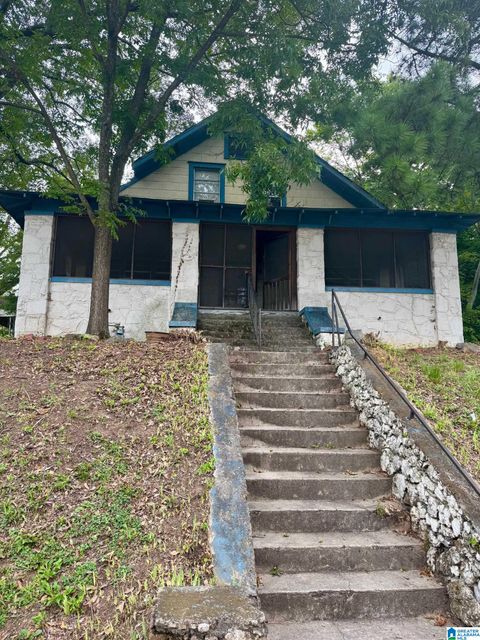
3420 Ellis Ave SW, Birmingham, AL 35221
$897
Cash flow
18.3%
Cash-on-Cash Return
18.9%
Cap rate
2.3%
Rent to Value Ratio
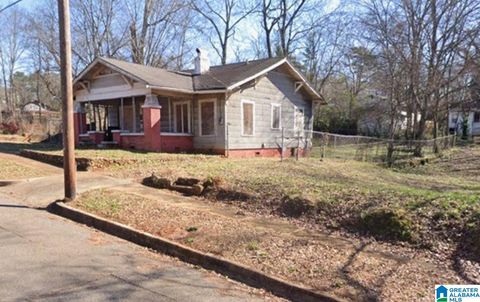
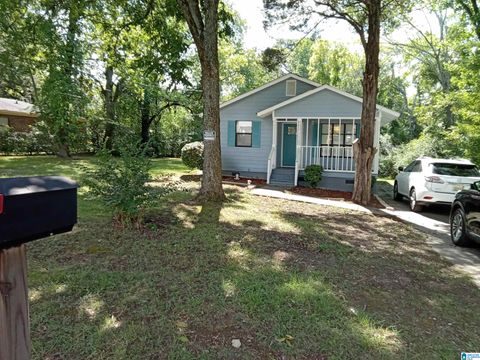
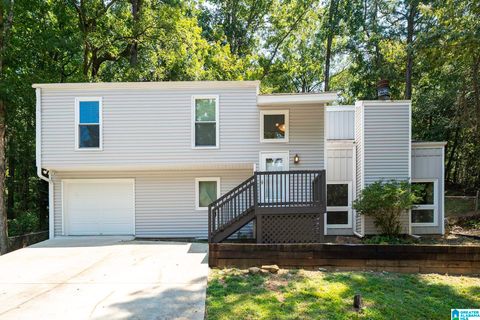
Active
$25,000
3
bds
|
1
ba
|
1,020
sqft
|
built
1917
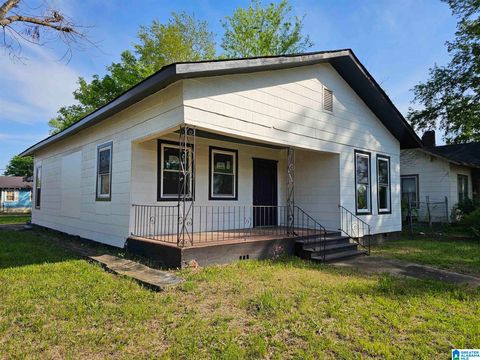
6511 3rd Ave S, Birmingham, AL 35212
$828
Cash flow
38.6%
Cash-on-Cash Return
39.7%
Cap rate
4.8%
Rent to Value Ratio
674 out of 798 properties for sale in Birmingham, AL
Limited Results Shown
Create a free account, or log in to reveal all property listings and enjoy the complete experience.

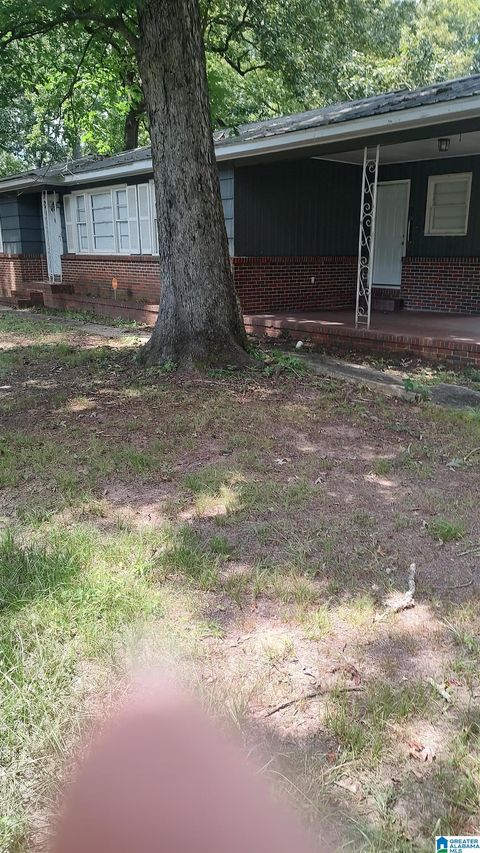
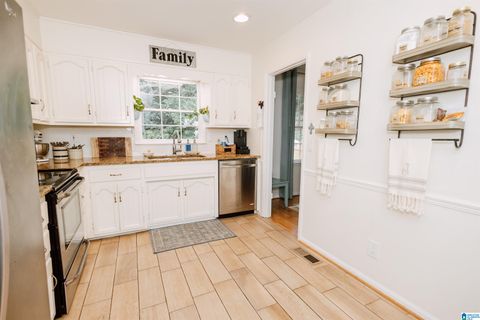
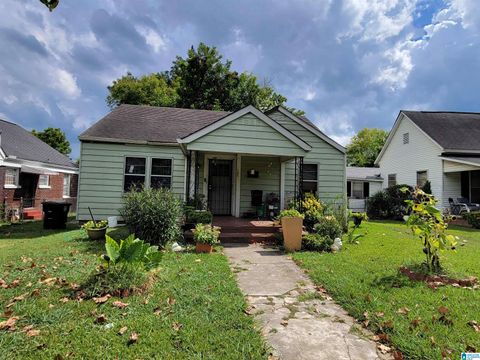
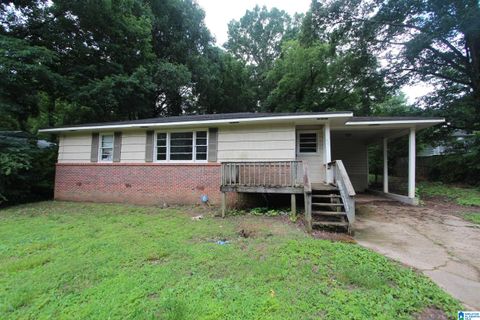
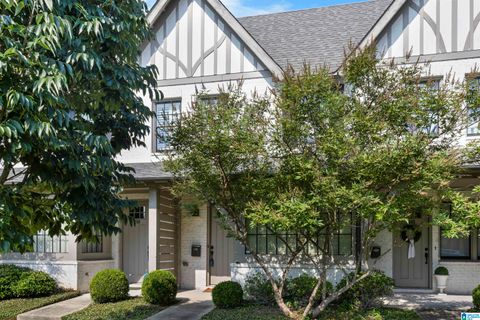
Active
$189,900
3
bds
|
2
ba
|
1,561
sqft
|
built
1920
7305 Division Ave, Birmingham, AL 35206
$67
Cash flow
1.8%
Cash-on-Cash Return
6.1%
Cap rate
0.7%
Rent to Value Ratio
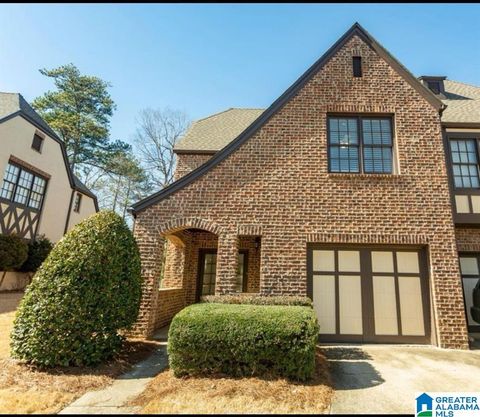
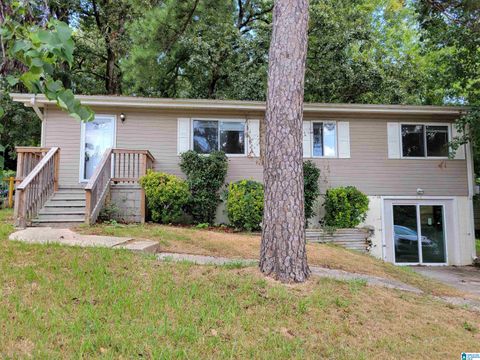
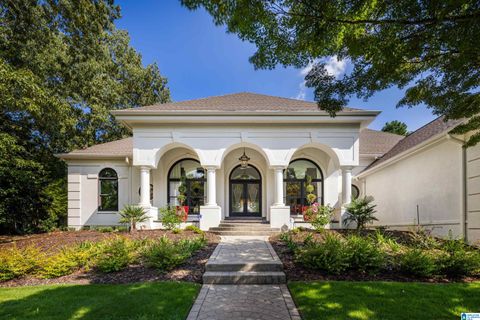
Active
$359,900
3
bds
|
2.5
ba
|
1,740
sqft
|
built
2005
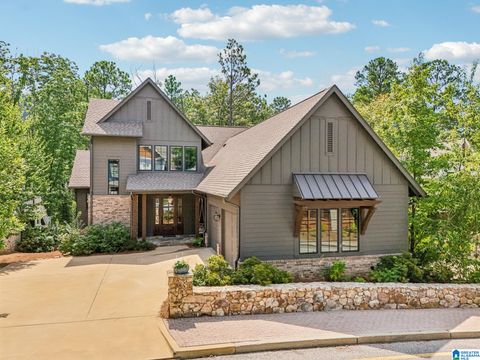
2449 Acton Park Cir, Birmingham, AL 35243
$-323
Cash flow
-4.7%
Cash-on-Cash Return
4.6%
Cap rate
0.6%
Rent to Value Ratio
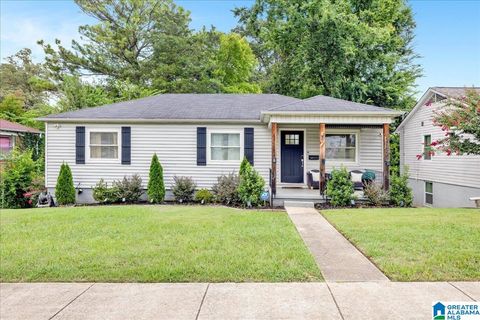
Active
$145,000
3
bds
|
2
ba
|
1,228
sqft
|
built
1957
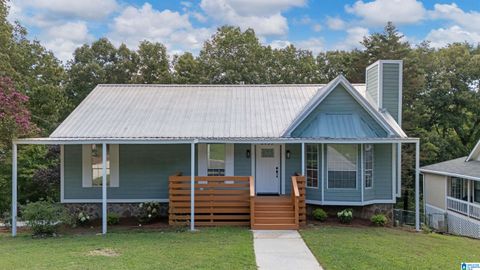
136 Lake Dr NE, Birmingham, AL 35215
$211
Cash flow
7.6%
Cash-on-Cash Return
7.4%
Cap rate
0.9%
Rent to Value Ratio
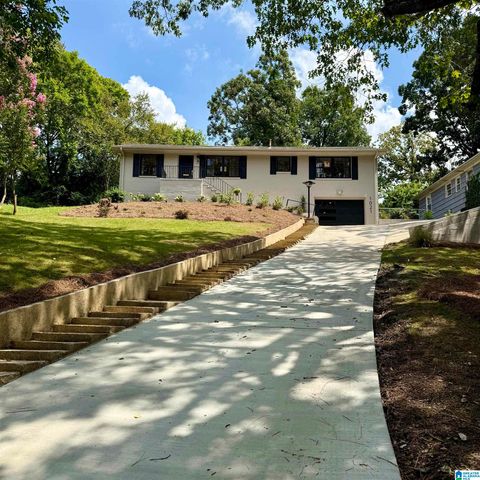
Active
$221,900
3
bds
|
2
ba
|
1,448
sqft
|
built
1968
1440 Hickory Ln, Birmingham, AL 35235
$330
Cash flow
7.8%
Cash-on-Cash Return
7.5%
Cap rate
0.9%
Rent to Value Ratio
Active
$500,000
2
bds
|
2.5
ba
|
2,800
sqft
|
built
2021
1600 16th Ave S, Birmingham, AL 35205
$-227
Cash flow
-2.4%
Cash-on-Cash Return
5.1%
Cap rate
0.6%
Rent to Value Ratio
Active
$400,000
2
bds
|
1.5
ba
|
1,822
sqft
|
built
1924
1921 3rd Ave N, Birmingham, AL 35203
$-168
Cash flow
-2.2%
Cash-on-Cash Return
5.2%
Cap rate
0.6%
Rent to Value Ratio
Active
$150,000
3
bds
|
1
ba
|
1,056
sqft
|
built
1960
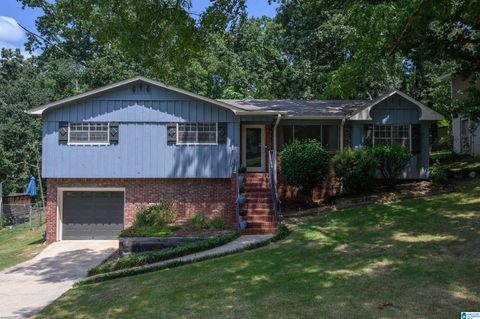
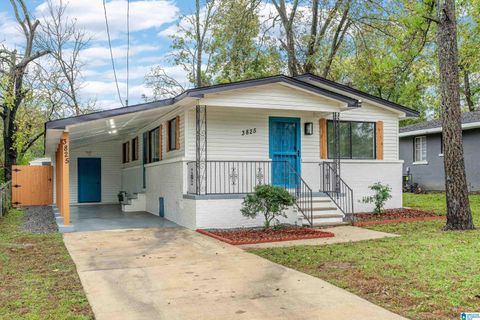
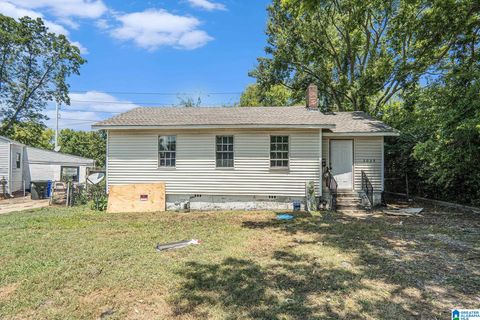
3825 Ellis Ave SW, Birmingham, AL 35221
$256
Cash flow
8.9%
Cash-on-Cash Return
7.7%
Cap rate
0.9%
Rent to Value Ratio
Active
$30,000
2
bds
|
1
ba
|
750
sqft
|
built
1945
4228 42nd Ave N, Birmingham, AL 35217
$759
Cash flow
29.5%
Cash-on-Cash Return
30.4%
Cap rate
3.7%
Rent to Value Ratio
Active
$137,900
3
bds
|
2
ba
|
1,109
sqft
|
built
1955
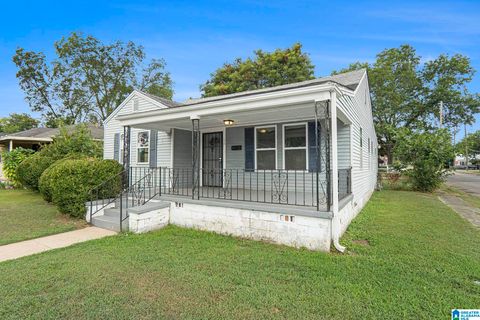
1812 15th St SW, Birmingham, AL 35211
$313
Cash flow
11.8%
Cash-on-Cash Return
8.4%
Cap rate
1.0%
Rent to Value Ratio
Active
$510,000
4
bds
|
2
ba
|
2,428
sqft
|
built
1972
4217 Groover Dr, Birmingham, AL 35213
$-205
Cash flow
-2.1%
Cash-on-Cash Return
5.2%
Cap rate
0.6%
Rent to Value Ratio
Active
$89,900
3
bds
|
1
ba
|
1,144
sqft
|
built
1957
308 13th Ave NW, Birmingham, AL 35215
$403
Cash flow
23.4%
Cash-on-Cash Return
11.1%
Cap rate
1.3%
Rent to Value Ratio
Active
$49,900
3
bds
|
1.5
ba
|
1,146
sqft
|
built
1930
1205 4th Ct W, Birmingham, AL 35208
$759
Cash flow
17.7%
Cash-on-Cash Return
18.3%
Cap rate
2.2%
Rent to Value Ratio
Active
$2,190,000
4
bds
|
3.5
ba
|
4,171
sqft
|
built
1991
3525 Shandwick Pl, Birmingham, AL 35242
$-8,005
Cash flow
-19.1%
Cash-on-Cash Return
1.3%
Cap rate
0.2%
Rent to Value Ratio
Active
$290,000
3
bds
|
3
ba
|
1,750
sqft
|
built
1954
1617 27th St N, Birmingham, AL 35234
$-61
Cash flow
-1.1%
Cash-on-Cash Return
5.4%
Cap rate
0.7%
Rent to Value Ratio
Active
$419,900
3
bds
|
2
ba
|
2,300
sqft
|
built
1960
1021 54th St S, Birmingham, AL 35222
$-469
Cash flow
-5.8%
Cash-on-Cash Return
4.3%
Cap rate
0.5%
Rent to Value Ratio
Active
$95,000
3
bds
|
1
ba
|
1,913
sqft
|
built
1924
1532 Graymont Ave W, Birmingham, AL 35208
$654
Cash flow
35.9%
Cash-on-Cash Return
13.9%
Cap rate
1.7%
Rent to Value Ratio
Active
$110,000
3
bds
|
1.5
ba
|
1,148
sqft
|
built
1961
7836 10th Ave S, Birmingham, AL 35206
$445
Cash flow
21.1%
Cash-on-Cash Return
10.5%
Cap rate
1.3%
Rent to Value Ratio
Active
$275,000
5
bds
|
2
ba
|
1,951
sqft
|
built
1971
3231 Rockbay Cir, Birmingham, AL 35217
$-59
Cash flow
-1.1%
Cash-on-Cash Return
5.4%
Cap rate
0.7%
Rent to Value Ratio
Active
$469,000
3
bds
|
3
ba
|
2,514
sqft
|
built
1979
5081 Pinehurst Ter, Birmingham, AL 35242
$-494
Cash flow
-5.5%
Cash-on-Cash Return
4.4%
Cap rate
0.5%
Rent to Value Ratio
Active
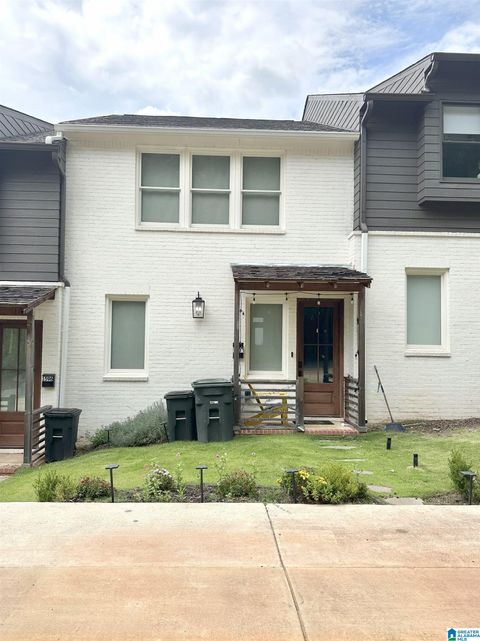
$1,287,500
6
bds
|
5
ba
|
5,297
sqft
|
built
2020
104 Burnham St, Birmingham, AL 35242
$-2,302
Cash flow
-9.3%
Cash-on-Cash Return
3.5%
Cap rate
0.4%
Rent to Value Ratio
Active
$269,900
5
bds
|
3
ba
|
2,715
sqft
|
built
1987
2753 Darlene Cir, Birmingham, AL 35235
$-311
Cash flow
-6.0%
Cash-on-Cash Return
4.3%
Cap rate
0.5%
Rent to Value Ratio
Active
$100,000
3
bds
|
1.5
ba
|
2,039
sqft
|
built
1935
1402 Fred L Shuttlesworth Dr, Birmingham, AL 35234
$562
Cash flow
29.3%
Cash-on-Cash Return
12.4%
Cap rate
1.5%
Rent to Value Ratio
Active
$84,900
4
bds
|
2
ba
|
1,509
sqft
|
built
1930
1701 Avenue I, Birmingham, AL 35218
$357
Cash flow
21.9%
Cash-on-Cash Return
10.7%
Cap rate
1.3%
Rent to Value Ratio
Active
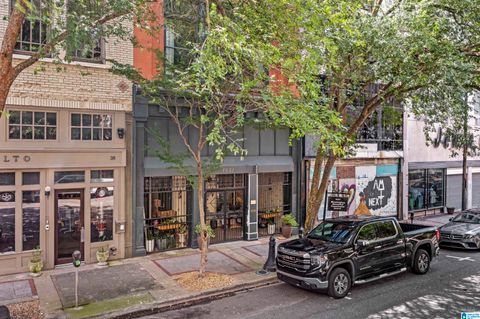
$299,000
1
bds
|
1
ba
|
608
sqft
|
built
1905
2212 Morris Ave, Birmingham, AL 35203
$-416
Cash flow
-7.3%
Cash-on-Cash Return
4.0%
Cap rate
0.6%
Rent to Value Ratio
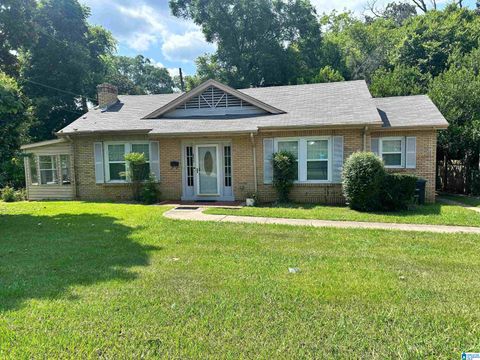
Active
$169,900
3
bds
|
1
ba
|
1,489
sqft
|
built
1954
809 Elizabeth Dr, Birmingham, AL 35215
$162
Cash flow
5.0%
Cash-on-Cash Return
6.8%
Cap rate
0.8%
Rent to Value Ratio
Active
$250,000
3
bds
|
2
ba
|
1,518
sqft
|
built
1976
2431 Wine Ridge Dr, Birmingham, AL 35244
$128
Cash flow
2.7%
Cash-on-Cash Return
6.3%
Cap rate
0.8%
Rent to Value Ratio
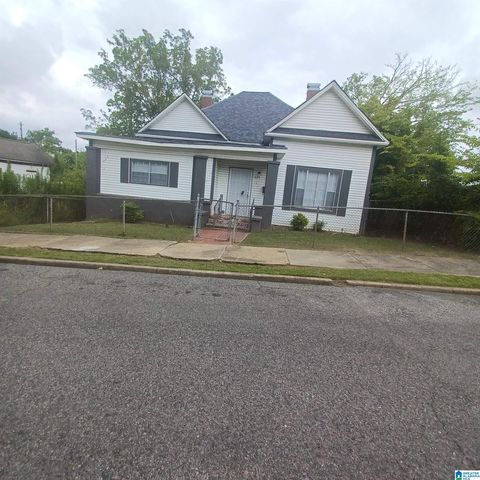
Active
$89,900
3
bds
|
1
ba
|
1,102
sqft
|
built
1955
221 Lawson Rd, Birmingham, AL 35215
$403
Cash flow
23.4%
Cash-on-Cash Return
11.1%
Cap rate
1.3%
Rent to Value Ratio
Active
$439,900
3
bds
|
3
ba
|
1,624
sqft
|
built
2017
1348 Calash Ave, Birmingham, AL 35213
$-400
Cash flow
-4.7%
Cash-on-Cash Return
4.6%
Cap rate
0.6%
Rent to Value Ratio
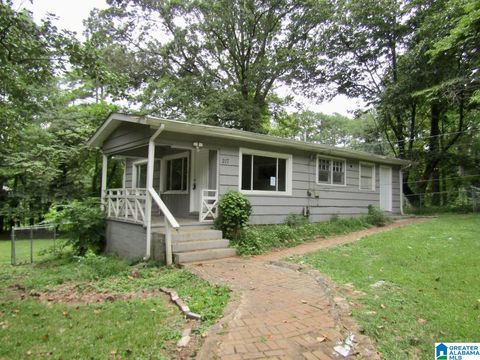
Active
$129,900
3
bds
|
2
ba
|
1,212
sqft
|
built
1955
217 Killough Dr, Birmingham, AL 35215
$282
Cash flow
11.3%
Cash-on-Cash Return
8.3%
Cap rate
1.0%
Rent to Value Ratio
Active
$115,000
3
bds
|
1
ba
|
1,774
sqft
|
built
1935
625 5th Way, Birmingham, AL 35214
$422
Cash flow
19.1%
Cash-on-Cash Return
10.1%
Cap rate
1.2%
Rent to Value Ratio
Active
$185,000
3
bds
|
2
ba
|
1,938
sqft
|
built
1940
8512 4th Ave S, Birmingham, AL 35206
$160
Cash flow
4.5%
Cash-on-Cash Return
6.7%
Cap rate
0.8%
Rent to Value Ratio
Active
$72,500
2
bds
|
1
ba
|
813
sqft
|
built
1947
2028 Lee Ter SW, Birmingham, AL 35211
$621
Cash flow
10.0%
Cash-on-Cash Return
10.3%
Cap rate
1.2%
Rent to Value Ratio
Active
$99,900
3
bds
|
1
ba
|
1,409
sqft
|
built
1988
3100 Avenue J, Birmingham, AL 35218
$355
Cash flow
18.5%
Cash-on-Cash Return
9.9%
Cap rate
1.2%
Rent to Value Ratio
Active
$69,900
2
bds
|
1
ba
|
820
sqft
|
built
1915
724 Alabama Ave SW, Birmingham, AL 35211
$621
Cash flow
10.4%
Cash-on-Cash Return
10.7%
Cap rate
1.3%
Rent to Value Ratio
Active
$94,900
3
bds
|
1
ba
|
1,014
sqft
|
built
1956
1205 31st St SW, Birmingham, AL 35221
$241
Cash flow
13.2%
Cash-on-Cash Return
8.7%
Cap rate
1.1%
Rent to Value Ratio
Active
$165,000
3
bds
|
1
ba
|
2,731
sqft
|
built
1964
1612 Laurel Ave SW, Birmingham, AL 35211
$185
Cash flow
5.8%
Cash-on-Cash Return
7.0%
Cap rate
0.8%
Rent to Value Ratio
Active
$189,900
3
bds
|
2
ba
|
1,250
sqft
|
built
1948
1939 Dunbar Ave, Birmingham, AL 35214
$-71
Cash flow
-2.0%
Cash-on-Cash Return
5.2%
Cap rate
0.6%
Rent to Value Ratio

Active
$205,000
3
bds
|
1.5
ba
|
1,305
sqft
|
built
1959
1153 Bowman Rd, Birmingham, AL 35235
$-4
Cash flow
-0.1%
Cash-on-Cash Return
5.7%
Cap rate
0.7%
Rent to Value Ratio