Birmingham, AL Investment Properties for Sale
Browse homes for sale and investment properties in Birmingham, AL. Refine your search by price, property type, or more.
Best cash flowing properties in Birmingham, AL
Active
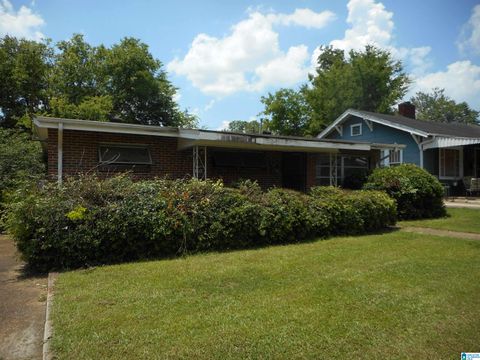
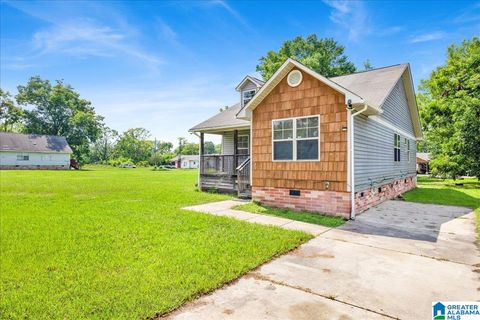
$36,500
3
bds
|
0
ba
|
1,036
sqft
|
built
1958
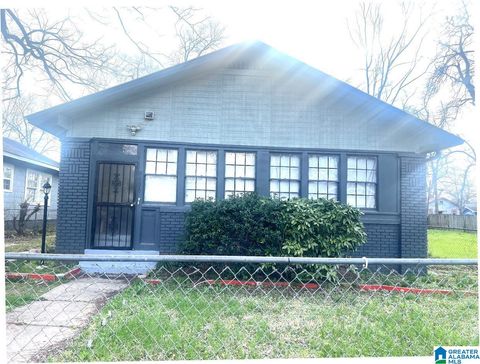
1617 51st Street Ensley, Birmingham, AL 35208
$966
Cash flow
30.8%
Cash-on-Cash Return
31.8%
Cap rate
3.8%
Rent to Value Ratio
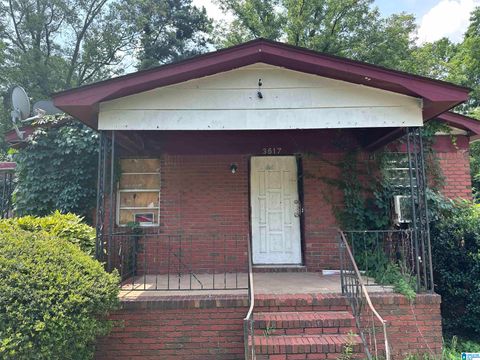
Active
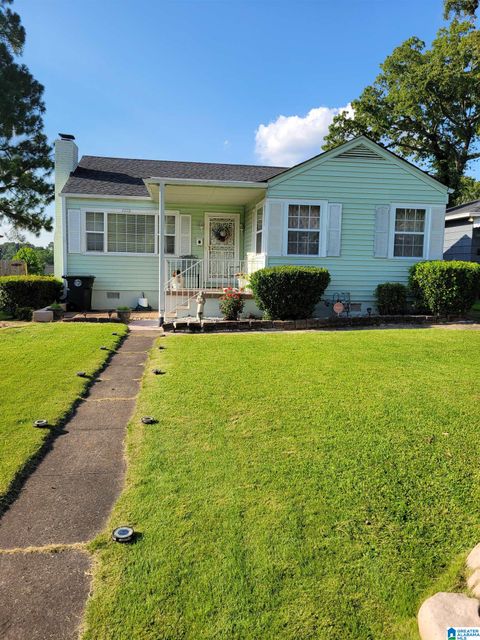
$59,999
3
bds
|
0
ba
|
1,144
sqft
|
built
1981
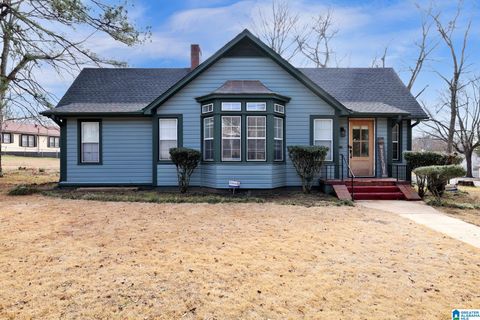
3617 Laurel Ave SW, Birmingham, AL 35221
$897
Cash flow
17.4%
Cash-on-Cash Return
17.9%
Cap rate
2.2%
Rent to Value Ratio
840 out of 962 properties for sale in Birmingham, AL
Limited Results Shown
Create a free account, or log in to reveal all property listings and enjoy the complete experience.
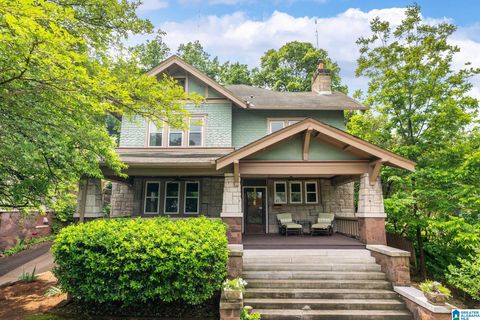
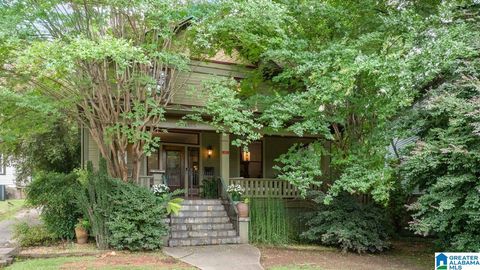
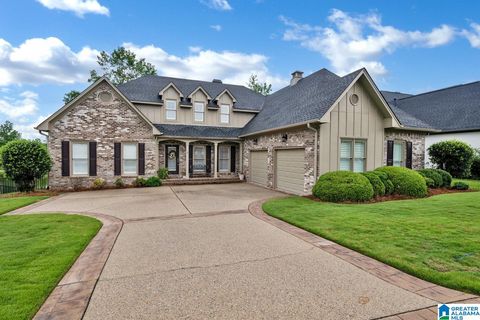
Active
$524,900
6
bds
|
3.5
ba
|
3,484
sqft
|
built
1905
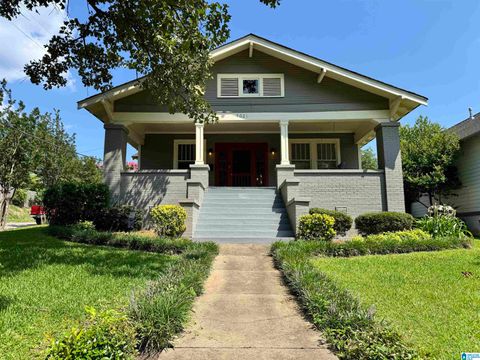
1733 15th Ave S, Birmingham, AL 35205
$-276
Cash flow
-2.7%
Cash-on-Cash Return
5.0%
Cap rate
0.6%
Rent to Value Ratio

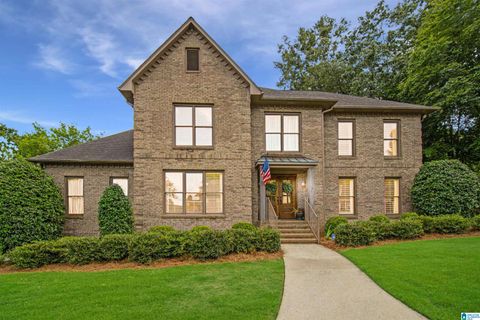
Active
$1,750,000
5
bds
|
5.5
ba
|
5,018
sqft
|
built
2025
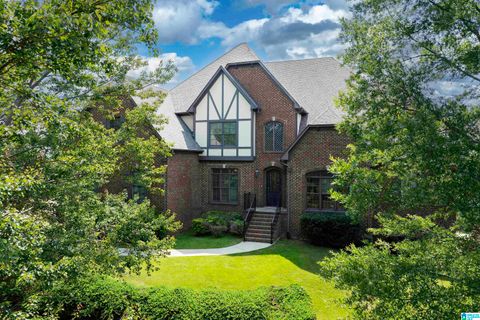
2809 Green Valley Rd, Birmingham, AL 35243
$-6,695
Cash flow
-20.0%
Cash-on-Cash Return
1.1%
Cap rate
0.1%
Rent to Value Ratio
Active
$749,900
4
bds
|
4.5
ba
|
5,002
sqft
|
built
1990
4100 Kinross Cir, Birmingham, AL 35242
$-1,088
Cash flow
-7.6%
Cash-on-Cash Return
3.9%
Cap rate
0.5%
Rent to Value Ratio
Active
$435,000
4
bds
|
0
ba
|
2,794
sqft
|
built
1999
832 Meadow Ridge Ln, Birmingham, AL 35242
$-148
Cash flow
-1.8%
Cash-on-Cash Return
5.3%
Cap rate
0.6%
Rent to Value Ratio
Active
$125,000
2
bds
|
0
ba
|
1,316
sqft
|
built
1988
1251 Magnolia Pl, Birmingham, AL 35215
$167
Cash flow
7.0%
Cash-on-Cash Return
7.3%
Cap rate
0.9%
Rent to Value Ratio
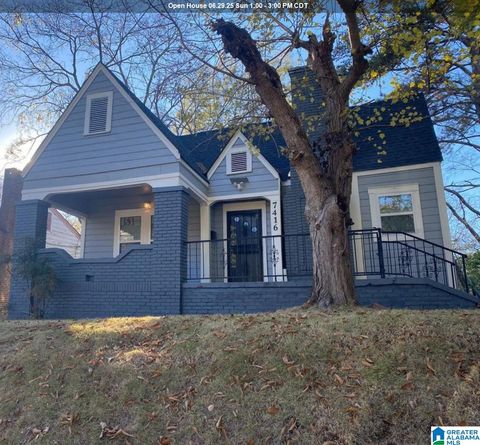
Active
$135,000
3
bds
|
0
ba
|
1,438
sqft
|
built
1948
7416 Rome Ave, Birmingham, AL 35206
$399
Cash flow
15.4%
Cash-on-Cash Return
9.8%
Cap rate
1.2%
Rent to Value Ratio
Active
$550,000
4
bds
|
0
ba
|
3,162
sqft
|
built
2015
1009 Snowshill Cir, Birmingham, AL 35242
$-238
Cash flow
-2.3%
Cash-on-Cash Return
5.2%
Cap rate
0.6%
Rent to Value Ratio
Active
$509,900
4
bds
|
0
ba
|
2,965
sqft
|
built
1904
1425 18th St S, Birmingham, AL 35205
$-247
Cash flow
-2.5%
Cash-on-Cash Return
5.7%
Cap rate
0.7%
Rent to Value Ratio
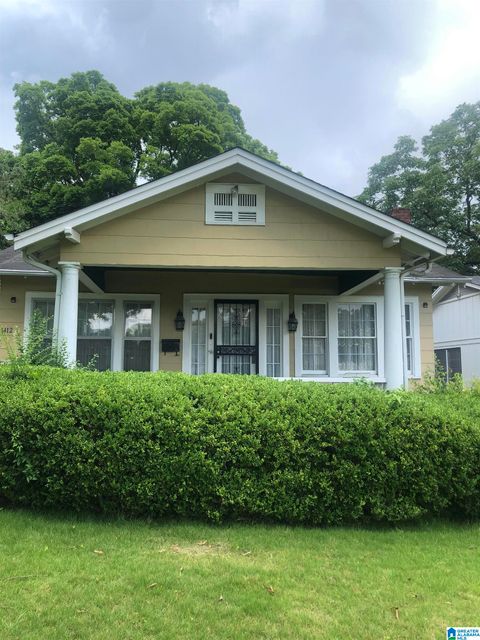
Active
$140,000
3
bds
|
0
ba
|
1,448
sqft
|
built
1935
1412 42nd Street Ensley, Birmingham, AL 35208
$373
Cash flow
13.9%
Cash-on-Cash Return
9.5%
Cap rate
1.1%
Rent to Value Ratio
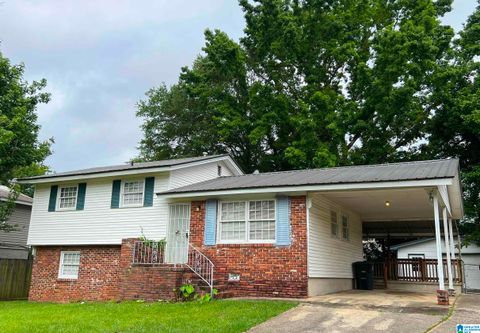
Active
$139,900
4
bds
|
0
ba
|
1,992
sqft
|
built
1964
1128 Cheyenne Blvd, Birmingham, AL 35215
$98
Cash flow
3.7%
Cash-on-Cash Return
7.1%
Cap rate
0.9%
Rent to Value Ratio
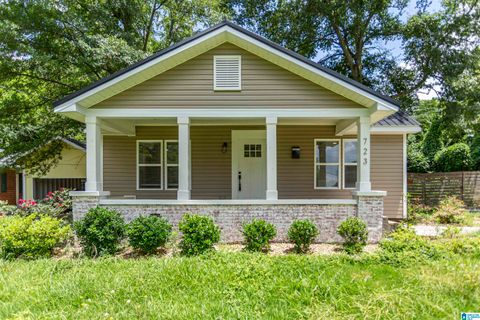
Active
$239,000
3
bds
|
0
ba
|
1,380
sqft
|
built
1937
723 84th Pl S, Birmingham, AL 35206
$137
Cash flow
3.0%
Cash-on-Cash Return
6.9%
Cap rate
0.8%
Rent to Value Ratio
Active
$359,900
3
bds
|
0
ba
|
1,424
sqft
|
built
1930
5021 6th Ave S, Birmingham, AL 35212
$22
Cash flow
0.3%
Cash-on-Cash Return
5.8%
Cap rate
0.7%
Rent to Value Ratio
Active
$265,000
3
bds
|
0
ba
|
2,116
sqft
|
built
1940
1429 Bush Blvd W, Birmingham, AL 35208
$-150
Cash flow
-3.0%
Cash-on-Cash Return
5.0%
Cap rate
0.6%
Rent to Value Ratio
Active
$1,450,000
6
bds
|
0
ba
|
7,594
sqft
|
built
2006
264 Highland View Dr, Birmingham, AL 35242
$-5,024
Cash flow
-18.1%
Cash-on-Cash Return
2.1%
Cap rate
0.3%
Rent to Value Ratio
Active
$135,000
4
bds
|
0
ba
|
1,734
sqft
|
built
1925
4736 Court R, Birmingham, AL 35208
$537
Cash flow
20.8%
Cash-on-Cash Return
11.0%
Cap rate
1.3%
Rent to Value Ratio
Active
$179,000
3
bds
|
0
ba
|
1,008
sqft
|
built
1980
2179 Mountain View Rd, Birmingham, AL 35210
$119
Cash flow
3.5%
Cash-on-Cash Return
6.5%
Cap rate
0.8%
Rent to Value Ratio
Active
$130,000
2
bds
|
0
ba
|
988
sqft
|
built
1956
1669 18th St SW, Birmingham, AL 35211
$213
Cash flow
8.5%
Cash-on-Cash Return
7.6%
Cap rate
0.9%
Rent to Value Ratio
Active
$119,900
4
bds
|
0
ba
|
1,320
sqft
|
built
1959
6804 66th St S, Birmingham, AL 35212
$192
Cash flow
8.4%
Cash-on-Cash Return
7.6%
Cap rate
0.9%
Rent to Value Ratio
Active
$175,000
3
bds
|
0
ba
|
1,572
sqft
|
built
1935
7236 Oporto Ave, Birmingham, AL 35206
$190
Cash flow
5.7%
Cash-on-Cash Return
7.6%
Cap rate
0.9%
Rent to Value Ratio
Active
$529,000
4
bds
|
0
ba
|
2,514
sqft
|
built
1963
2713 Altadena Lake Rd, Birmingham, AL 35243
$-830
Cash flow
-8.2%
Cash-on-Cash Return
4.4%
Cap rate
0.5%
Rent to Value Ratio
Active
$27,500
3
bds
|
0
ba
|
958
sqft
|
built
1927
7116 Oporto Ave, Birmingham, AL 35206
$828
Cash flow
35.1%
Cash-on-Cash Return
36.1%
Cap rate
4.4%
Rent to Value Ratio
Active
$1,499,000
6
bds
|
0
ba
|
5,598
sqft
|
built
2003
1007 Eagle Hill Dr, Birmingham, AL 35242
$-4,470
Cash flow
-15.6%
Cash-on-Cash Return
2.7%
Cap rate
0.3%
Rent to Value Ratio
Active
$69,900
2
bds
|
0
ba
|
706
sqft
|
built
1950
109 14th Ct W, Birmingham, AL 35204
$690
Cash flow
11.5%
Cash-on-Cash Return
11.8%
Cap rate
1.4%
Rent to Value Ratio
Active
$565,000
4
bds
|
0
ba
|
3,112
sqft
|
built
1975
3405 Falcon Wood Ln, Birmingham, AL 35242
$-276
Cash flow
-2.5%
Cash-on-Cash Return
5.1%
Cap rate
0.6%
Rent to Value Ratio
Active
$170,000
3
bds
|
0
ba
|
1,917
sqft
|
built
1964
2132 Etowah St, Birmingham, AL 35217
$354
Cash flow
10.9%
Cash-on-Cash Return
8.8%
Cap rate
1.1%
Rent to Value Ratio

Active
$644,000
5
bds
|
0
ba
|
3,394
sqft
|
built
1984
4956 Meadow Brook Rd, Birmingham, AL 35242
$-1,156
Cash flow
-9.4%
Cash-on-Cash Return
4.1%
Cap rate
0.5%
Rent to Value Ratio
Active
$85,000
3
bds
|
0
ba
|
1,512
sqft
|
built
1930
5824 Underwood Ave, Birmingham, AL 35228
$564
Cash flow
34.6%
Cash-on-Cash Return
13.6%
Cap rate
1.6%
Rent to Value Ratio
Active
$220,000
3
bds
|
0
ba
|
2,241
sqft
|
built
1925
8030 1st Ave S, Birmingham, AL 35206
$-114
Cash flow
-2.7%
Cash-on-Cash Return
5.6%
Cap rate
0.7%
Rent to Value Ratio
Active
$139,900
3
bds
|
0
ba
|
1,232
sqft
|
built
2007
1324 Fulton Ave SW, Birmingham, AL 35211
$304
Cash flow
11.3%
Cash-on-Cash Return
8.3%
Cap rate
1.0%
Rent to Value Ratio
Active
$99,900
2
bds
|
0
ba
|
1,401
sqft
|
built
1949
1310 43rd Street Ensley, Birmingham, AL 35208
$513
Cash flow
26.8%
Cash-on-Cash Return
12.4%
Cap rate
1.5%
Rent to Value Ratio
Active
$85,000
2
bds
|
0
ba
|
902
sqft
|
built
1949
3212 Avenue G, Birmingham, AL 35218
$150
Cash flow
9.2%
Cash-on-Cash Return
7.8%
Cap rate
0.9%
Rent to Value Ratio
Active
$799,900
4
bds
|
0
ba
|
4,213
sqft
|
built
1998
5557 Lakes Edge Dr, Birmingham, AL 35242
$-1,560
Cash flow
-10.2%
Cash-on-Cash Return
3.9%
Cap rate
0.5%
Rent to Value Ratio
Active
$449,900
3
bds
|
0
ba
|
1,346
sqft
|
built
1930
620 52nd St S, Birmingham, AL 35212
$-404
Cash flow
-4.7%
Cash-on-Cash Return
4.6%
Cap rate
0.6%
Rent to Value Ratio
Active
$245,000
3
bds
|
0
ba
|
1,376
sqft
|
built
2014
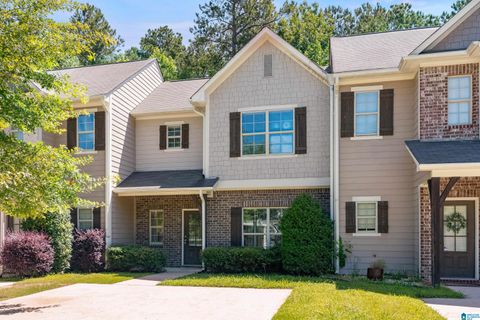
2564 Ridgemont Dr, Birmingham, AL 35244
$-62
Cash flow
-1.3%
Cash-on-Cash Return
6.0%
Cap rate
0.7%
Rent to Value Ratio
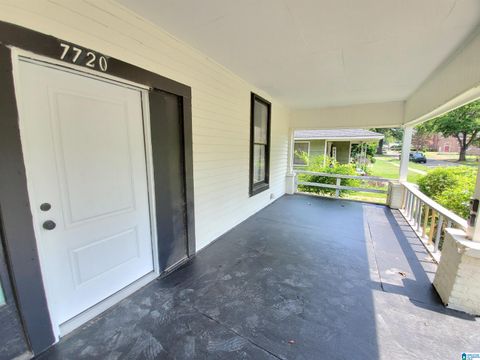
Active
$165,900
4
bds
|
0
ba
|
1,754
sqft
|
built
1920
7720 1st Ave S, Birmingham, AL 35206
$-38
Cash flow
-1.2%
Cash-on-Cash Return
6.0%
Cap rate
0.7%
Rent to Value Ratio
Active
$595,000
3
bds
|
0
ba
|
2,698
sqft
|
built
2006
243 Courtside Dr, Birmingham, AL 35242
$-733
Cash flow
-6.4%
Cash-on-Cash Return
4.8%
Cap rate
0.6%
Rent to Value Ratio
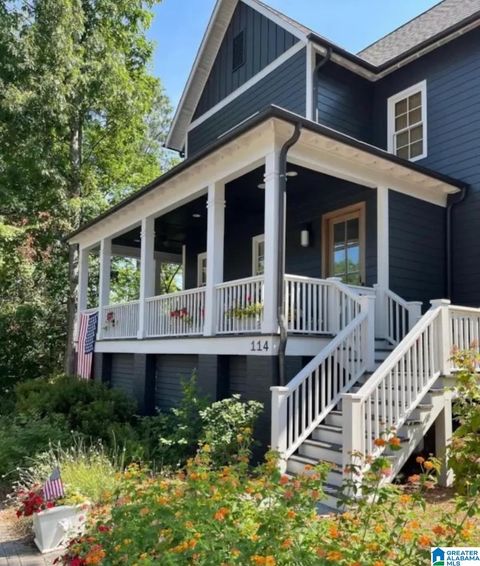
Active
$799,000
4
bds
|
0
ba
|
2,795
sqft
|
built
2016
114 Elyton Dr, Birmingham, AL 35242
$-1,208
Cash flow
-7.9%
Cash-on-Cash Return
4.5%
Cap rate
0.6%
Rent to Value Ratio
Active
$679,900
5
bds
|
0
ba
|
4,427
sqft
|
built
1996
4067 Milners Cres, Birmingham, AL 35242
$-1,210
Cash flow
-9.3%
Cash-on-Cash Return
4.1%
Cap rate
0.5%
Rent to Value Ratio