Birmingham, AL Investment Properties for Sale
Browse homes for sale and investment properties in Birmingham, AL. Refine your search by price, property type, or more.
Best cash flowing properties in Birmingham, AL
Active
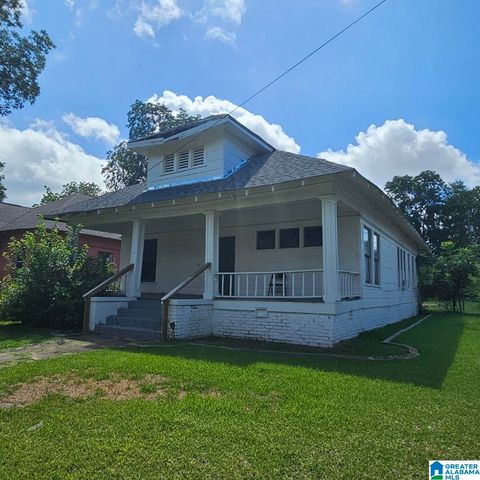
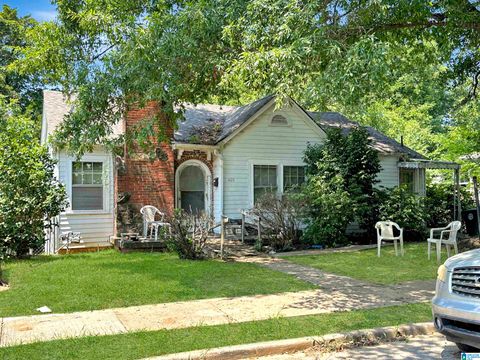
$74,900
3
bds
|
0
ba
|
1,662
sqft
|
built
1930
1443 Princeton Ave SW, Birmingham, AL 35211
$759
Cash flow
11.8%
Cash-on-Cash Return
12.2%
Cap rate
1.5%
Rent to Value Ratio
Active
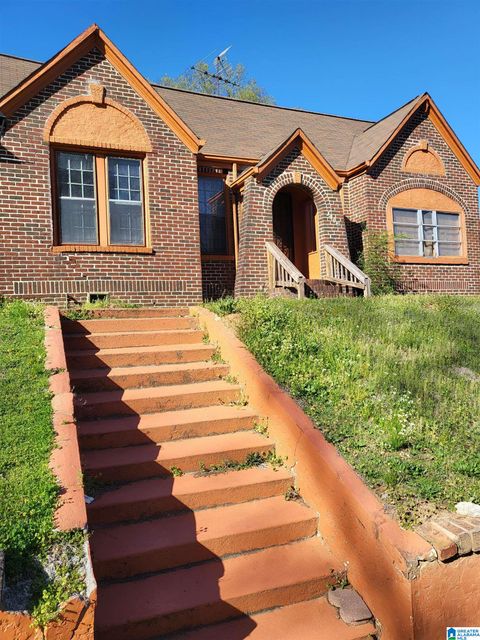
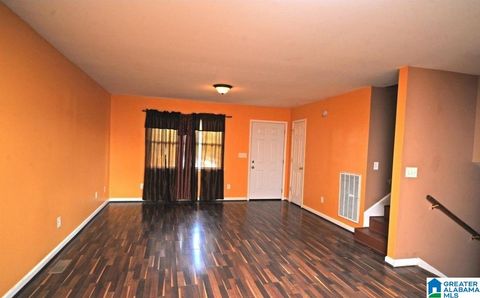
$69,500
3
bds
|
0
ba
|
1,378
sqft
|
built
1925
1512 47th Street Ensley, Birmingham, AL 35208
$759
Cash flow
12.7%
Cash-on-Cash Return
13.1%
Cap rate
1.6%
Rent to Value Ratio
767 out of 882 properties for sale in Birmingham, AL
Limited Results Shown
Create a free account, or log in to reveal all property listings and enjoy the complete experience.
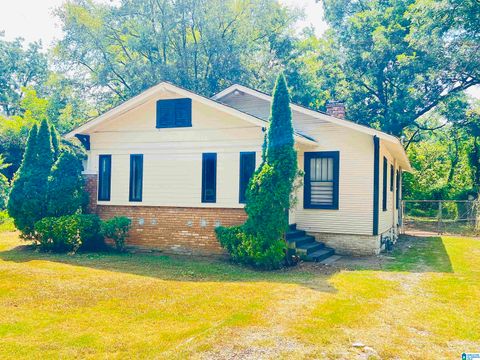
Active
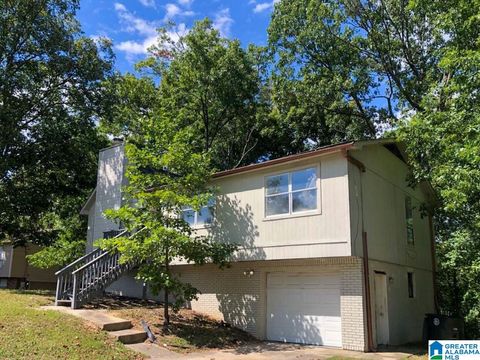
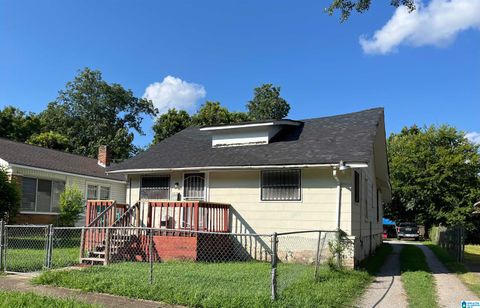
$120,000
3
bds
|
0
ba
|
1,682
sqft
|
built
1979
3035 Apple Valley Ln, Birmingham, AL 35215
$271
Cash flow
11.8%
Cash-on-Cash Return
9.0%
Cap rate
1.1%
Rent to Value Ratio
Active
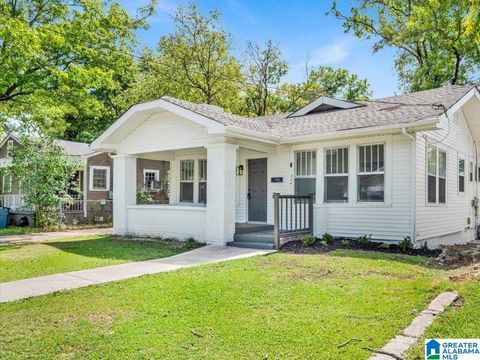
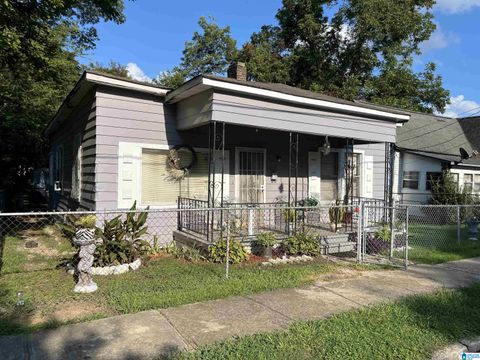
$105,000
3
bds
|
0
ba
|
1,386
sqft
|
built
1935
324 85th St N, Birmingham, AL 35206
$418
Cash flow
20.8%
Cash-on-Cash Return
11.0%
Cap rate
1.3%
Rent to Value Ratio
Active
$110,000
3
bds
|
0
ba
|
1,728
sqft
|
built
1925
3125 Aspen Ave SW, Birmingham, AL 35221
$392
Cash flow
18.6%
Cash-on-Cash Return
10.5%
Cap rate
1.3%
Rent to Value Ratio
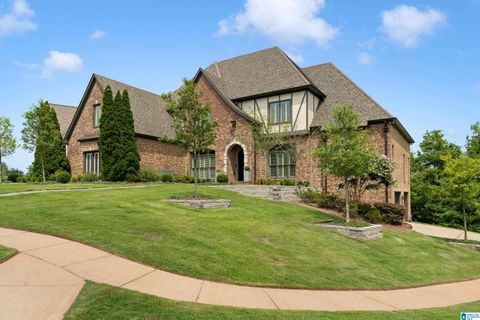
Active
$1,249,900
6
bds
|
0
ba
|
5,959
sqft
|
built
2004
5207 Mountain Ridge Pkwy, Birmingham, AL 35222
$-3,156
Cash flow
-13.2%
Cash-on-Cash Return
3.2%
Cap rate
0.4%
Rent to Value Ratio

Active
$774,900
4
bds
|
0
ba
|
4,054
sqft
|
built
1915
2731 Highland Ave S, Birmingham, AL 35205
$-1,838
Cash flow
-12.4%
Cash-on-Cash Return
3.4%
Cap rate
0.4%
Rent to Value Ratio

Active
$399,999
5
bds
|
0
ba
|
2,727
sqft
|
built
1964
4804 Lincrest Dr, Birmingham, AL 35222
$-570
Cash flow
-7.4%
Cash-on-Cash Return
4.6%
Cap rate
0.6%
Rent to Value Ratio
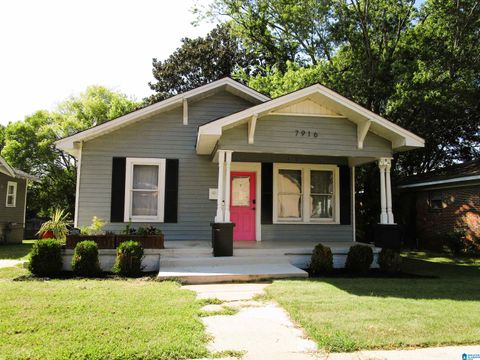
Active
$158,900
3
bds
|
0
ba
|
1,064
sqft
|
built
1925
7916 5th Ave S, Birmingham, AL 35206
$136
Cash flow
4.5%
Cash-on-Cash Return
7.3%
Cap rate
0.9%
Rent to Value Ratio
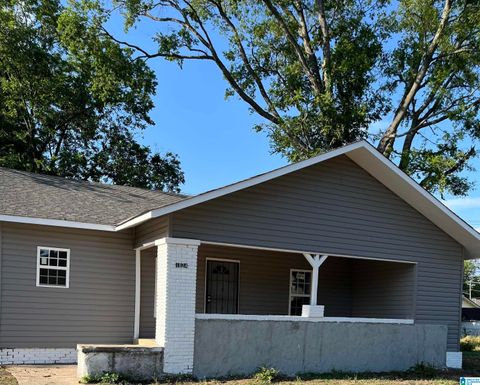
Active
$159,000
3
bds
|
0
ba
|
1,274
sqft
|
built
1940
1624 52nd Street Ensley, Birmingham, AL 35208
$136
Cash flow
4.5%
Cash-on-Cash Return
7.3%
Cap rate
0.9%
Rent to Value Ratio
Active
$59,000
3
bds
|
0
ba
|
1,152
sqft
|
built
1940
426 Memphis St, Birmingham, AL 35224
$690
Cash flow
13.6%
Cash-on-Cash Return
14.0%
Cap rate
1.7%
Rent to Value Ratio
Active
$140,900
4
bds
|
0
ba
|
1,316
sqft
|
built
1971
2806 Micmac Dr, Birmingham, AL 35215
$92
Cash flow
3.4%
Cash-on-Cash Return
7.1%
Cap rate
0.9%
Rent to Value Ratio
Active
$75,000
3
bds
|
0
ba
|
1,426
sqft
|
built
1924
4637 Avenue S, Birmingham, AL 35208
$367
Cash flow
25.5%
Cash-on-Cash Return
12.1%
Cap rate
1.5%
Rent to Value Ratio
Active
$75,000
3
bds
|
0
ba
|
1,248
sqft
|
built
1920
605 Avenue U, Birmingham, AL 35214
$298
Cash flow
20.7%
Cash-on-Cash Return
11.0%
Cap rate
1.3%
Rent to Value Ratio
Active
$75,000
3
bds
|
0
ba
|
1,157
sqft
|
built
1920
200 Cordova Ave, Birmingham, AL 35214
$367
Cash flow
25.5%
Cash-on-Cash Return
12.1%
Cap rate
1.5%
Rent to Value Ratio
Active
$110,000
3
bds
|
0
ba
|
1,390
sqft
|
built
1930
1317 2nd Ave W, Birmingham, AL 35208
$254
Cash flow
12.0%
Cash-on-Cash Return
9.0%
Cap rate
1.1%
Rent to Value Ratio
Active
$62,000
3
bds
|
0
ba
|
1,260
sqft
|
built
1954
2137 Arkadelphia Rd, Birmingham, AL 35204
$690
Cash flow
13.0%
Cash-on-Cash Return
13.4%
Cap rate
1.6%
Rent to Value Ratio
Active
$105,000
3
bds
|
0
ba
|
1,398
sqft
|
built
1920
2436 29th Street Ensley, Birmingham, AL 35208
$418
Cash flow
20.8%
Cash-on-Cash Return
11.0%
Cap rate
1.3%
Rent to Value Ratio
Active
$364,900
3
bds
|
0
ba
|
1,312
sqft
|
built
1954
4300 Linwood Dr, Birmingham, AL 35222
$-525
Cash flow
-7.5%
Cash-on-Cash Return
4.5%
Cap rate
0.5%
Rent to Value Ratio
Active
$175,000
5
bds
|
0
ba
|
2,770
sqft
|
built
1920
2231 14th Ave N, Birmingham, AL 35234
$52
Cash flow
1.6%
Cash-on-Cash Return
6.6%
Cap rate
0.8%
Rent to Value Ratio
Active
$489,900
4
bds
|
0
ba
|
2,662
sqft
|
built
1990
4376 Heritage View Rd, Birmingham, AL 35242
$-557
Cash flow
-5.9%
Cash-on-Cash Return
4.9%
Cap rate
0.6%
Rent to Value Ratio

Active
$450,000
3
bds
|
0
ba
|
0
sqft
|
built
1955
3500 12th Ave N, Birmingham, AL 35234
$-969
Cash flow
-11.2%
Cash-on-Cash Return
3.7%
Cap rate
0.4%
Rent to Value Ratio
Active
$62,900
3
bds
|
0
ba
|
993
sqft
|
built
1952
604 Lexington St, Birmingham, AL 35224
$690
Cash flow
12.8%
Cash-on-Cash Return
13.2%
Cap rate
1.6%
Rent to Value Ratio
Active
$120,000
3
bds
|
0
ba
|
1,368
sqft
|
built
1983
1616 Hatchet Ave, Birmingham, AL 35217
$340
Cash flow
14.8%
Cash-on-Cash Return
9.7%
Cap rate
1.2%
Rent to Value Ratio
Active
$78,000
3
bds
|
0
ba
|
1,194
sqft
|
built
1930
1338 Park Ave, Birmingham, AL 35217
$283
Cash flow
18.9%
Cash-on-Cash Return
10.6%
Cap rate
1.3%
Rent to Value Ratio

Active
$99,900
2
bds
|
0
ba
|
920
sqft
|
built
1948
108 Mississippi St, Birmingham, AL 35214
$375
Cash flow
19.6%
Cash-on-Cash Return
10.8%
Cap rate
1.3%
Rent to Value Ratio

Active
$299,900
3
bds
|
0
ba
|
3,335
sqft
|
built
1920
2325 27th Street Ensley, Birmingham, AL 35208
$366
Cash flow
6.4%
Cash-on-Cash Return
7.7%
Cap rate
0.9%
Rent to Value Ratio

Active
$139,900
3
bds
|
0
ba
|
1,348
sqft
|
built
1939
801 81st St S, Birmingham, AL 35206
$239
Cash flow
8.9%
Cash-on-Cash Return
8.3%
Cap rate
1.0%
Rent to Value Ratio
Active
$99,000
4
bds
|
0
ba
|
1,552
sqft
|
built
1973
1030 Cherrybrook Cir, Birmingham, AL 35214
$311
Cash flow
16.4%
Cash-on-Cash Return
10.0%
Cap rate
1.2%
Rent to Value Ratio

Active
$750,000
3
bds
|
0
ba
|
1,824
sqft
|
built
1958
2465 Old Springville Rd, Birmingham, AL 35215
$-2,536
Cash flow
-17.6%
Cash-on-Cash Return
2.2%
Cap rate
0.3%
Rent to Value Ratio
Active
$135,000
3
bds
|
0
ba
|
1,290
sqft
|
built
1936
515 72nd St S, Birmingham, AL 35206
$399
Cash flow
15.4%
Cash-on-Cash Return
9.8%
Cap rate
1.2%
Rent to Value Ratio
Active
$650,000
5
bds
|
0
ba
|
3,330
sqft
|
built
1921
1025 28th Pl S, Birmingham, AL 35205
$-909
Cash flow
-7.3%
Cash-on-Cash Return
4.6%
Cap rate
0.6%
Rent to Value Ratio
Active
$369,000
2
bds
|
0
ba
|
1,444
sqft
|
built
1937
1914 3rd Ave N, Birmingham, AL 35203
$-736
Cash flow
-10.4%
Cash-on-Cash Return
3.9%
Cap rate
0.8%
Rent to Value Ratio
Active
$75,000
2
bds
|
0
ba
|
1,364
sqft
|
built
1950
3110 31st Ave N, Birmingham, AL 35207
$229
Cash flow
15.9%
Cash-on-Cash Return
9.9%
Cap rate
1.2%
Rent to Value Ratio
Active
$135,000
3
bds
|
0
ba
|
1,368
sqft
|
built
1953
521 Grant St, Birmingham, AL 35228
$330
Cash flow
12.8%
Cash-on-Cash Return
9.2%
Cap rate
1.1%
Rent to Value Ratio
Active
$250,000
5
bds
|
0
ba
|
4,366
sqft
|
built
1900
2335 10th Ave S, Birmingham, AL 35205
$-546
Cash flow
-11.4%
Cash-on-Cash Return
3.6%
Cap rate
0.4%
Rent to Value Ratio
Active
$1,252,000
6
bds
|
0
ba
|
6,800
sqft
|
built
2005
1304 Cove Lake Cir, Birmingham, AL 35242
$-2,816
Cash flow
-11.7%
Cash-on-Cash Return
3.6%
Cap rate
0.4%
Rent to Value Ratio
Active
$299,000
3
bds
|
0
ba
|
1,800
sqft
|
built
1980
2227 Harris Wright Dr, Birmingham, AL 35242
$647
Cash flow
11.3%
Cash-on-Cash Return
8.9%
Cap rate
1.1%
Rent to Value Ratio
Active
$141,900
3
bds
|
0
ba
|
1,500
sqft
|
built
1955
2642 21st Street Ensley, Birmingham, AL 35208
$156
Cash flow
5.7%
Cash-on-Cash Return
7.6%
Cap rate
0.9%
Rent to Value Ratio
Active
$19,500
2
bds
|
0
ba
|
1,062
sqft
|
built
1940
1625 Pine Ave SW, Birmingham, AL 35211
$621
Cash flow
37.1%
Cash-on-Cash Return
38.2%
Cap rate
4.6%
Rent to Value Ratio