Birmingham, AL Investment Properties for Sale
Browse homes for sale and investment properties in Birmingham, AL. Refine your search by price, property type, or more.
Best cash flowing properties in Birmingham, AL
Active
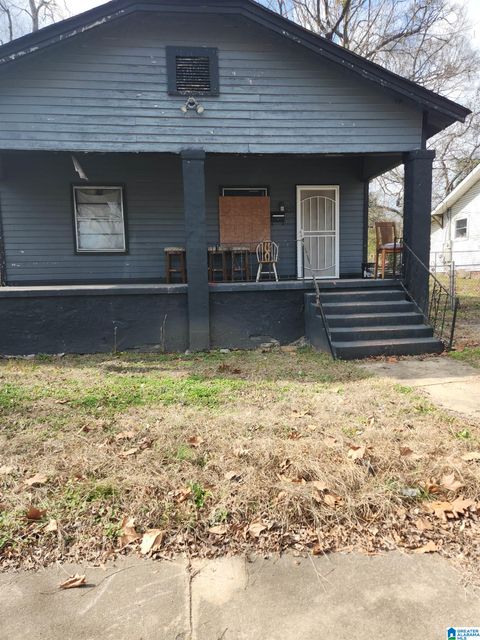
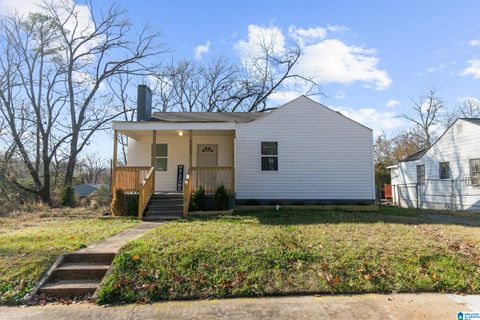
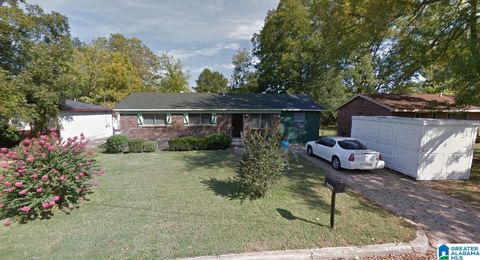
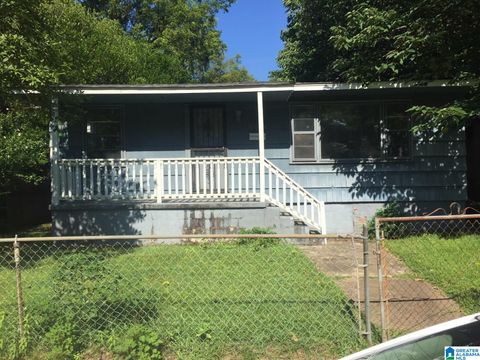
$55,000
3
bds
|
0
ba
|
1,386
sqft
|
built
1930
1222 Frisco St, Birmingham, AL 35224
$690
Cash flow
14.6%
Cash-on-Cash Return
15.1%
Cap rate
1.8%
Rent to Value Ratio
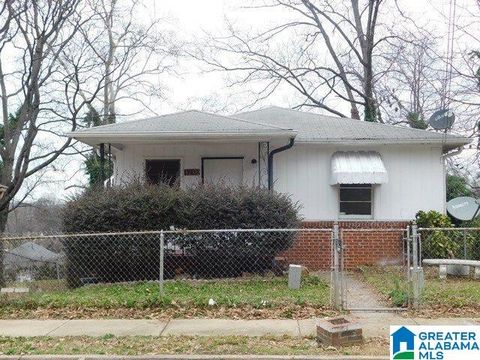
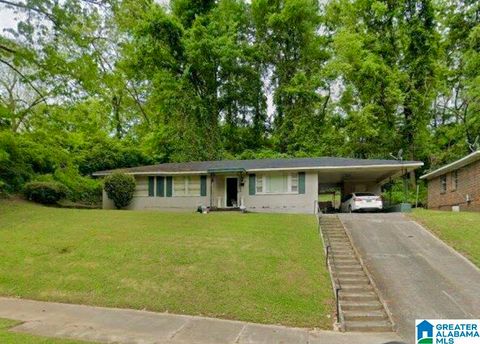
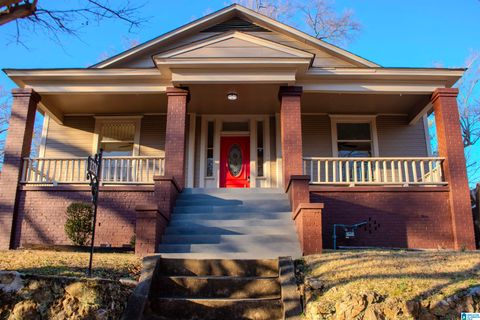
Active
$69,500
2
bds
|
0
ba
|
768
sqft
|
built
1952
1909 Druid Hill Dr, Birmingham, AL 35234
$690
Cash flow
11.6%
Cash-on-Cash Return
11.9%
Cap rate
1.4%
Rent to Value Ratio
822 out of 940 properties for sale in Birmingham, AL
Limited Results Shown
Create a free account, or log in to reveal all property listings and enjoy the complete experience.
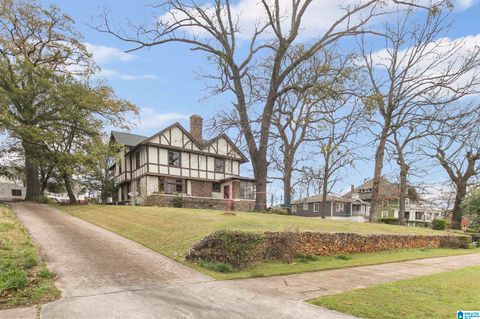
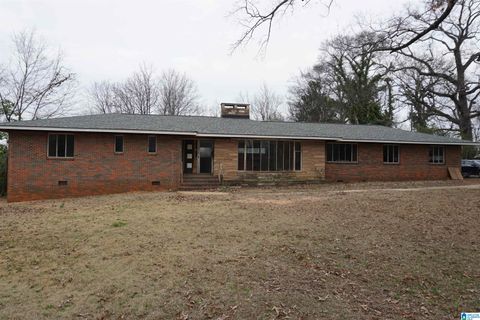
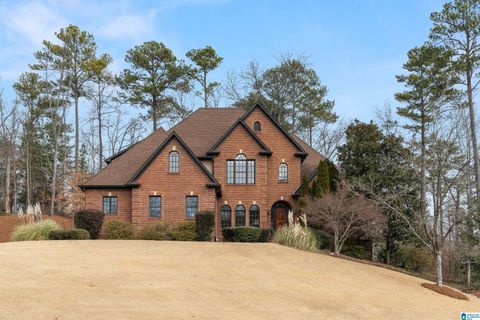
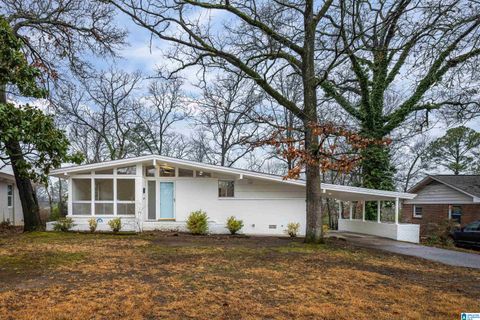
Active
$365,000
4
bds
|
0
ba
|
3,266
sqft
|
built
1910
410 9th Ct W, Birmingham, AL 35204
$-181
Cash flow
-2.6%
Cash-on-Cash Return
5.7%
Cap rate
0.7%
Rent to Value Ratio

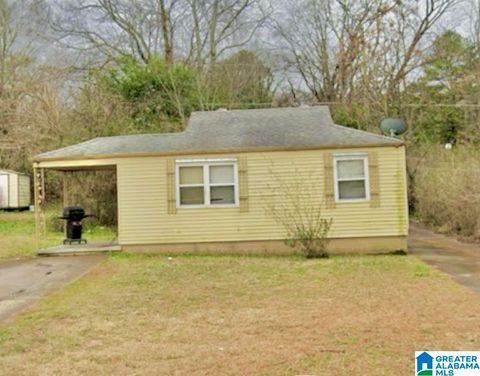
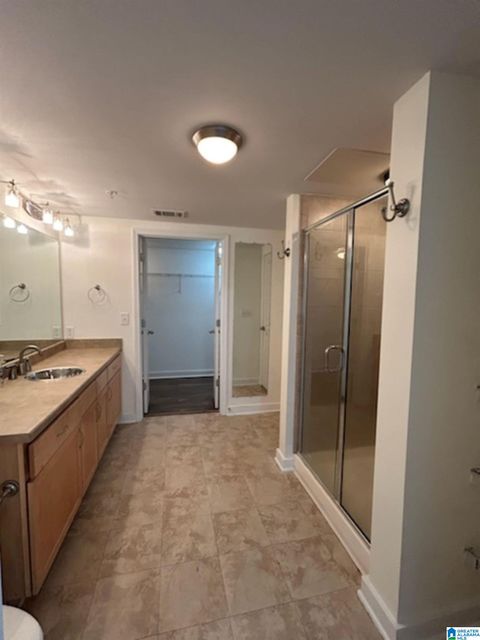
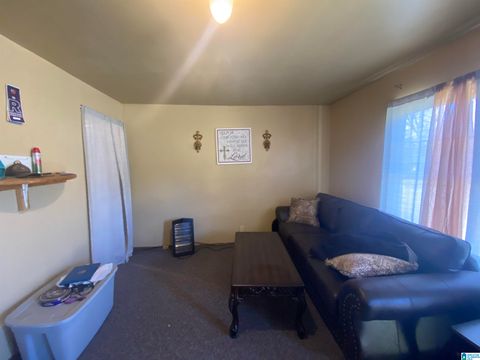
Active
$129,900
1
bds
|
0
ba
|
810
sqft
|
built
1944
1731 Valley Ave, Birmingham, AL 35209
$-344
Cash flow
-13.8%
Cash-on-Cash Return
3.1%
Cap rate
0.8%
Rent to Value Ratio

Active
$2,650,000
7
bds
|
0
ba
|
13,142
sqft
|
built
2012
2628 Wenonah Oxmoor Rd, Birmingham, AL 35211
$-11,075
Cash flow
-21.8%
Cash-on-Cash Return
1.2%
Cap rate
0.2%
Rent to Value Ratio
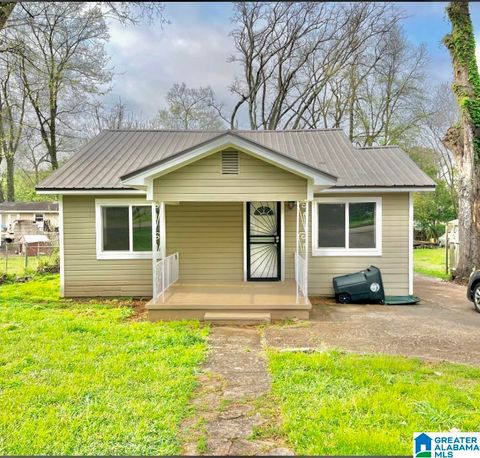
Active
$79,900
3
bds
|
0
ba
|
1,000
sqft
|
built
1950
1845 Henry Crumpton Dr, Birmingham, AL 35211
$273
Cash flow
17.8%
Cash-on-Cash Return
10.4%
Cap rate
1.3%
Rent to Value Ratio
Active
$115,000
2
bds
|
0
ba
|
890
sqft
|
built
1948
7224 Queenstown Ave, Birmingham, AL 35206
$159
Cash flow
7.2%
Cash-on-Cash Return
7.9%
Cap rate
1.0%
Rent to Value Ratio
Active
$129,500
3
bds
|
0
ba
|
2,064
sqft
|
built
1955
728 Bessemer Rd, Birmingham, AL 35228
$428
Cash flow
17.2%
Cash-on-Cash Return
10.2%
Cap rate
1.2%
Rent to Value Ratio
Active
$210,000
1
bds
|
0
ba
|
770
sqft
|
built
2007
2020 5th Ave S, Birmingham, AL 35233
$-488
Cash flow
-12.1%
Cash-on-Cash Return
3.5%
Cap rate
0.8%
Rent to Value Ratio
Active
$79,900
3
bds
|
0
ba
|
1,100
sqft
|
built
1955
3321 Cedar Ave SW, Birmingham, AL 35221
$342
Cash flow
22.3%
Cash-on-Cash Return
11.4%
Cap rate
1.4%
Rent to Value Ratio
Active
$650,000
4
bds
|
0
ba
|
1,682
sqft
|
built
1950
4630 Old Looney Mill Rd, Birmingham, AL 35243
$-1,254
Cash flow
-10.1%
Cash-on-Cash Return
3.9%
Cap rate
0.5%
Rent to Value Ratio
Active
$24,900
2
bds
|
0
ba
|
720
sqft
|
built
1951
560 Antwerp Ave, Birmingham, AL 35212
$621
Cash flow
29.1%
Cash-on-Cash Return
29.9%
Cap rate
3.6%
Rent to Value Ratio
Active
$188,500
3
bds
|
0
ba
|
1,100
sqft
|
built
1940
4336 2nd Ave S, Birmingham, AL 35222
$-18
Cash flow
-0.5%
Cash-on-Cash Return
6.1%
Cap rate
0.7%
Rent to Value Ratio
Active
$122,500
3
bds
|
0
ba
|
1,195
sqft
|
built
1954
833 79th St S, Birmingham, AL 35206
$257
Cash flow
10.9%
Cash-on-Cash Return
8.8%
Cap rate
1.1%
Rent to Value Ratio
Active
$239,330
3
bds
|
0
ba
|
1,680
sqft
|
built
1930
1614 29th St N, Birmingham, AL 35234
$-7
Cash flow
-0.2%
Cash-on-Cash Return
6.2%
Cap rate
0.8%
Rent to Value Ratio
Active
$139,000
2
bds
|
0
ba
|
792
sqft
|
built
1950
633 62nd St S, Birmingham, AL 35212
$33
Cash flow
1.2%
Cash-on-Cash Return
6.6%
Cap rate
0.8%
Rent to Value Ratio
Active
$149,000
2
bds
|
0
ba
|
880
sqft
|
built
1955
6832 6th Ct S, Birmingham, AL 35212
$50
Cash flow
1.8%
Cash-on-Cash Return
6.7%
Cap rate
0.8%
Rent to Value Ratio
Active
$569,000
6
bds
|
0
ba
|
2,970
sqft
|
built
1979
3035 Ritha Cir, Birmingham, AL 35242
$-763
Cash flow
-7.0%
Cash-on-Cash Return
4.7%
Cap rate
0.6%
Rent to Value Ratio
Active
$95,000
3
bds
|
0
ba
|
1,286
sqft
|
built
1970
3212 Lee Ct SW, Birmingham, AL 35221
$194
Cash flow
10.7%
Cash-on-Cash Return
8.7%
Cap rate
1.1%
Rent to Value Ratio

Active
$129,900
5
bds
|
0
ba
|
2,394
sqft
|
built
1949
1072 Linthicum St, Birmingham, AL 35217
$288
Cash flow
11.6%
Cash-on-Cash Return
8.9%
Cap rate
1.1%
Rent to Value Ratio
Active
$974,900
6
bds
|
0
ba
|
4,866
sqft
|
built
2003
1061 Greystone Cove Dr, Birmingham, AL 35242
$-1,721
Cash flow
-9.2%
Cash-on-Cash Return
4.1%
Cap rate
0.5%
Rent to Value Ratio
Active
$84,900
3
bds
|
0
ba
|
1,215
sqft
|
built
1957
1120 Birmingham St, Birmingham, AL 35217
$316
Cash flow
19.4%
Cash-on-Cash Return
10.7%
Cap rate
1.3%
Rent to Value Ratio
Active
$59,900
2
bds
|
0
ba
|
768
sqft
|
built
1948
817 2nd St W, Birmingham, AL 35204
$621
Cash flow
12.1%
Cash-on-Cash Return
12.4%
Cap rate
1.5%
Rent to Value Ratio
Active
$699,000
4
bds
|
0
ba
|
4,422
sqft
|
built
1995
4046 Milners Cres, Birmingham, AL 35242
$-895
Cash flow
-6.7%
Cash-on-Cash Return
4.7%
Cap rate
0.6%
Rent to Value Ratio
Active
$290,000
3
bds
|
0
ba
|
1,627
sqft
|
built
1993
6113 Russet Meadows Cir, Birmingham, AL 35244
$-279
Cash flow
-5.0%
Cash-on-Cash Return
5.1%
Cap rate
0.6%
Rent to Value Ratio
Active
$399,900
2
bds
|
0
ba
|
1,444
sqft
|
built
1937
1914 3rd Ave N, Birmingham, AL 35203
$-829
Cash flow
-10.8%
Cash-on-Cash Return
3.8%
Cap rate
0.7%
Rent to Value Ratio
Active
$104,900
3
bds
|
0
ba
|
1,105
sqft
|
built
1955
1016 Belle Meade Dr, Birmingham, AL 35235
$211
Cash flow
10.5%
Cash-on-Cash Return
8.7%
Cap rate
1.0%
Rent to Value Ratio

Active
$239,000
4
bds
|
0
ba
|
2,026
sqft
|
built
1973
2015 Carraway Ln, Birmingham, AL 35235
$132
Cash flow
2.9%
Cash-on-Cash Return
6.9%
Cap rate
0.8%
Rent to Value Ratio
Active
$134,995
3
bds
|
0
ba
|
1,130
sqft
|
built
1954
736 Meadowbrook Dr, Birmingham, AL 35215
$-15
Cash flow
-0.6%
Cash-on-Cash Return
6.1%
Cap rate
0.7%
Rent to Value Ratio
Active
$95,000
3
bds
|
0
ba
|
1,170
sqft
|
built
1930
320 Old Pine Hill Rd, Birmingham, AL 35217
$194
Cash flow
10.7%
Cash-on-Cash Return
8.7%
Cap rate
1.1%
Rent to Value Ratio
Active
$599,000
2
bds
|
0
ba
|
2,394
sqft
|
built
1981
2716 Hanover Cir S, Birmingham, AL 35205
$-1,587
Cash flow
-13.8%
Cash-on-Cash Return
3.1%
Cap rate
0.6%
Rent to Value Ratio
Active
$750,000
5
bds
|
0
ba
|
4,770
sqft
|
built
2003
1027 Williams Trce, Birmingham, AL 35242
$-1,184
Cash flow
-8.2%
Cash-on-Cash Return
4.4%
Cap rate
0.5%
Rent to Value Ratio
Active
$210,000
3
bds
|
0
ba
|
1,727
sqft
|
built
1965
1337 Pratt Hwy, Birmingham, AL 35214
$284
Cash flow
7.1%
Cash-on-Cash Return
7.9%
Cap rate
1.0%
Rent to Value Ratio

Active
$735,000
3
bds
|
0
ba
|
2,576
sqft
|
built
1915
4011 Clairmont Ave S, Birmingham, AL 35222
$-1,422
Cash flow
-10.1%
Cash-on-Cash Return
3.9%
Cap rate
0.5%
Rent to Value Ratio
Active
$75,000
3
bds
|
0
ba
|
1,376
sqft
|
built
1948
1312 Gulfport St, Birmingham, AL 35224
$367
Cash flow
25.5%
Cash-on-Cash Return
12.1%
Cap rate
1.5%
Rent to Value Ratio
Active
$229,900
3
bds
|
0
ba
|
3,014
sqft
|
built
1930
1324 4th Ave W, Birmingham, AL 35208
$-27
Cash flow
-0.6%
Cash-on-Cash Return
6.1%
Cap rate
0.7%
Rent to Value Ratio
Active
$369,900
3
bds
|
0
ba
|
1,504
sqft
|
built
1956
1036 53rd St S, Birmingham, AL 35222
$-206
Cash flow
-2.9%
Cash-on-Cash Return
5.6%
Cap rate
0.7%
Rent to Value Ratio

Active
$139,500
3
bds
|
0
ba
|
1,870
sqft
|
built
1930
716 8th Ct W, Birmingham, AL 35204
$238
Cash flow
8.9%
Cash-on-Cash Return
8.3%
Cap rate
1.0%
Rent to Value Ratio
Active
$599,900
4
bds
|
0
ba
|
4,576
sqft
|
built
1996
739 47th St S, Birmingham, AL 35222
$-648
Cash flow
-5.6%
Cash-on-Cash Return
5.0%
Cap rate
0.6%
Rent to Value Ratio
Active
$84,900
4
bds
|
0
ba
|
1,256
sqft
|
built
1954
1708 58th St W, Birmingham, AL 35228
$316
Cash flow
19.4%
Cash-on-Cash Return
10.7%
Cap rate
1.3%
Rent to Value Ratio