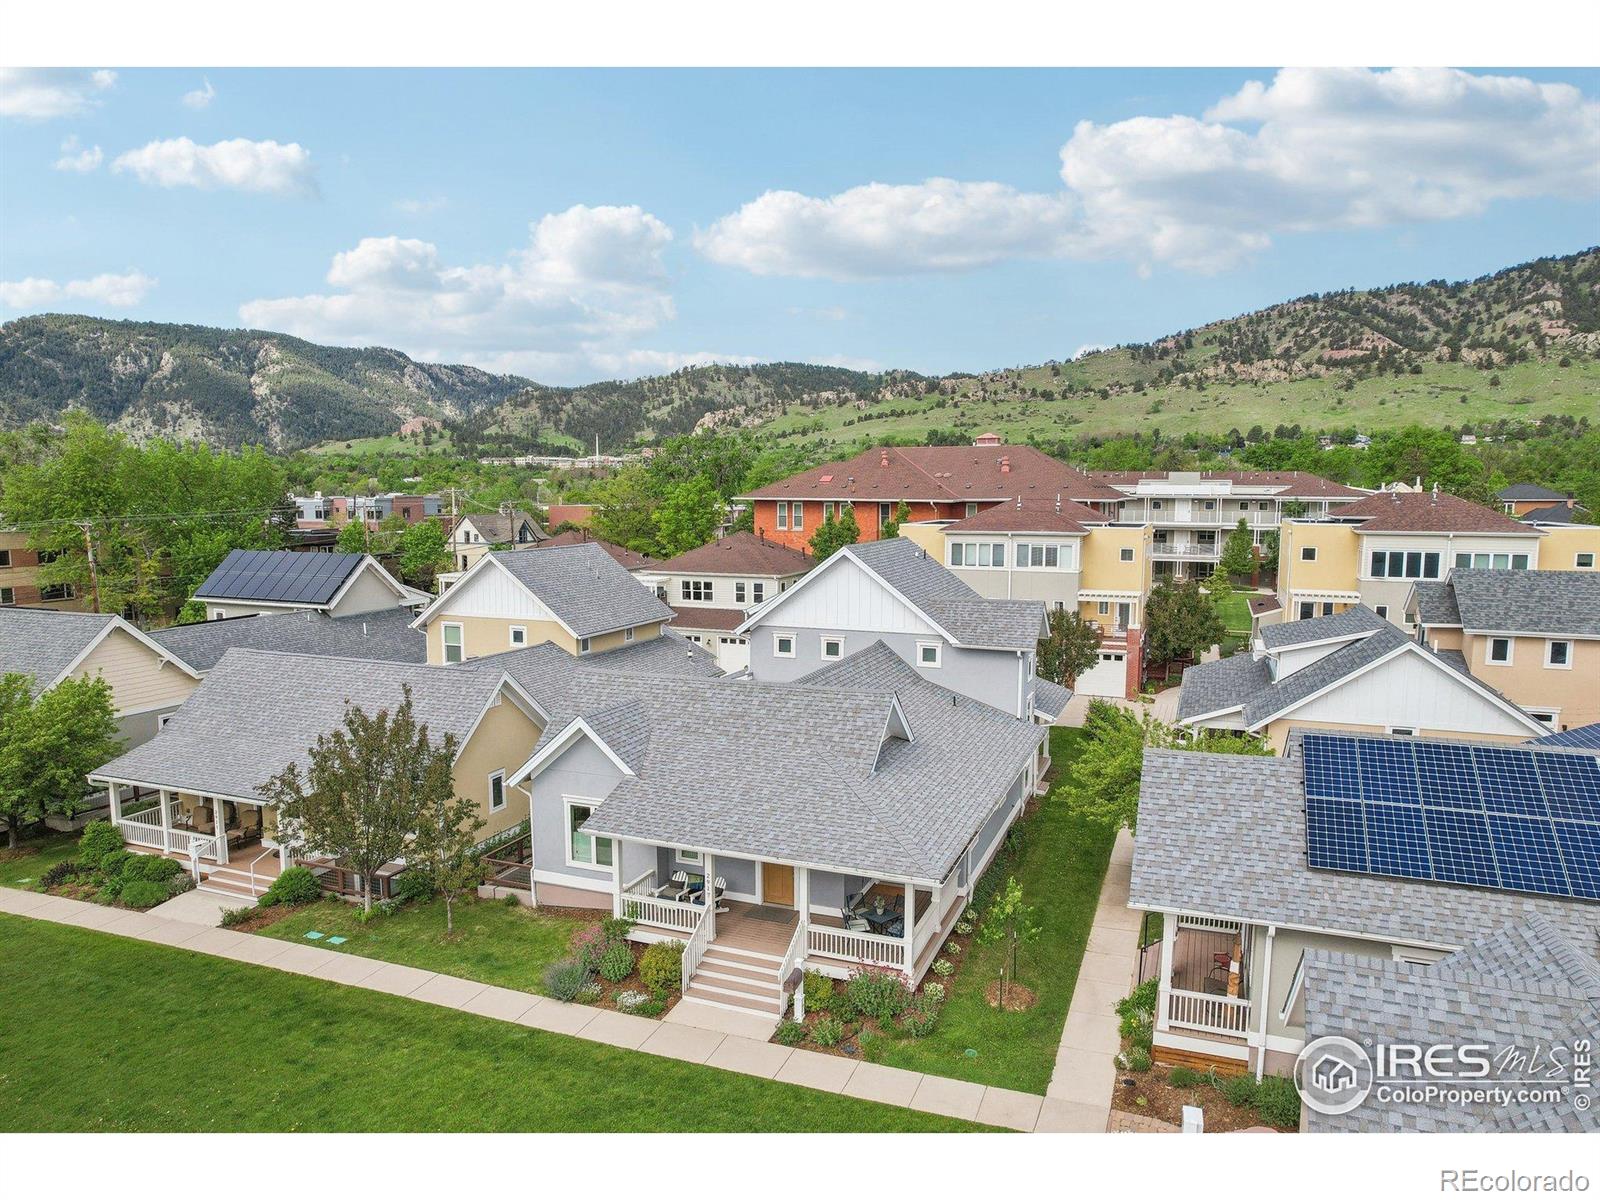
Boulder, CO Investment Properties for Sale
Browse homes for sale and investment properties in Boulder, CO. Refine your search by price, property type, or more.
Best cash flowing properties in Boulder, CO
Active
$299,000
2
bds
|
1
ba
|
792
sqft
|
built
1972
2707 Valmont Rd, Boulder, CO 80304
$-717
Cash flow
-12.5%
Cash-on-Cash Return
3.4%
Cap rate
0.7%
Rent to Value Ratio
Active
$354,900
2
bds
|
2
ba
|
961
sqft
|
built
1994
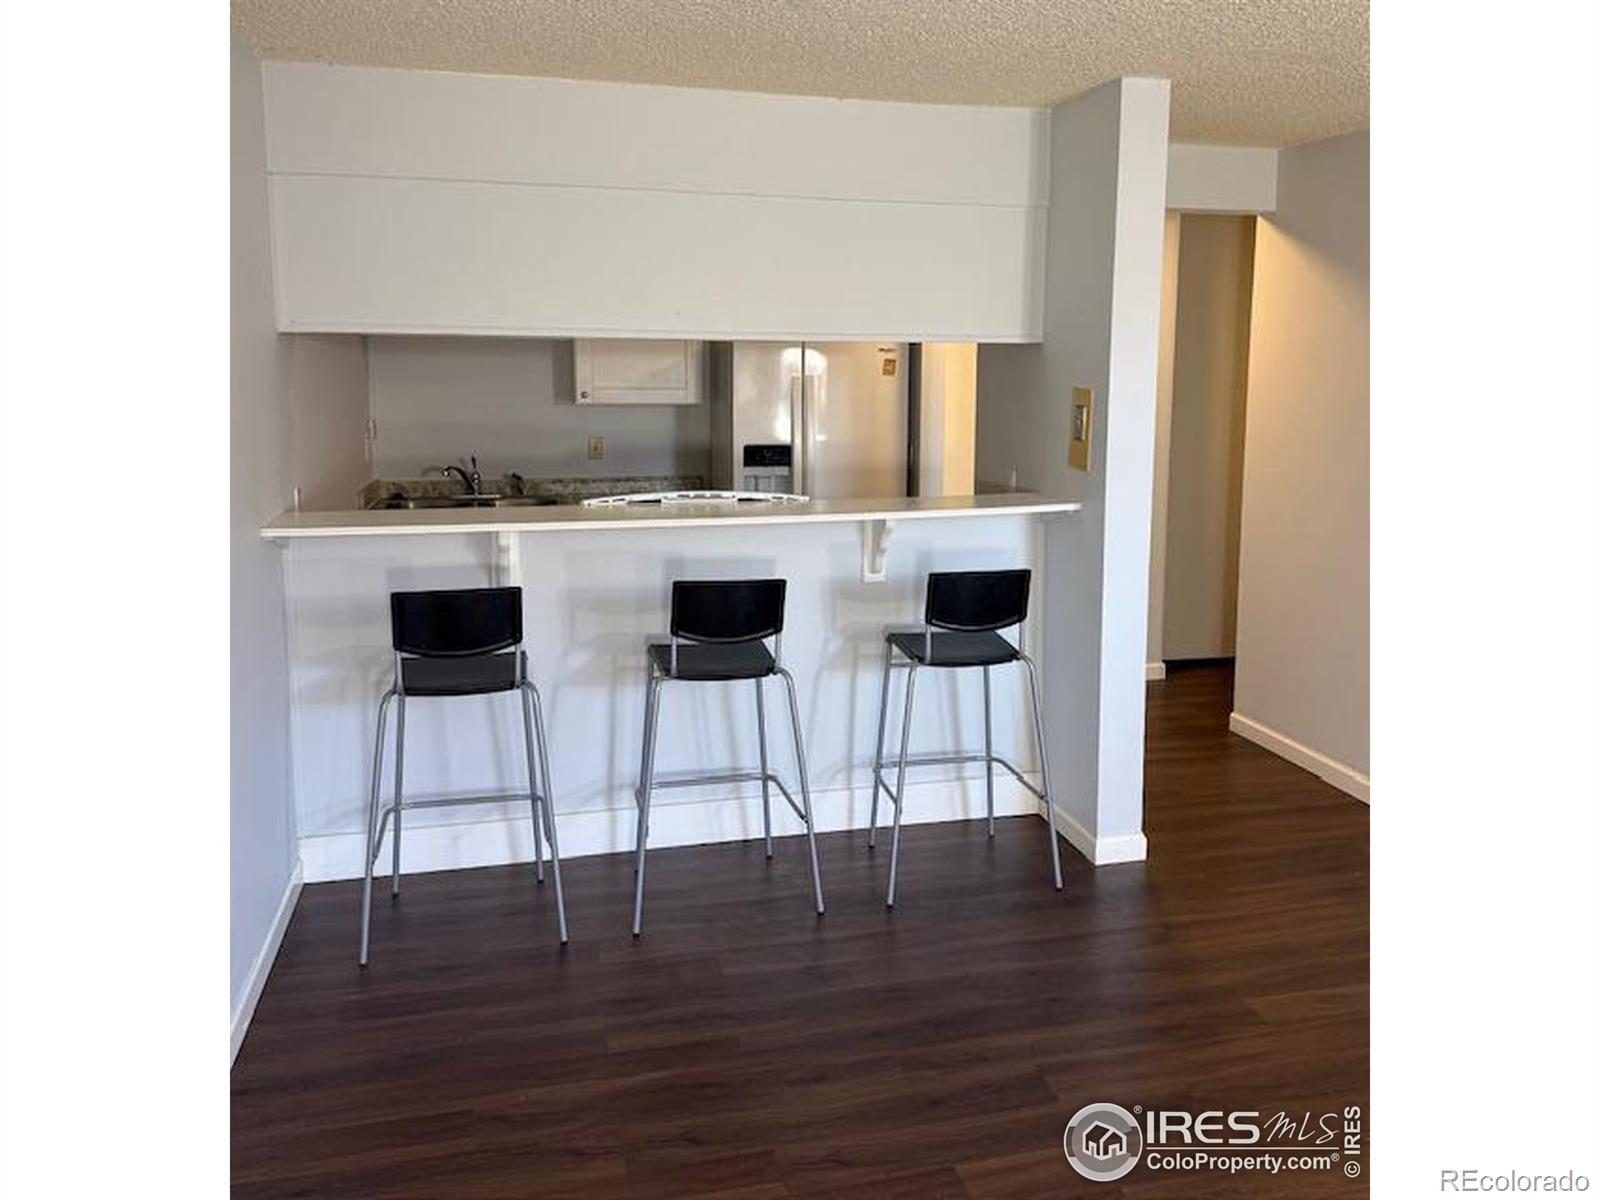
4840 Twin Lakes Rd, Boulder, CO 80301
$-960
Cash flow
-14.1%
Cash-on-Cash Return
3.0%
Cap rate
0.6%
Rent to Value Ratio
589 out of 640 properties for sale in Boulder, CO
Limited Results Shown
Create a free account, or log in to reveal all property listings and enjoy the complete experience.
Active
$299,000
2
bds
|
1
ba
|
792
sqft
|
built
1972
2707 Valmont Rd, Boulder, CO 80304
$-717
Cash flow
-12.5%
Cash-on-Cash Return
3.4%
Cap rate
0.7%
Rent to Value Ratio

Active
$1,000,000
3
bds
|
2
ba
|
1,952
sqft
|
built
1995
14800 Gold Hill Rd, Boulder, CO 80302
$-2,854
Cash flow
-14.9%
Cash-on-Cash Return
2.9%
Cap rate
0.4%
Rent to Value Ratio
Active
$2,600,000
3
bds
|
4
ba
|
5,530
sqft
|
built
1995
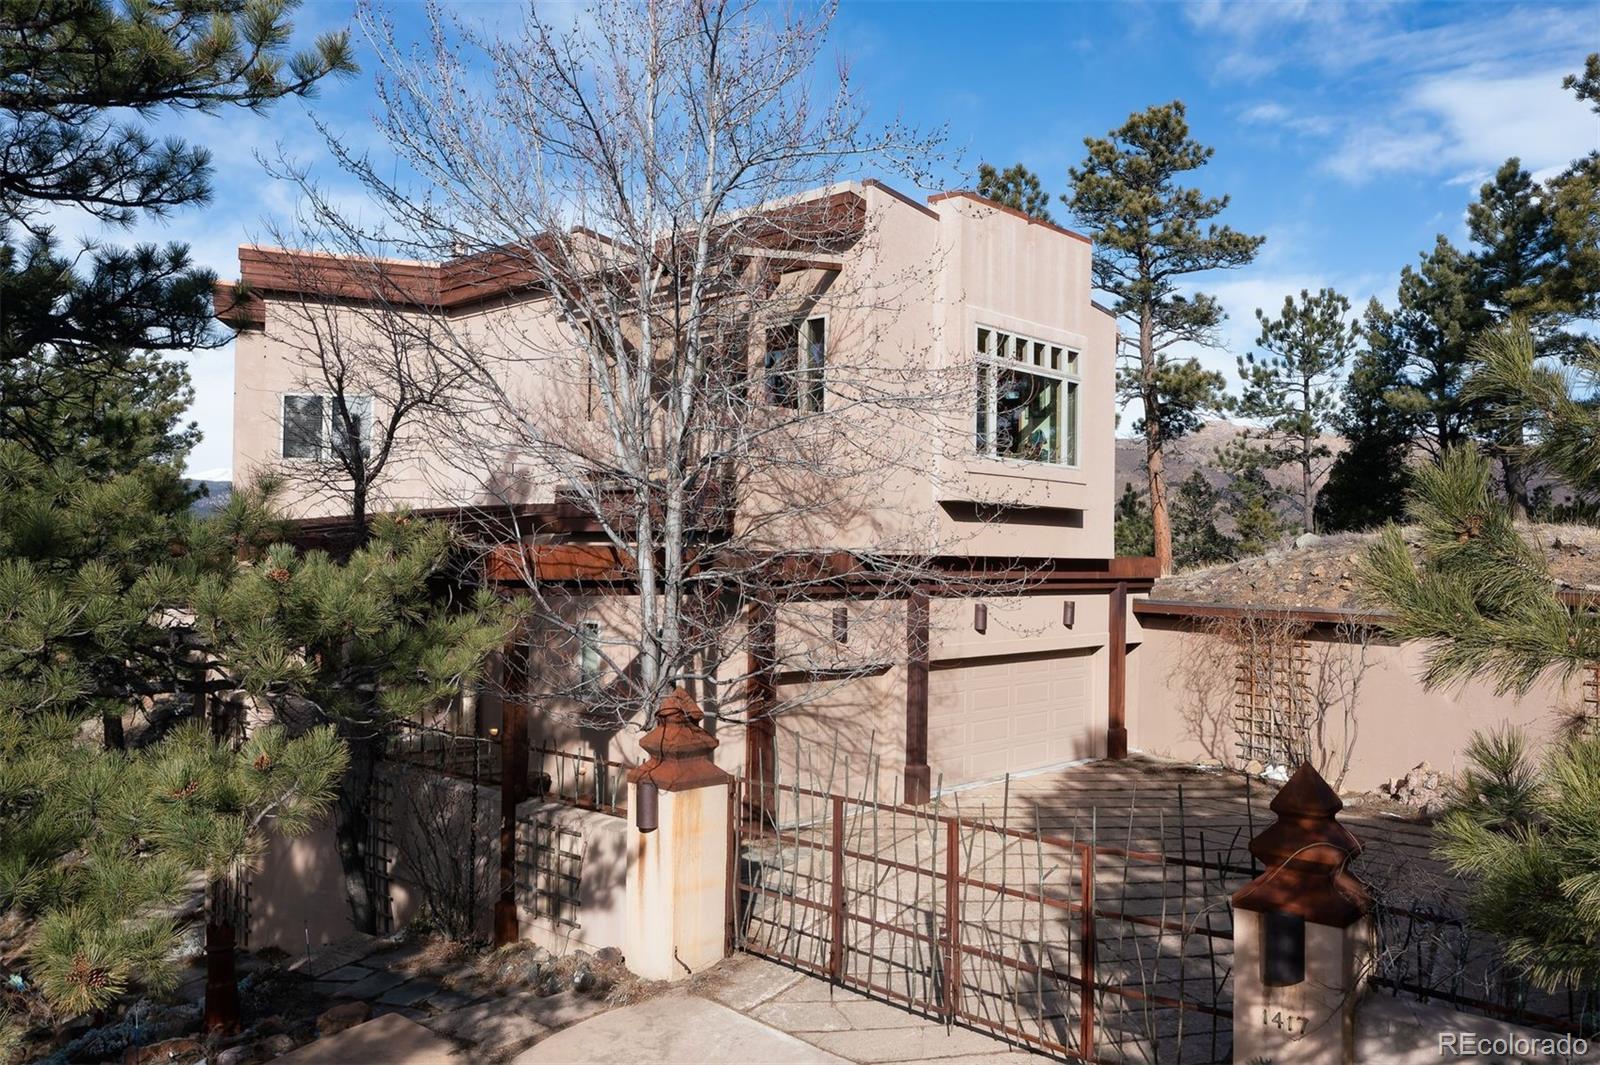
1417 Rembrandt Rd, Boulder, CO 80302
$-9,811
Cash flow
-19.7%
Cash-on-Cash Return
1.8%
Cap rate
0.3%
Rent to Value Ratio
Active
$1,150,000
6
bds
|
4
ba
|
3,352
sqft
|
built
1995
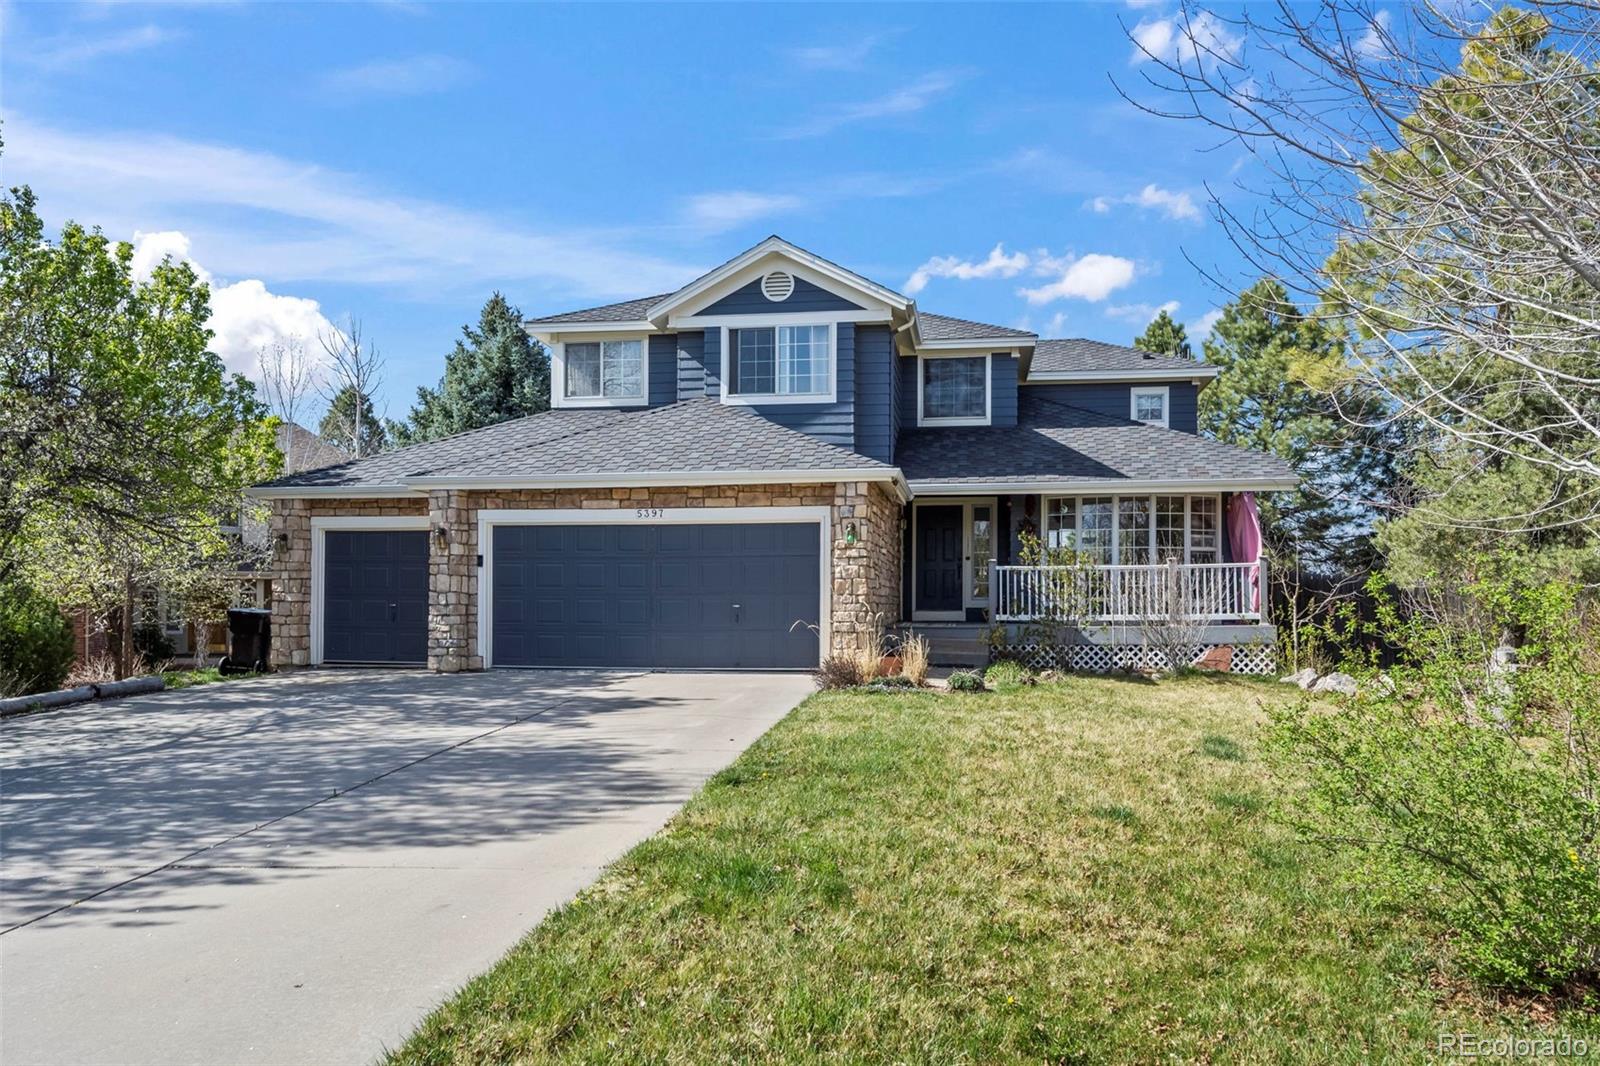
5397 Wild Dunes Ct, Boulder, CO 80301
$-3,865
Cash flow
-17.5%
Cash-on-Cash Return
2.3%
Cap rate
0.3%
Rent to Value Ratio
Active
$499,000
2
bds
|
2
ba
|
1,032
sqft
|
built
1984
3076 Fulton Cir, Boulder, CO 80301
$-1,448
Cash flow
-15.1%
Cash-on-Cash Return
2.8%
Cap rate
0.5%
Rent to Value Ratio
Active
$385,000
2
bds
|
2
ba
|
961
sqft
|
built
1988
4935 Twin Lakes Rd, Boulder, CO 80301
$-1,219
Cash flow
-16.5%
Cash-on-Cash Return
2.5%
Cap rate
0.6%
Rent to Value Ratio
Active
$915,000
3
bds
|
4
ba
|
2,031
sqft
|
built
2010
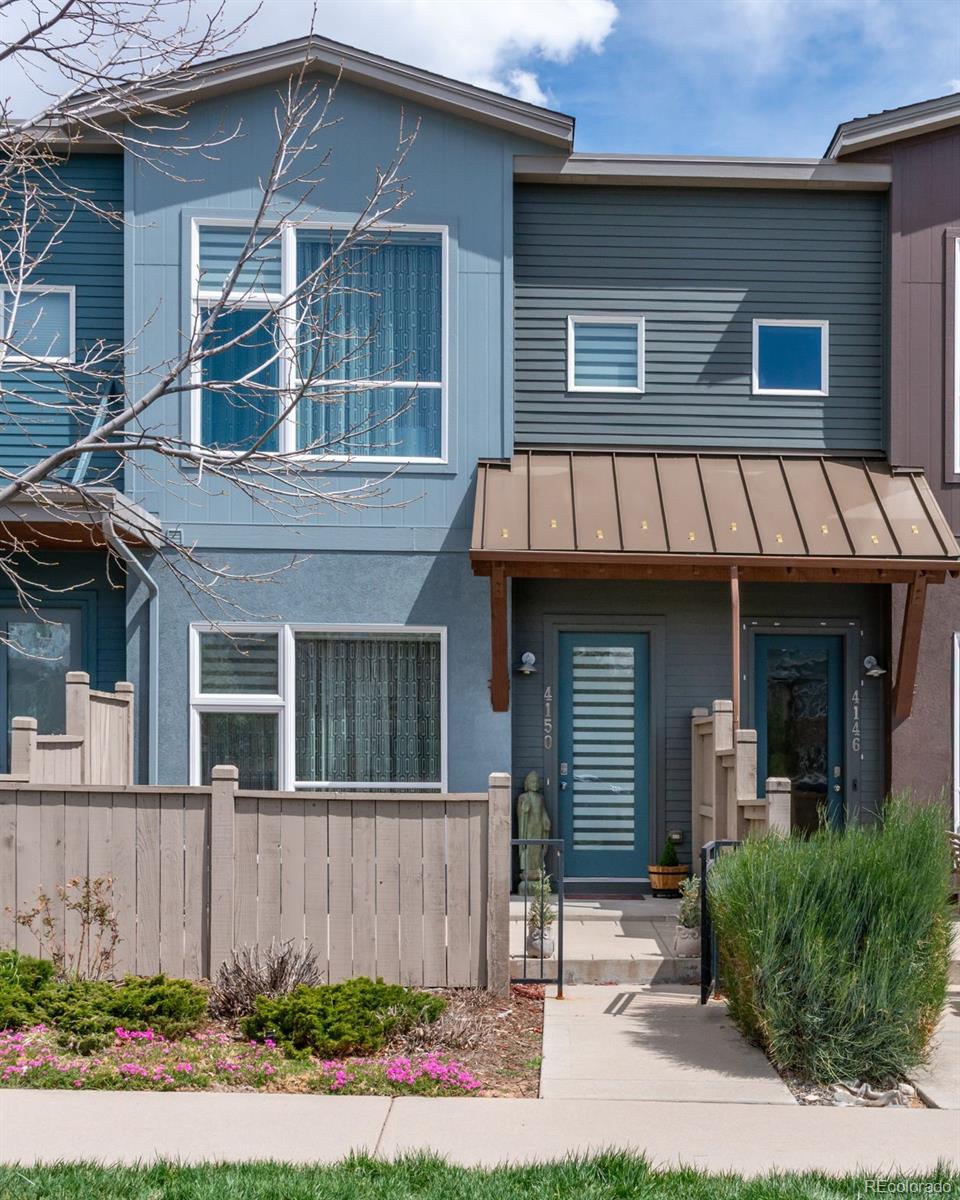
4150 Longview Ln, Boulder, CO 80301
$-3,211
Cash flow
-18.3%
Cash-on-Cash Return
2.1%
Cap rate
0.4%
Rent to Value Ratio
Active
$14,250,000
7
bds
|
6
ba
|
5,926
sqft
|
built
2015
228 Lion Pt, Boulder, CO 80302
$-69,279
Cash flow
-25.4%
Cash-on-Cash Return
0.5%
Cap rate
0.1%
Rent to Value Ratio

$1,000,300
BiggerPockets Estimate
Our estimate offers a data-driven snapshot of this property’s current market value, using available information about the home and local trends.
BiggerPockets estimate
BiggerPockets Estimate
Our estimate offers a data-driven snapshot of this property’s current market value, using available information about the home and local trends.
BiggerPockets estimate
4
bds
|
2.5
ba
|
1,955
sqft
|
built
1968
4705 Chatham St, Boulder, CO 80301
$-3,027
Cash flow
-15.8%
Cash-on-Cash Return
2.7%
Cap rate
0.4%
Rent to Value Ratio
Active
$975,000
2
bds
|
2
ba
|
953
sqft
|
built
2014
1707 Walnut St, Boulder, CO 80302
$-3,548
Cash flow
-19.0%
Cash-on-Cash Return
1.9%
Cap rate
0.3%
Rent to Value Ratio
Active
$1,495,000
3
bds
|
3
ba
|
2,442
sqft
|
built
1978
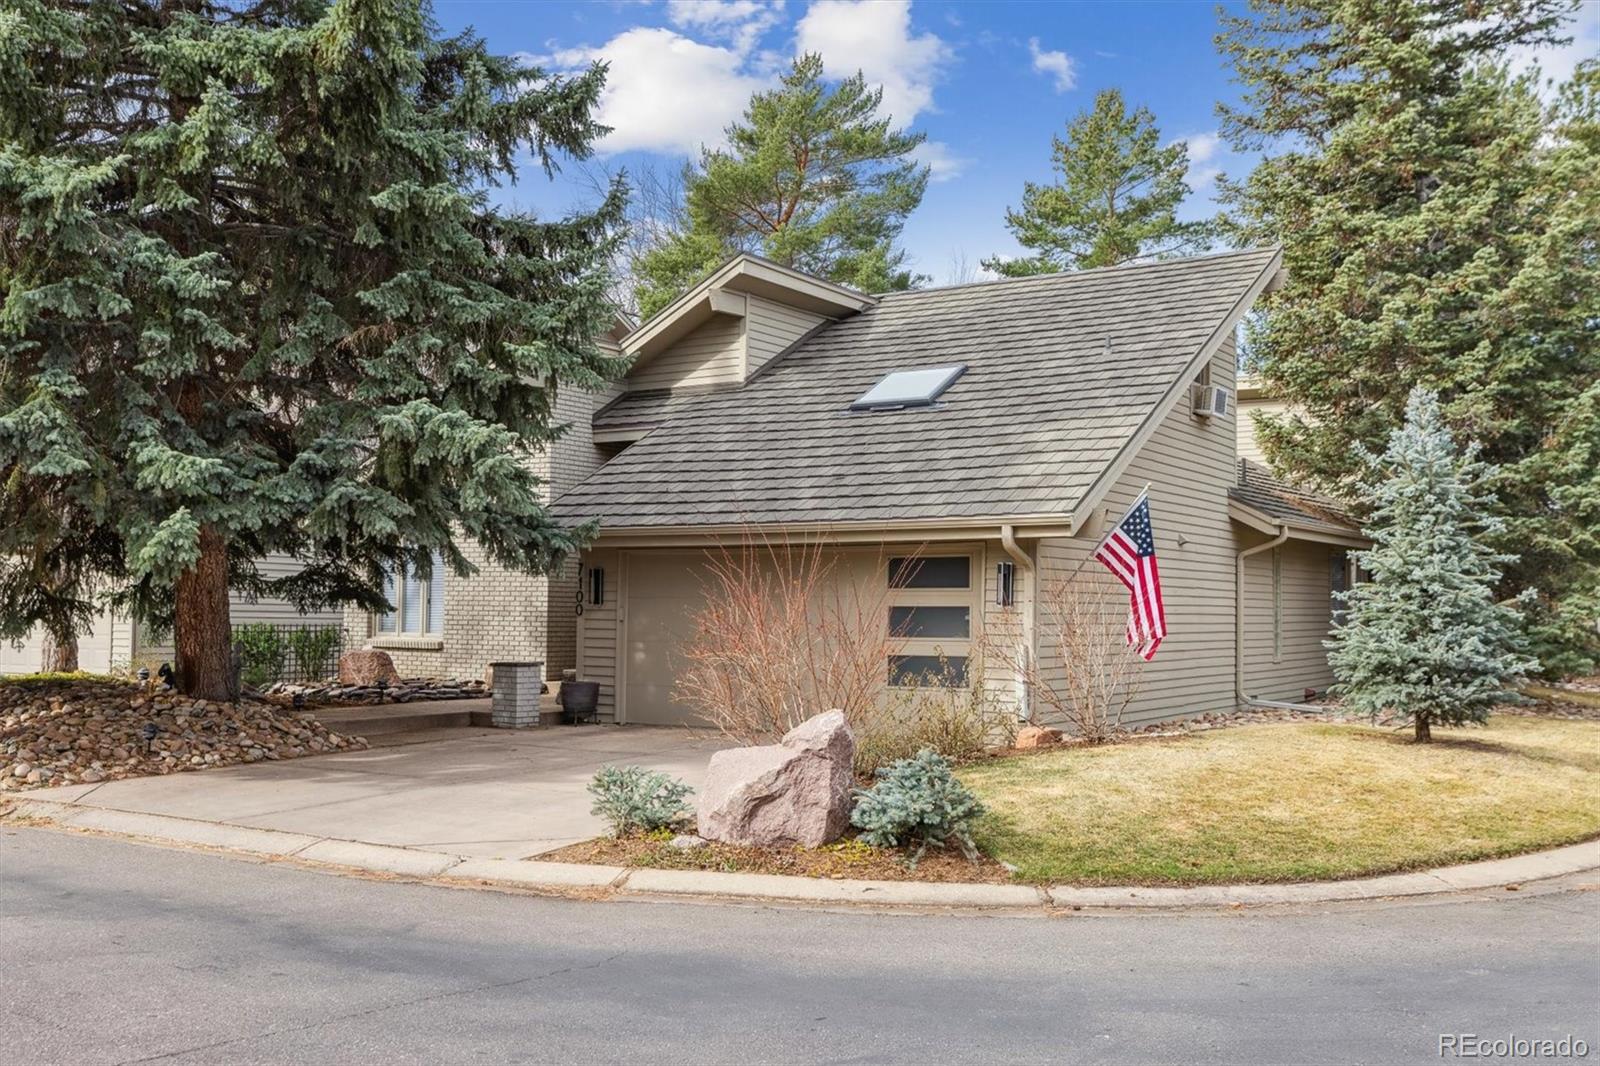
7100 Cedarwood Cir, Boulder, CO 80301
$-5,750
Cash flow
-20.1%
Cash-on-Cash Return
1.7%
Cap rate
0.3%
Rent to Value Ratio
Active
$3,180,000
5
bds
|
4
ba
|
5,053
sqft
|
built
1917
851 14th St, Boulder, CO 80302
$-12,996
Cash flow
-21.3%
Cash-on-Cash Return
1.4%
Cap rate
0.2%
Rent to Value Ratio
Active
$475,000
1
bds
|
1
ba
|
1,076
sqft
|
built
1981
4475 Laguna Pl, Boulder, CO 80303
$-1,703
Cash flow
-18.7%
Cash-on-Cash Return
2.0%
Cap rate
0.5%
Rent to Value Ratio
Active
$2,070,000
5
bds
|
4
ba
|
4,899
sqft
|
built
1987
2672 Winding Trail Dr, Boulder, CO 80304
$-8,003
Cash flow
-20.2%
Cash-on-Cash Return
1.6%
Cap rate
0.3%
Rent to Value Ratio
Active
$2,450,000
3
bds
|
5
ba
|
3,064
sqft
|
built
1988
1521 Mapleton Ave, Boulder, CO 80304
$-9,099
Cash flow
-19.4%
Cash-on-Cash Return
1.8%
Cap rate
0.3%
Rent to Value Ratio

Active
$2,700,000
4
bds
|
3
ba
|
3,050
sqft
|
built
1965
1035 Rosehill Dr, Boulder, CO 80302
$-11,083
Cash flow
-21.4%
Cash-on-Cash Return
1.4%
Cap rate
0.2%
Rent to Value Ratio
Active
$2,200,000
3
bds
|
1
ba
|
1,080
sqft
|
built
1959
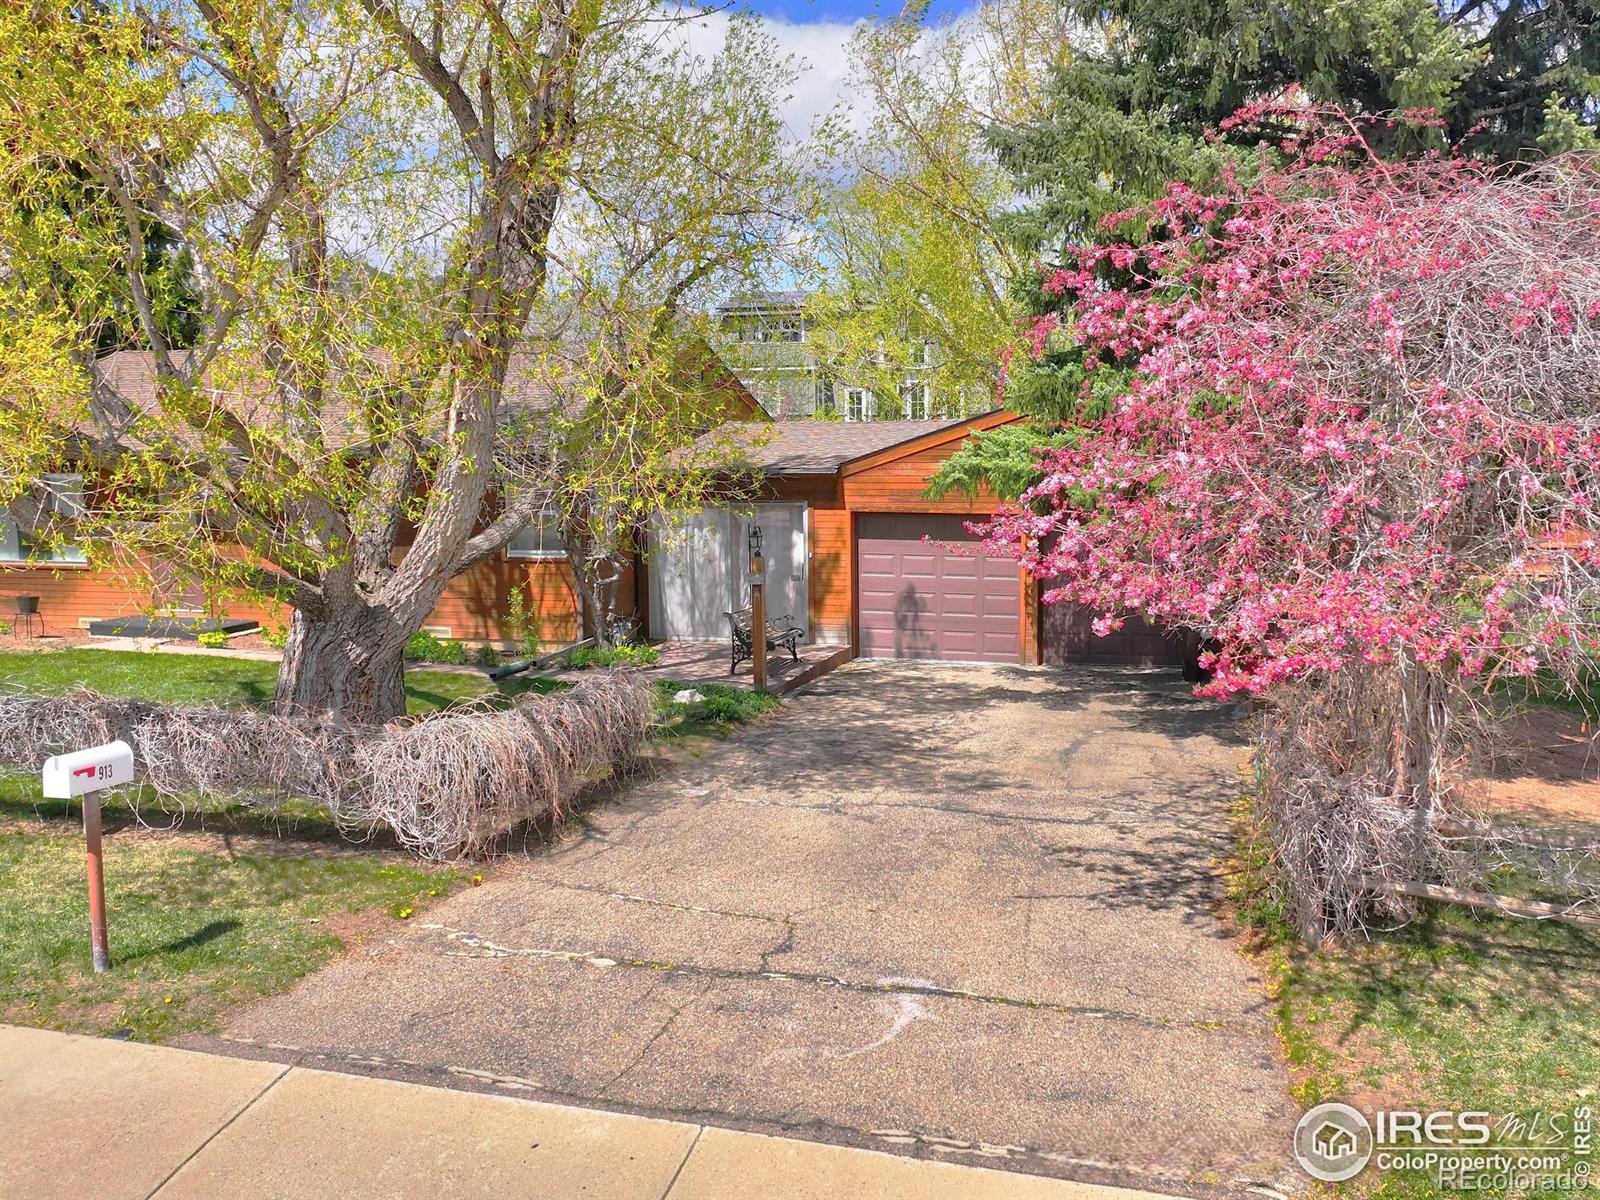
913 Utica Ave, Boulder, CO 80304
$-9,657
Cash flow
-22.9%
Cash-on-Cash Return
1.0%
Cap rate
0.2%
Rent to Value Ratio
Active
$1,198,000
1
bds
|
2
ba
|
1,538
sqft
|
built
2005
1360 Walnut St, Boulder, CO 80302
$-4,867
Cash flow
-21.2%
Cash-on-Cash Return
1.4%
Cap rate
0.3%
Rent to Value Ratio
Active
$1,695,000
4
bds
|
2
ba
|
1,781
sqft
|
built
1985
2255 18th St, Boulder, CO 80302
$-5,726
Cash flow
-17.6%
Cash-on-Cash Return
2.2%
Cap rate
0.3%
Rent to Value Ratio
Active
$487,450
2
bds
|
1
ba
|
816
sqft
|
built
1971
1111 Maxwell Ave, Boulder, CO 80304
$-2,000
Cash flow
-21.4%
Cash-on-Cash Return
1.4%
Cap rate
0.4%
Rent to Value Ratio
Active
$1,300,000
4
bds
|
4
ba
|
2,651
sqft
|
built
1995
93 Pine Needle Rd, Boulder, CO 80304
$-3,718
Cash flow
-14.9%
Cash-on-Cash Return
2.9%
Cap rate
0.4%
Rent to Value Ratio
Active
$4,195,000
4
bds
|
4
ba
|
4,367
sqft
|
built
1927
3059 6th St, Boulder, CO 80304
$-18,805
Cash flow
-23.4%
Cash-on-Cash Return
0.9%
Cap rate
0.2%
Rent to Value Ratio
Active
$550,000
2
bds
|
2
ba
|
1,357
sqft
|
built
1971
1850 Folsom St, Boulder, CO 80302
$-2,178
Cash flow
-20.7%
Cash-on-Cash Return
1.5%
Cap rate
0.6%
Rent to Value Ratio
Active
$2,690,000
5
bds
|
4
ba
|
3,448
sqft
|
built
1940
1516 Columbine Ave, Boulder, CO 80302
$-10,470
Cash flow
-20.3%
Cash-on-Cash Return
1.6%
Cap rate
0.3%
Rent to Value Ratio
Active
$3,500,000
3
bds
|
4
ba
|
4,066
sqft
|
built
2007
1380 Bluebell Ave, Boulder, CO 80302
$-15,161
Cash flow
-22.6%
Cash-on-Cash Return
1.1%
Cap rate
0.2%
Rent to Value Ratio
Active
$1,920,000
4
bds
|
3
ba
|
2,930
sqft
|
built
1925
3776 Orange Ln, Boulder, CO 80304
$-6,697
Cash flow
-18.2%
Cash-on-Cash Return
2.1%
Cap rate
0.3%
Rent to Value Ratio
Active
$3,250,000
4
bds
|
5
ba
|
5,005
sqft
|
built
1964
245 Fair Pl, Boulder, CO 80302
$-11,105
Cash flow
-17.8%
Cash-on-Cash Return
2.2%
Cap rate
0.3%
Rent to Value Ratio
Active
$5,995,000
5
bds
|
6
ba
|
4,032
sqft
|
built
2020
2670 6th St, Boulder, CO 80304
$-26,262
Cash flow
-22.9%
Cash-on-Cash Return
1.0%
Cap rate
0.2%
Rent to Value Ratio
Active
$1,299,000
3
bds
|
3
ba
|
2,194
sqft
|
built
1966
5855 Rustic Knolls Dr, Boulder, CO 80301
$-4,673
Cash flow
-18.8%
Cash-on-Cash Return
2.0%
Cap rate
0.3%
Rent to Value Ratio
Active
$354,900
2
bds
|
2
ba
|
961
sqft
|
built
1994
4840 Twin Lakes Rd, Boulder, CO 80301
$-960
Cash flow
-14.1%
Cash-on-Cash Return
3.0%
Cap rate
0.6%
Rent to Value Ratio
Active
$7,995,000
5
bds
|
7
ba
|
7,160
sqft
|
built
2004
166 Valley View Way, Boulder, CO 80304
$-36,748
Cash flow
-24.0%
Cash-on-Cash Return
0.8%
Cap rate
0.1%
Rent to Value Ratio
Active
$4,500,000
5
bds
|
3
ba
|
3,654
sqft
|
built
1976
630 Northstar Ct, Boulder, CO 80304
$-21,754
Cash flow
-25.2%
Cash-on-Cash Return
0.5%
Cap rate
0.1%
Rent to Value Ratio
Active
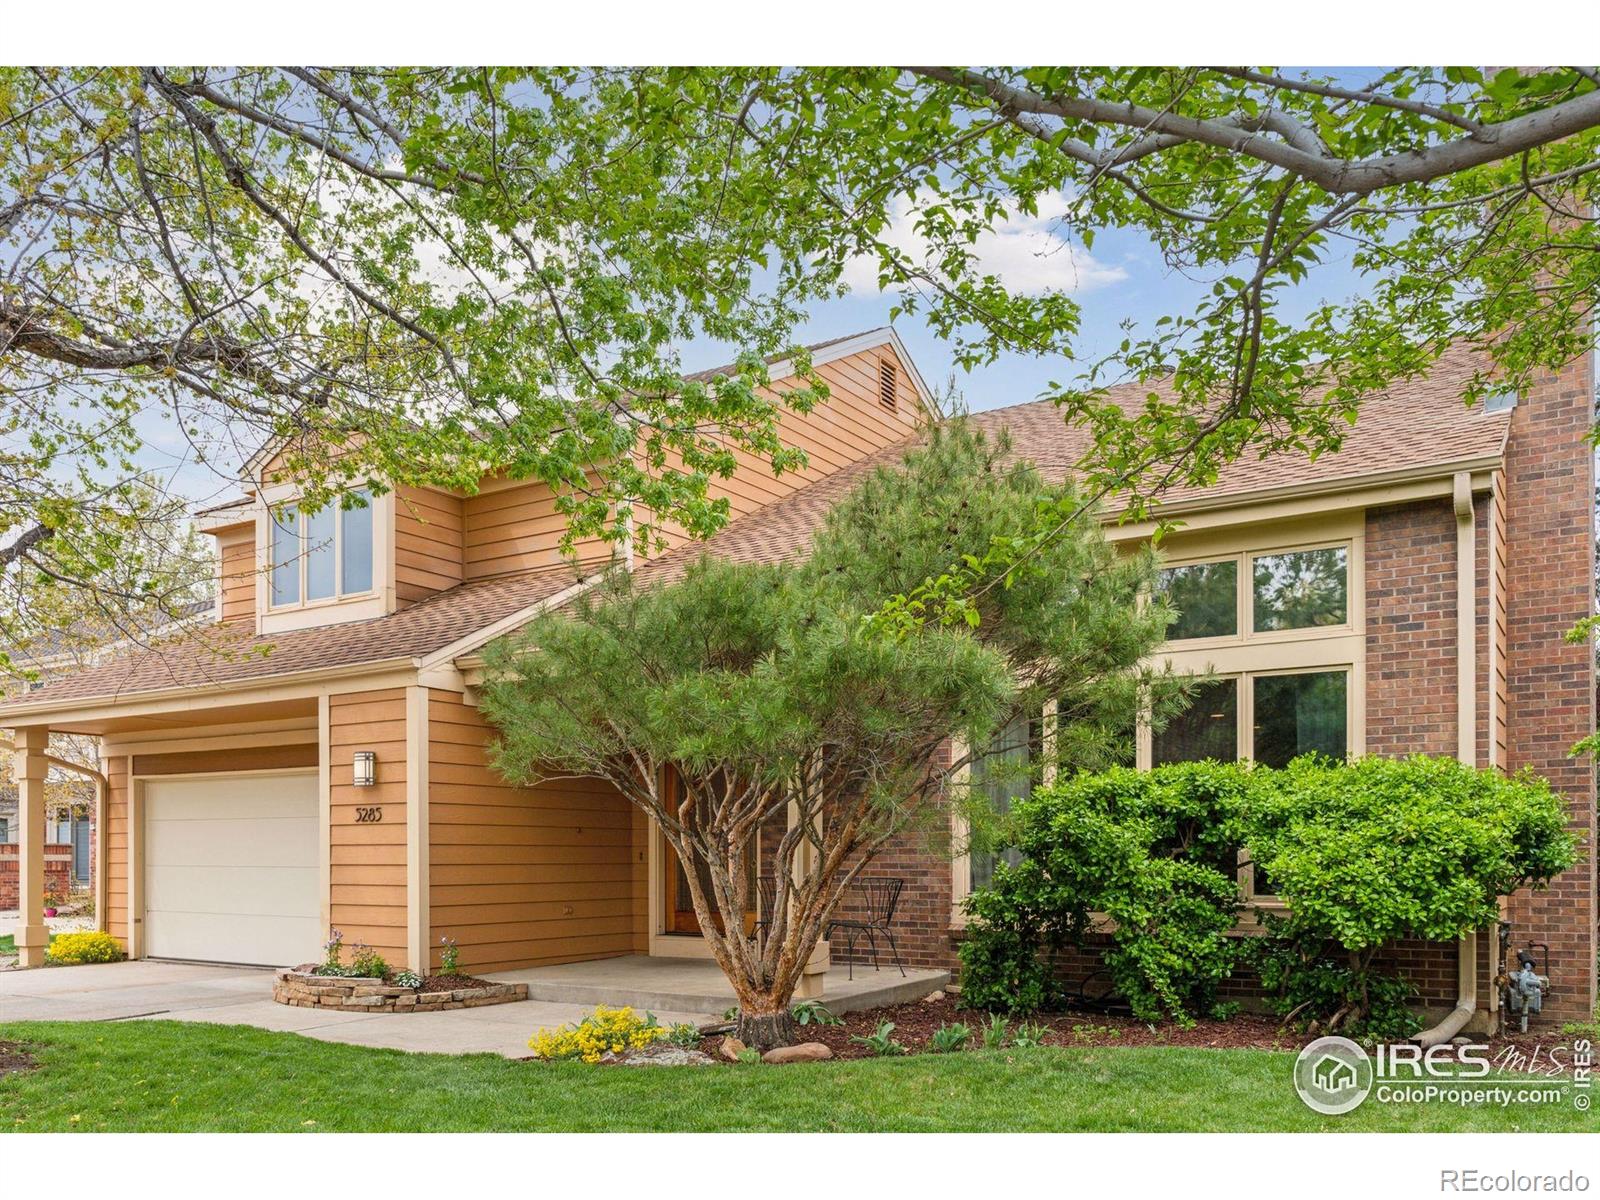
$1,598,000
3
bds
|
3
ba
|
3,336
sqft
|
built
1981
5285 Gallatin Pl, Boulder, CO 80303
$-6,203
Cash flow
-20.3%
Cash-on-Cash Return
1.6%
Cap rate
0.2%
Rent to Value Ratio
Active
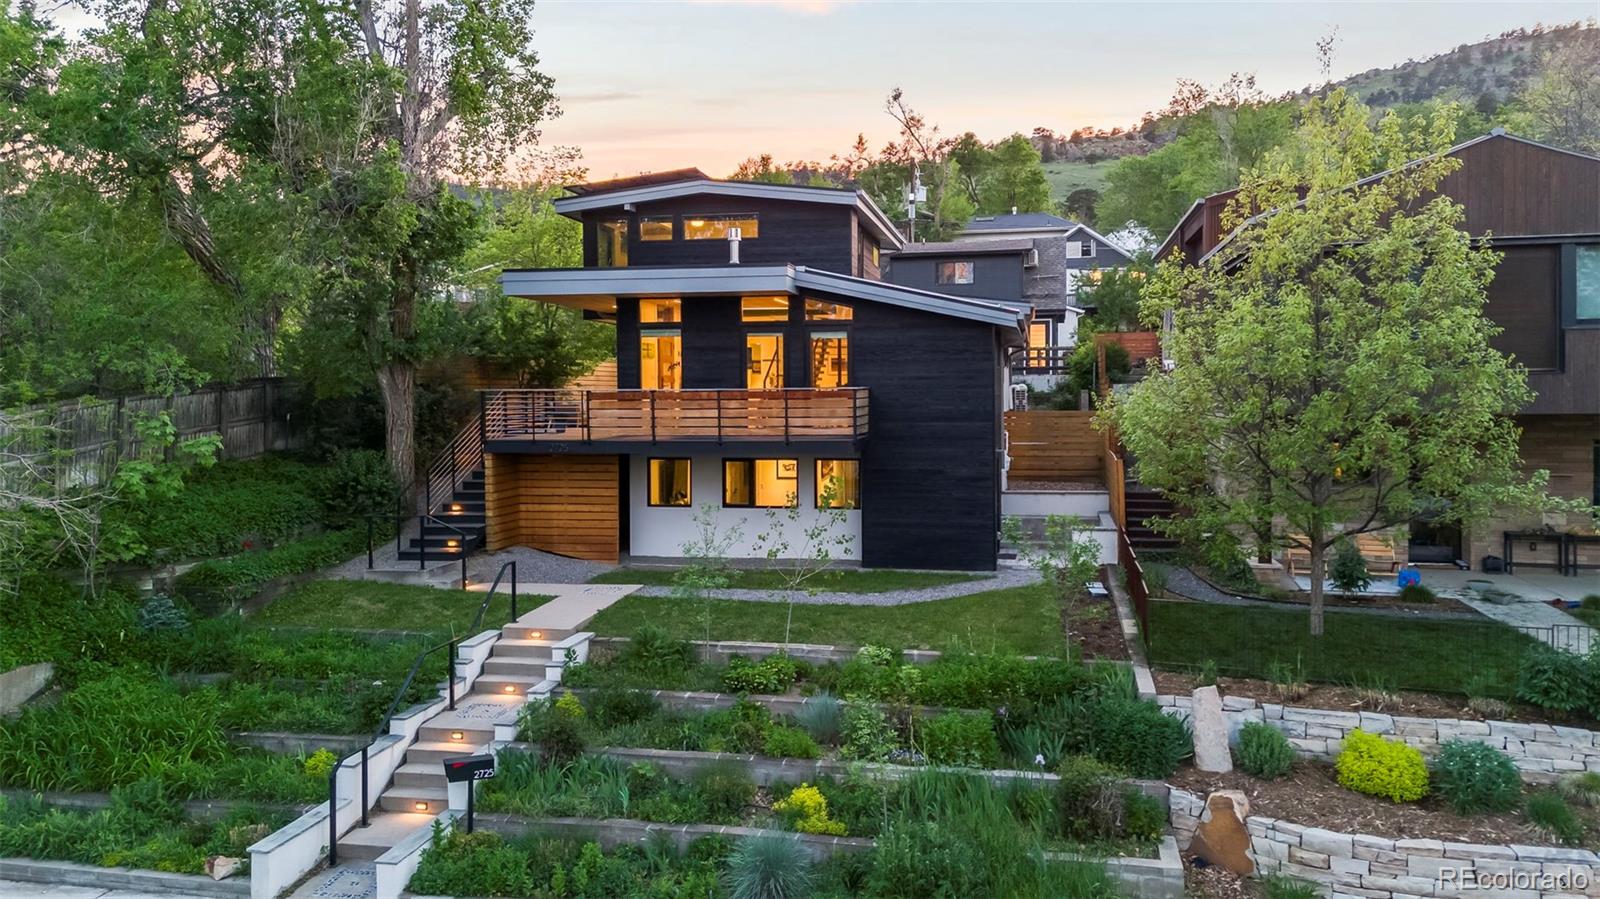
$3,695,000
5
bds
|
5
ba
|
3,471
sqft
|
built
1960
2725 6th St, Boulder, CO 80304
$-15,297
Cash flow
-21.6%
Cash-on-Cash Return
1.3%
Cap rate
0.2%
Rent to Value Ratio
Active
$2,995,000
4
bds
|
5
ba
|
4,093
sqft
|
built
1984
3945 Promontory Ct, Boulder, CO 80304
$-12,499
Cash flow
-21.8%
Cash-on-Cash Return
1.3%
Cap rate
0.2%
Rent to Value Ratio
Active
$2,495,000
4
bds
|
4
ba
|
4,020
sqft
|
built
2013
2917 13th St, Boulder, CO 80304
$-11,106
Cash flow
-23.2%
Cash-on-Cash Return
0.9%
Cap rate
0.2%
Rent to Value Ratio
Active
$2,950,000
4
bds
|
4
ba
|
4,448
sqft
|
built
1998
910 Kalmia Ave, Boulder, CO 80304
$-13,255
Cash flow
-23.4%
Cash-on-Cash Return
0.9%
Cap rate
0.2%
Rent to Value Ratio
Active
$2,500,000
5
bds
|
6
ba
|
6,112
sqft
|
built
1993
2835 Links Dr, Boulder, CO 80301
$-7,977
Cash flow
-16.6%
Cash-on-Cash Return
2.5%
Cap rate
0.4%
Rent to Value Ratio
Active
$1,800,000
3
bds
|
4
ba
|
2,588
sqft
|
built
2007
2826 Broadway St, Boulder, CO 80304
$-5,863
Cash flow
-17.0%
Cash-on-Cash Return
2.4%
Cap rate
0.4%
Rent to Value Ratio
Active
$1,795,000
5
bds
|
3
ba
|
1,926
sqft
|
built
1935
911 Lincoln Pl, Boulder, CO 80302
$-6,954
Cash flow
-20.2%
Cash-on-Cash Return
1.6%
Cap rate
0.3%
Rent to Value Ratio