Bountiful, UT Investment Properties for Sale
Browse homes for sale and investment properties in Bountiful, UT. Refine your search by price, property type, or more.
Best cash flowing properties in Bountiful, UT
Active
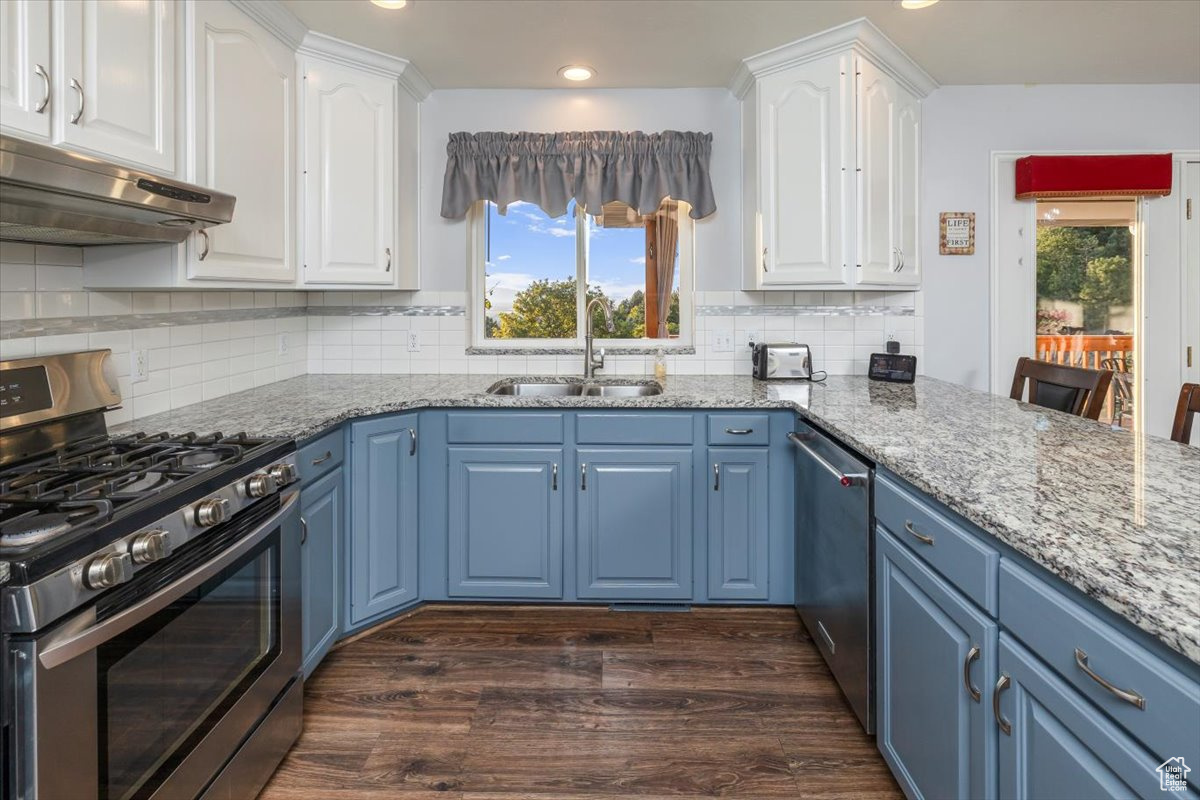
$270,000
2
bds
|
1
ba
|
1,068
sqft
|
built
1974
290 N 500 W, Bountiful, UT 84010
$-662
Cash flow
-12.8%
Cash-on-Cash Return
3.3%
Cap rate
0.6%
Rent to Value Ratio

Active
$265,000
2
bds
|
1
ba
|
934
sqft
|
built
1970
1316 S 200 W, Bountiful, UT 84010
$-728
Cash flow
-14.3%
Cash-on-Cash Return
3.0%
Cap rate
0.6%
Rent to Value Ratio
71 out of 80 properties for sale in Bountiful, UT
Limited Results Shown
Create a free account, or log in to reveal all property listings and enjoy the complete experience.
Active
$453,900
3
bds
|
3
ba
|
1,666
sqft
|
built
2019
1940 S 200 W, Bountiful, UT 84010
$-1,412
Cash flow
-16.2%
Cash-on-Cash Return
2.6%
Cap rate
0.4%
Rent to Value Ratio
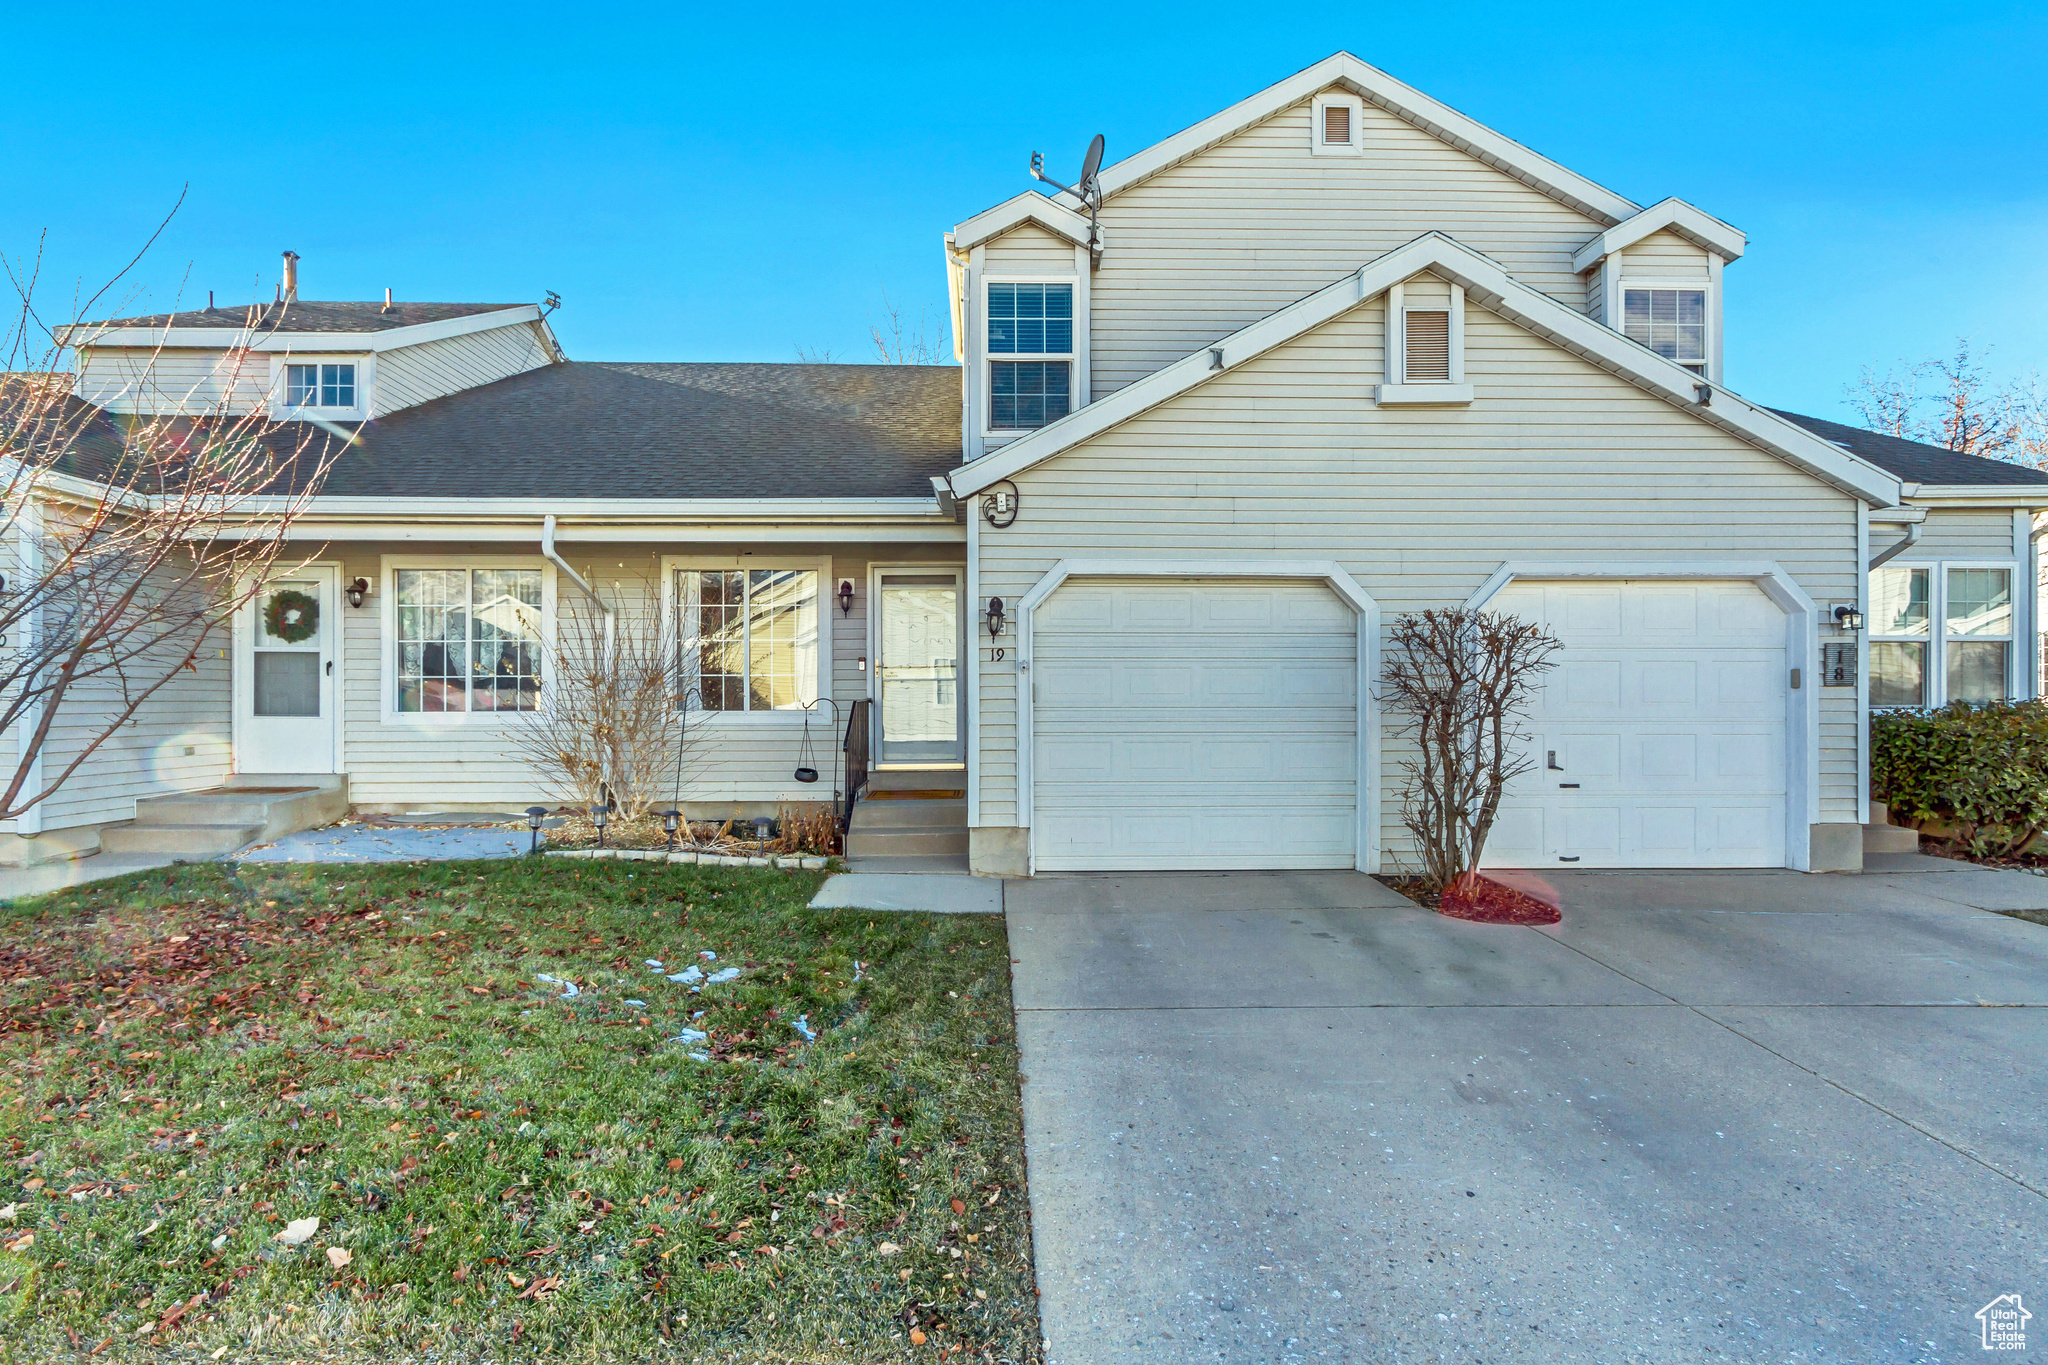
Active
$270,000
2
bds
|
1
ba
|
1,068
sqft
|
built
1974
290 N 500 W, Bountiful, UT 84010
$-662
Cash flow
-12.8%
Cash-on-Cash Return
3.3%
Cap rate
0.6%
Rent to Value Ratio
Active
$950,000
4
bds
|
4
ba
|
4,998
sqft
|
built
1980
905 Millstream Way, Bountiful, UT 84010
$-2,977
Cash flow
-16.3%
Cash-on-Cash Return
2.5%
Cap rate
0.4%
Rent to Value Ratio
Active
$490,000
3
bds
|
2
ba
|
2,345
sqft
|
built
1955
336 W 200 N, Bountiful, UT 84010
$-1,233
Cash flow
-13.1%
Cash-on-Cash Return
3.3%
Cap rate
0.5%
Rent to Value Ratio

Active
$525,000
4
bds
|
3
ba
|
2,511
sqft
|
built
1976
2251 Ridgewood Way, Bountiful, UT 84010
$-1,949
Cash flow
-19.4%
Cash-on-Cash Return
1.8%
Cap rate
0.4%
Rent to Value Ratio
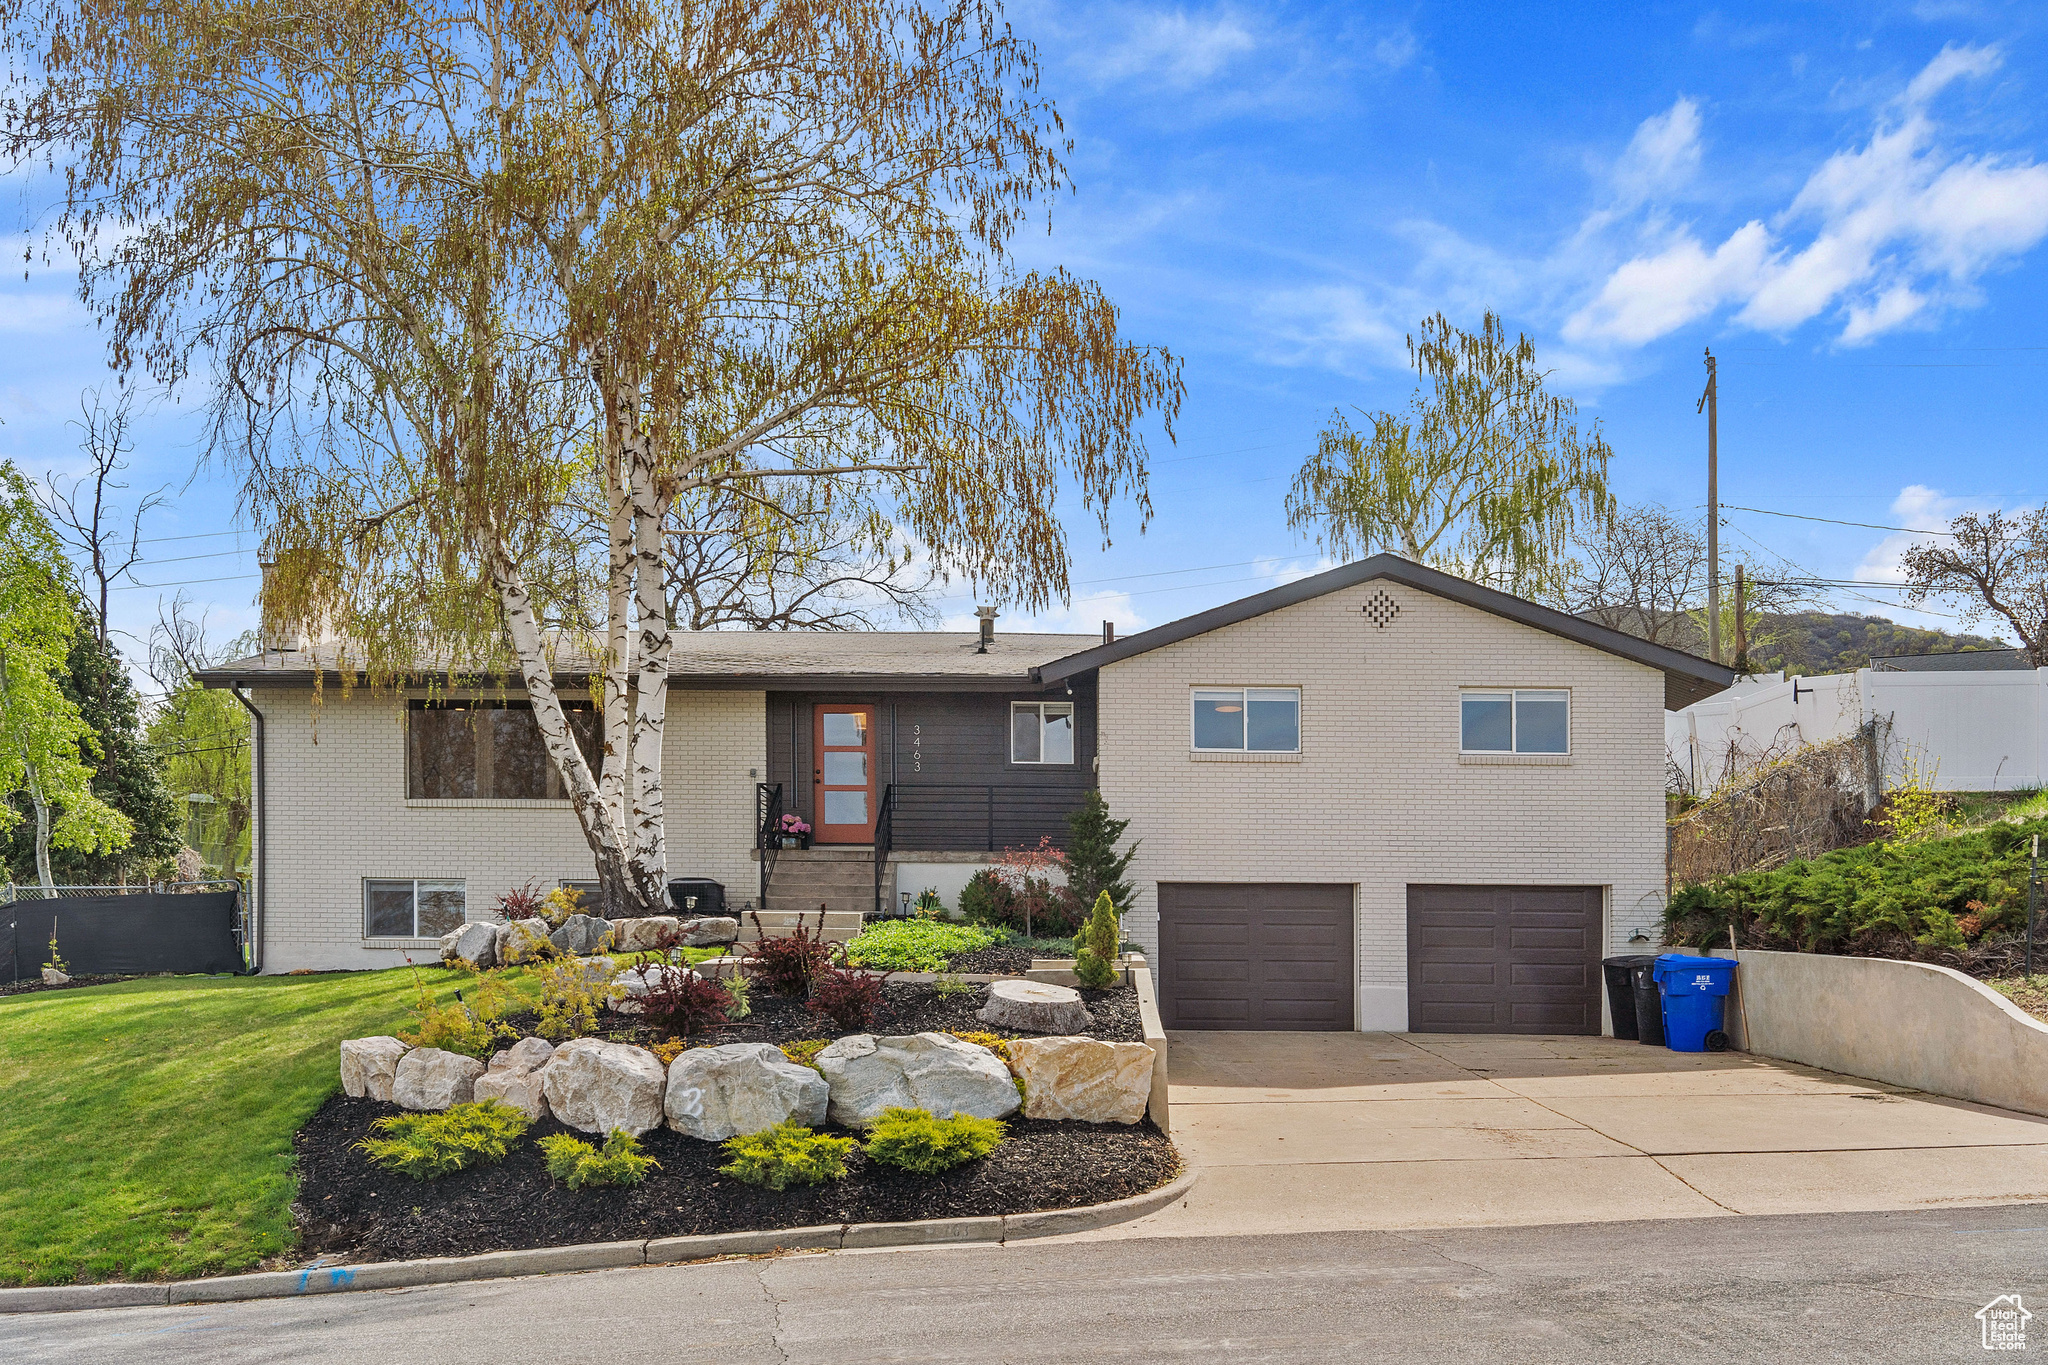
Active
$795,000
4
bds
|
3
ba
|
3,076
sqft
|
built
1973
3463 S 50 E, Bountiful, UT 84010
$-1,662
Cash flow
-10.9%
Cash-on-Cash Return
3.8%
Cap rate
0.5%
Rent to Value Ratio
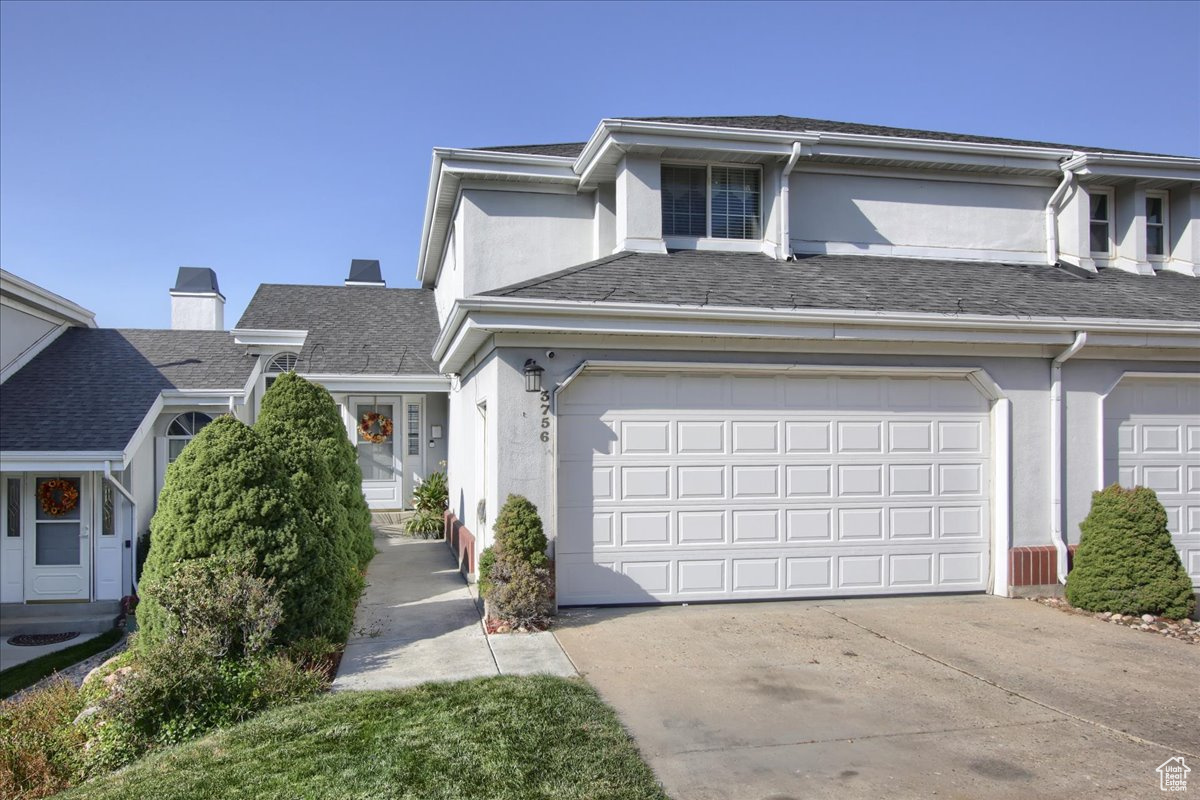
Active
$525,000
3
bds
|
4
ba
|
2,024
sqft
|
built
1986
3756 Cardiff Way, Bountiful, UT 84010
$-1,482
Cash flow
-14.7%
Cash-on-Cash Return
2.9%
Cap rate
0.5%
Rent to Value Ratio

Active
$340,000
3
bds
|
2
ba
|
1,248
sqft
|
built
1977
3049 S Orchard Dr, Bountiful, UT 84010
$-943
Cash flow
-14.5%
Cash-on-Cash Return
3.0%
Cap rate
0.5%
Rent to Value Ratio

Active
$650,000
5
bds
|
4
ba
|
2,808
sqft
|
built
2022
520 S Orchard Dr, Bountiful, UT 84010
$-1,811
Cash flow
-14.5%
Cash-on-Cash Return
2.9%
Cap rate
0.4%
Rent to Value Ratio
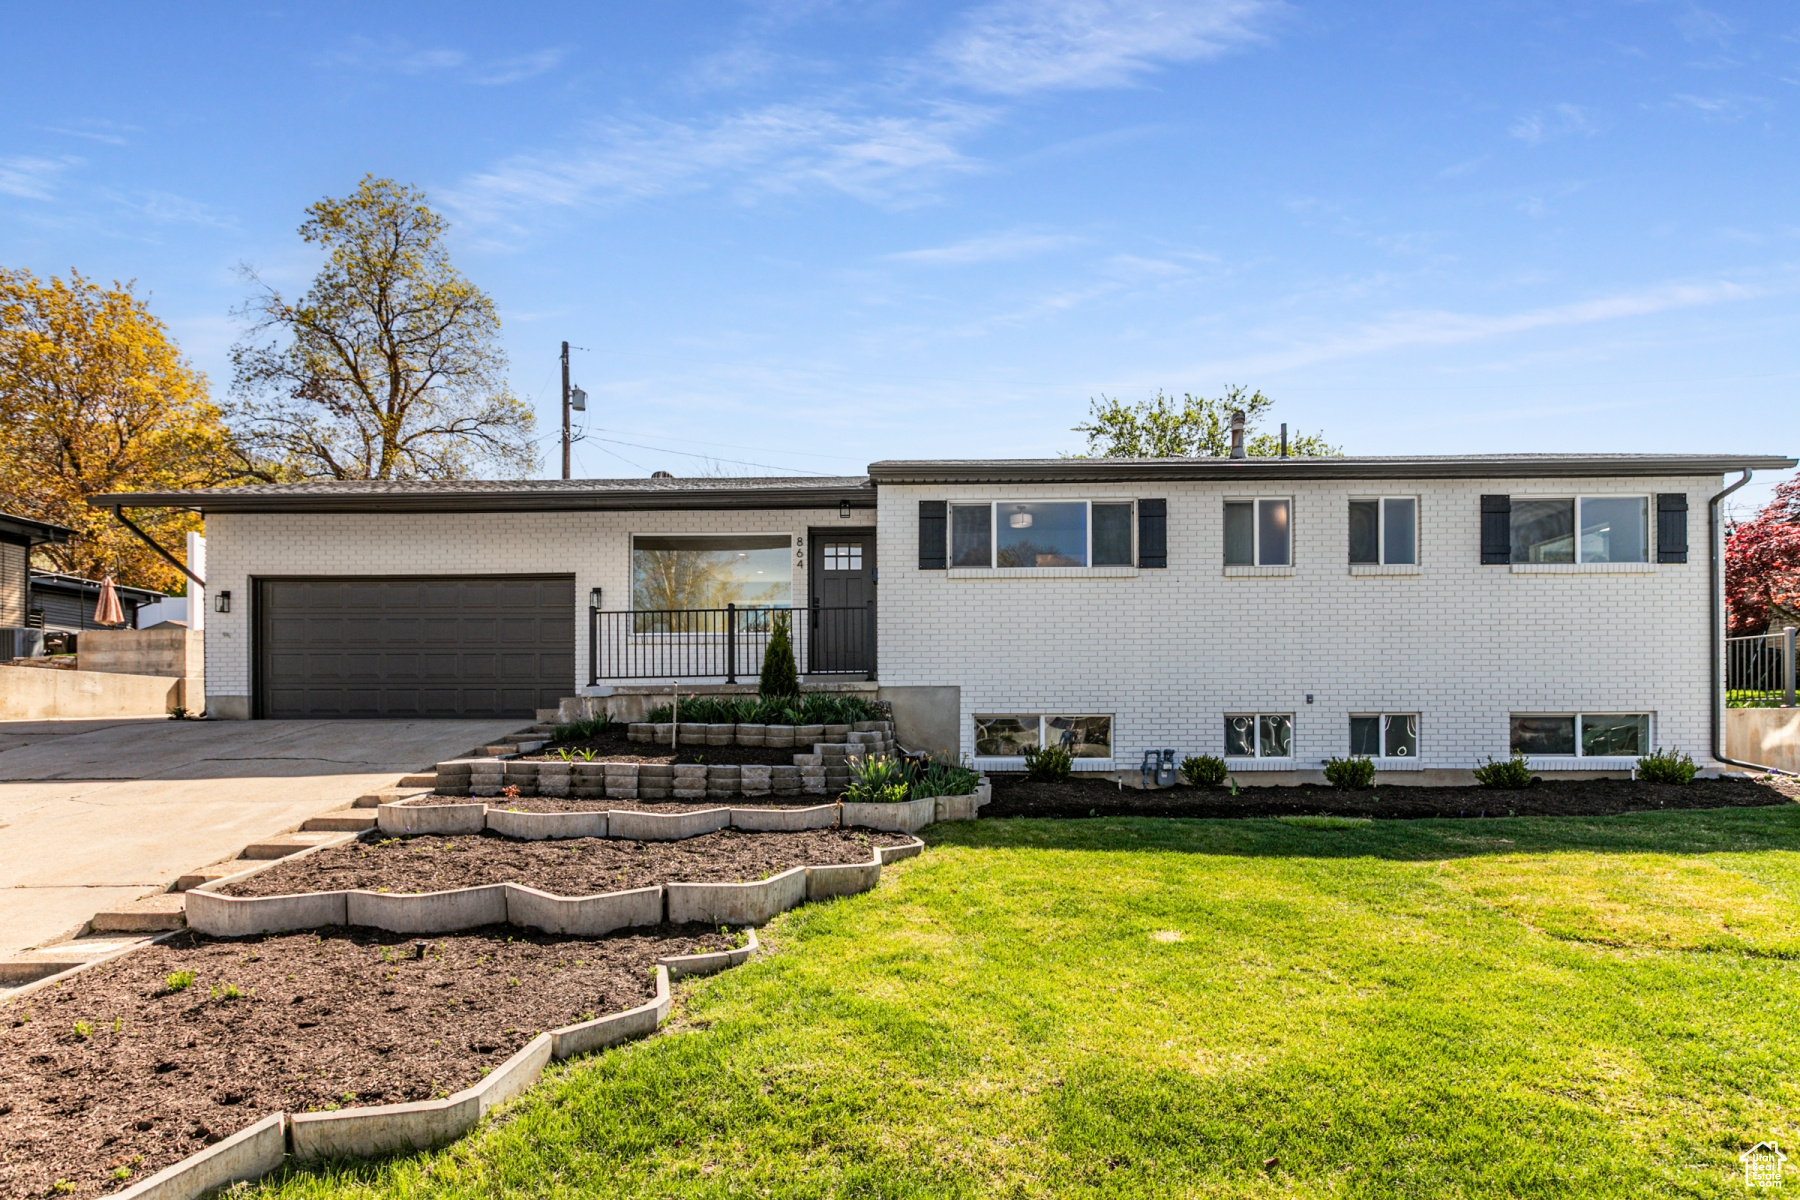
Active
$715,000
5
bds
|
3
ba
|
2,724
sqft
|
built
1963
864 N 750 E, Bountiful, UT 84010
$-2,184
Cash flow
-15.9%
Cash-on-Cash Return
2.6%
Cap rate
0.4%
Rent to Value Ratio
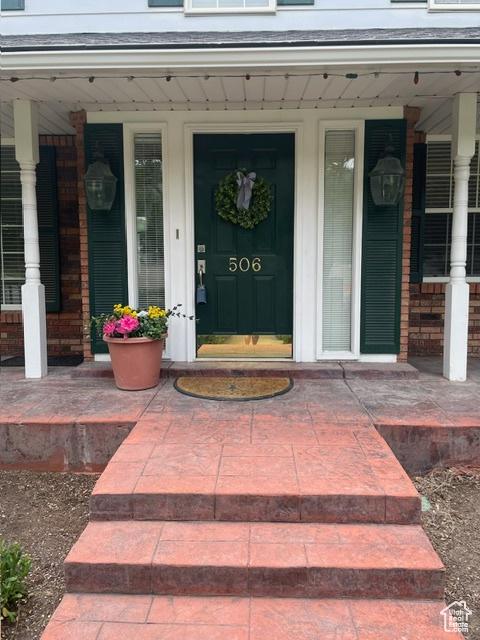
Active
$799,992
5
bds
|
5
ba
|
4,941
sqft
|
built
1979
506 S 1200 E, Bountiful, UT 84010
$-1,480
Cash flow
-9.7%
Cash-on-Cash Return
4.1%
Cap rate
0.6%
Rent to Value Ratio
Active
$800,000
5
bds
|
4
ba
|
3,912
sqft
|
built
1971
1349 Madera Hills Dr, Bountiful, UT 84010
$-1,764
Cash flow
-11.5%
Cash-on-Cash Return
3.6%
Cap rate
0.5%
Rent to Value Ratio
Active
$610,000
5
bds
|
3
ba
|
2,744
sqft
|
built
1949
2928 S 575 W, Bountiful, UT 84010
$-1,576
Cash flow
-13.5%
Cash-on-Cash Return
3.2%
Cap rate
0.4%
Rent to Value Ratio
Active
$389,000
4
bds
|
4
ba
|
2,566
sqft
|
built
1970
1310 S 200 W, Bountiful, UT 84010
$-1,350
Cash flow
-18.1%
Cash-on-Cash Return
2.1%
Cap rate
0.6%
Rent to Value Ratio
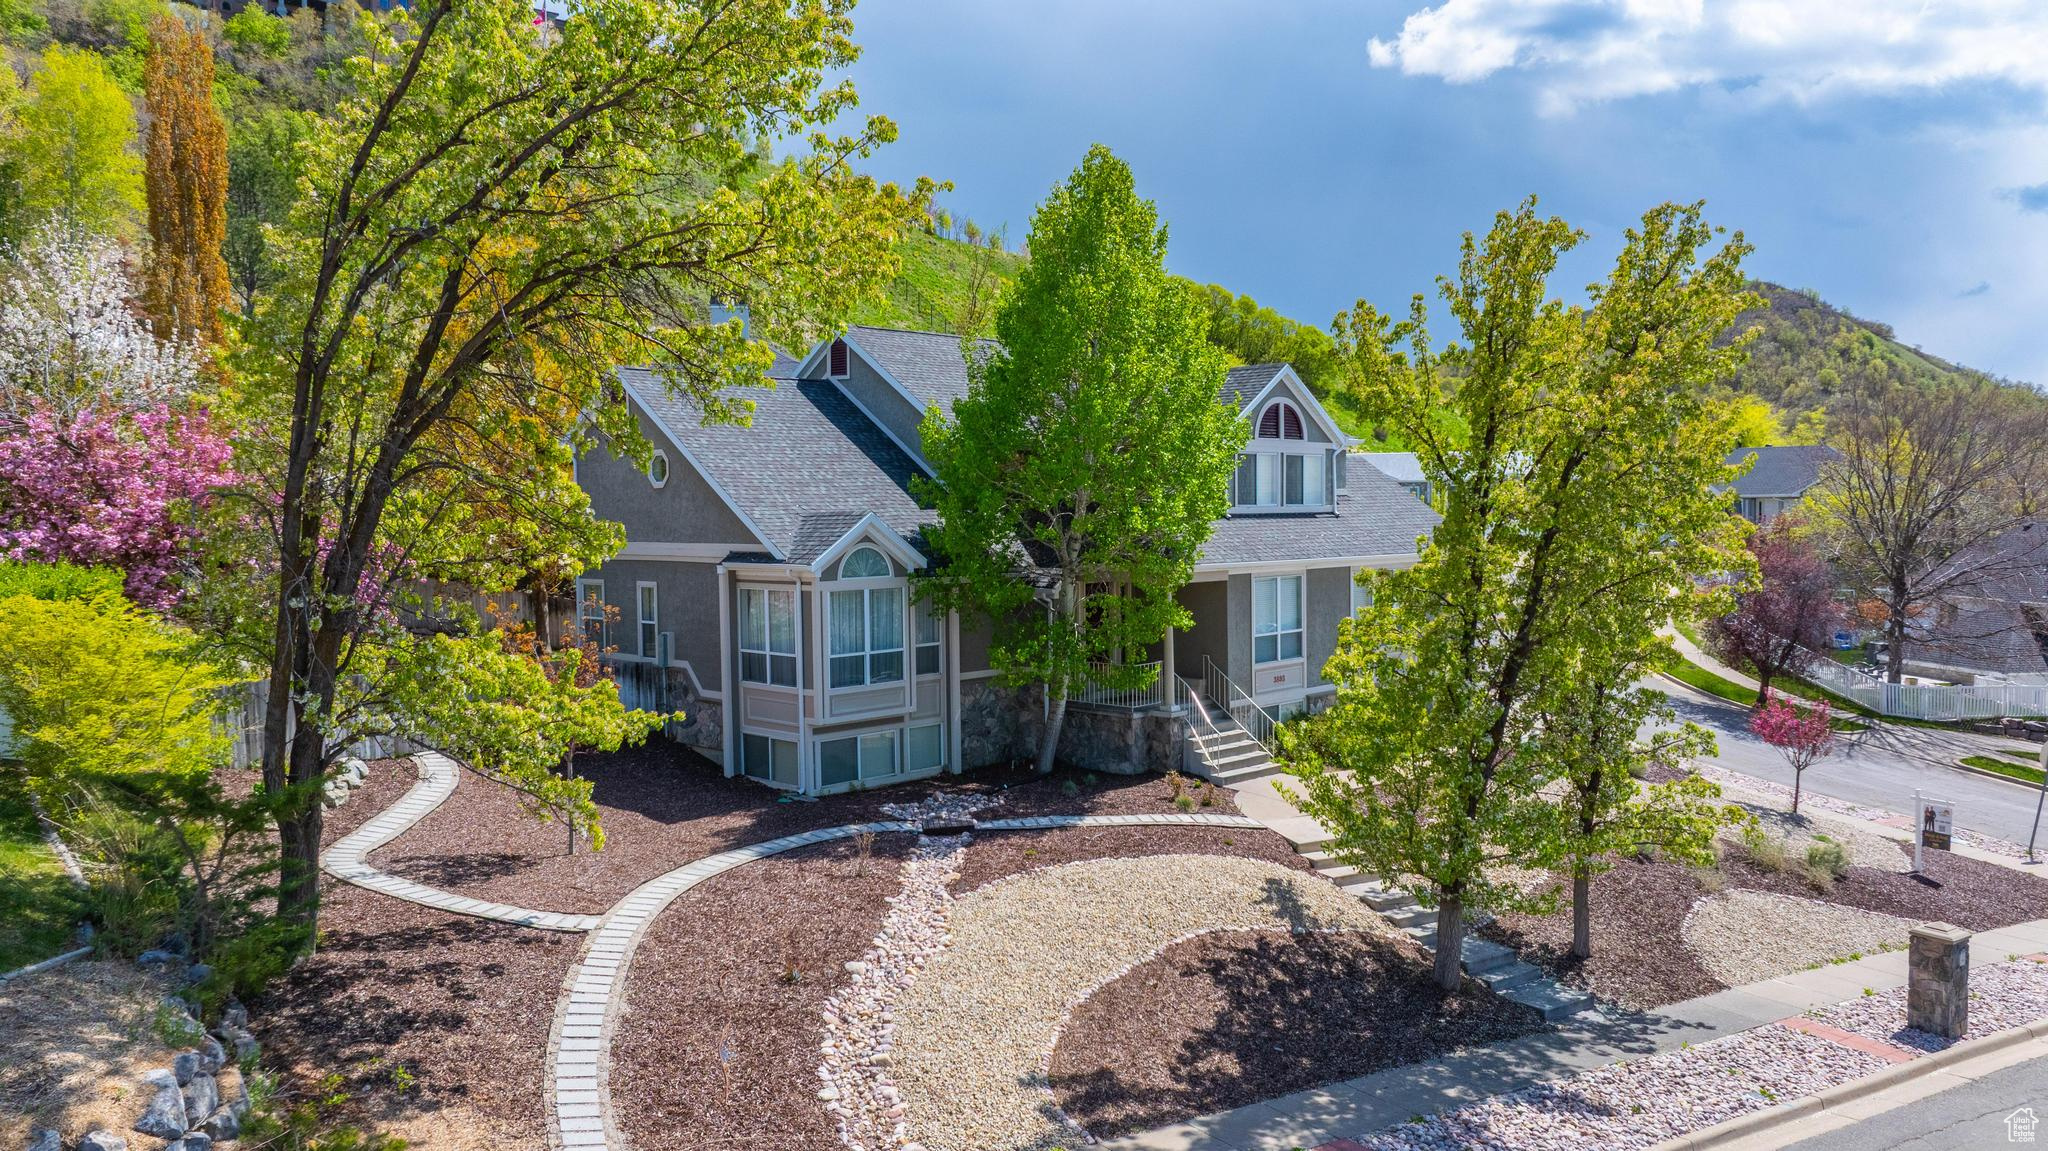
Active
$824,000
5
bds
|
4
ba
|
4,274
sqft
|
built
1977
1376 Granada Dr, Bountiful, UT 84010
$-2,753
Cash flow
-17.4%
Cash-on-Cash Return
2.3%
Cap rate
0.3%
Rent to Value Ratio
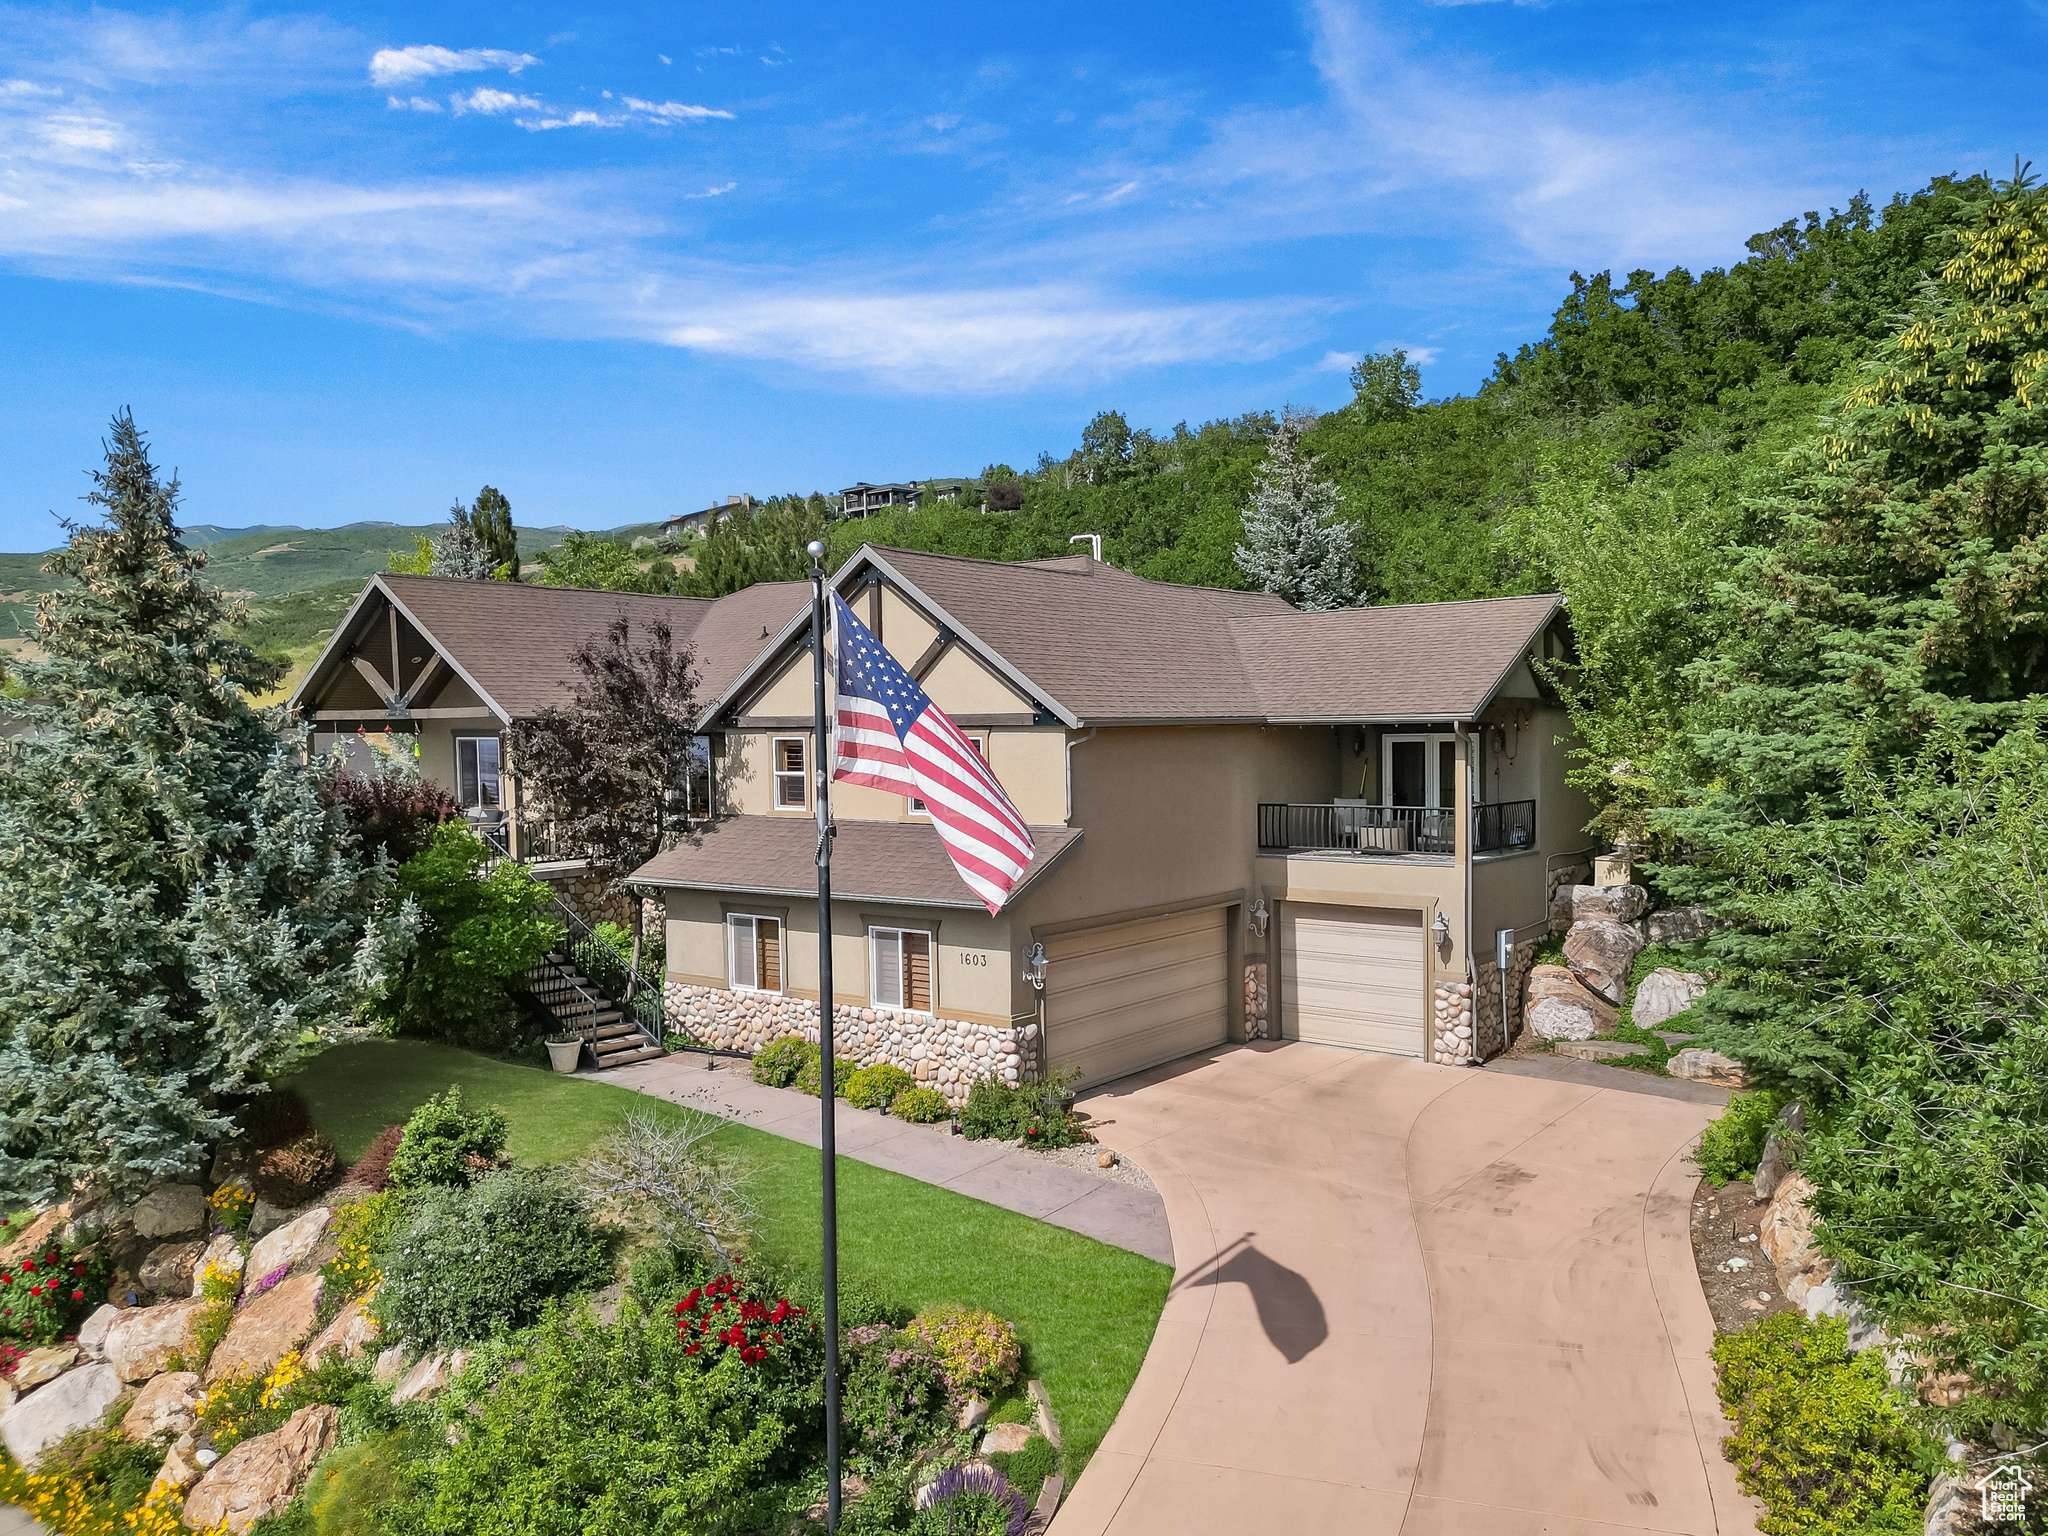
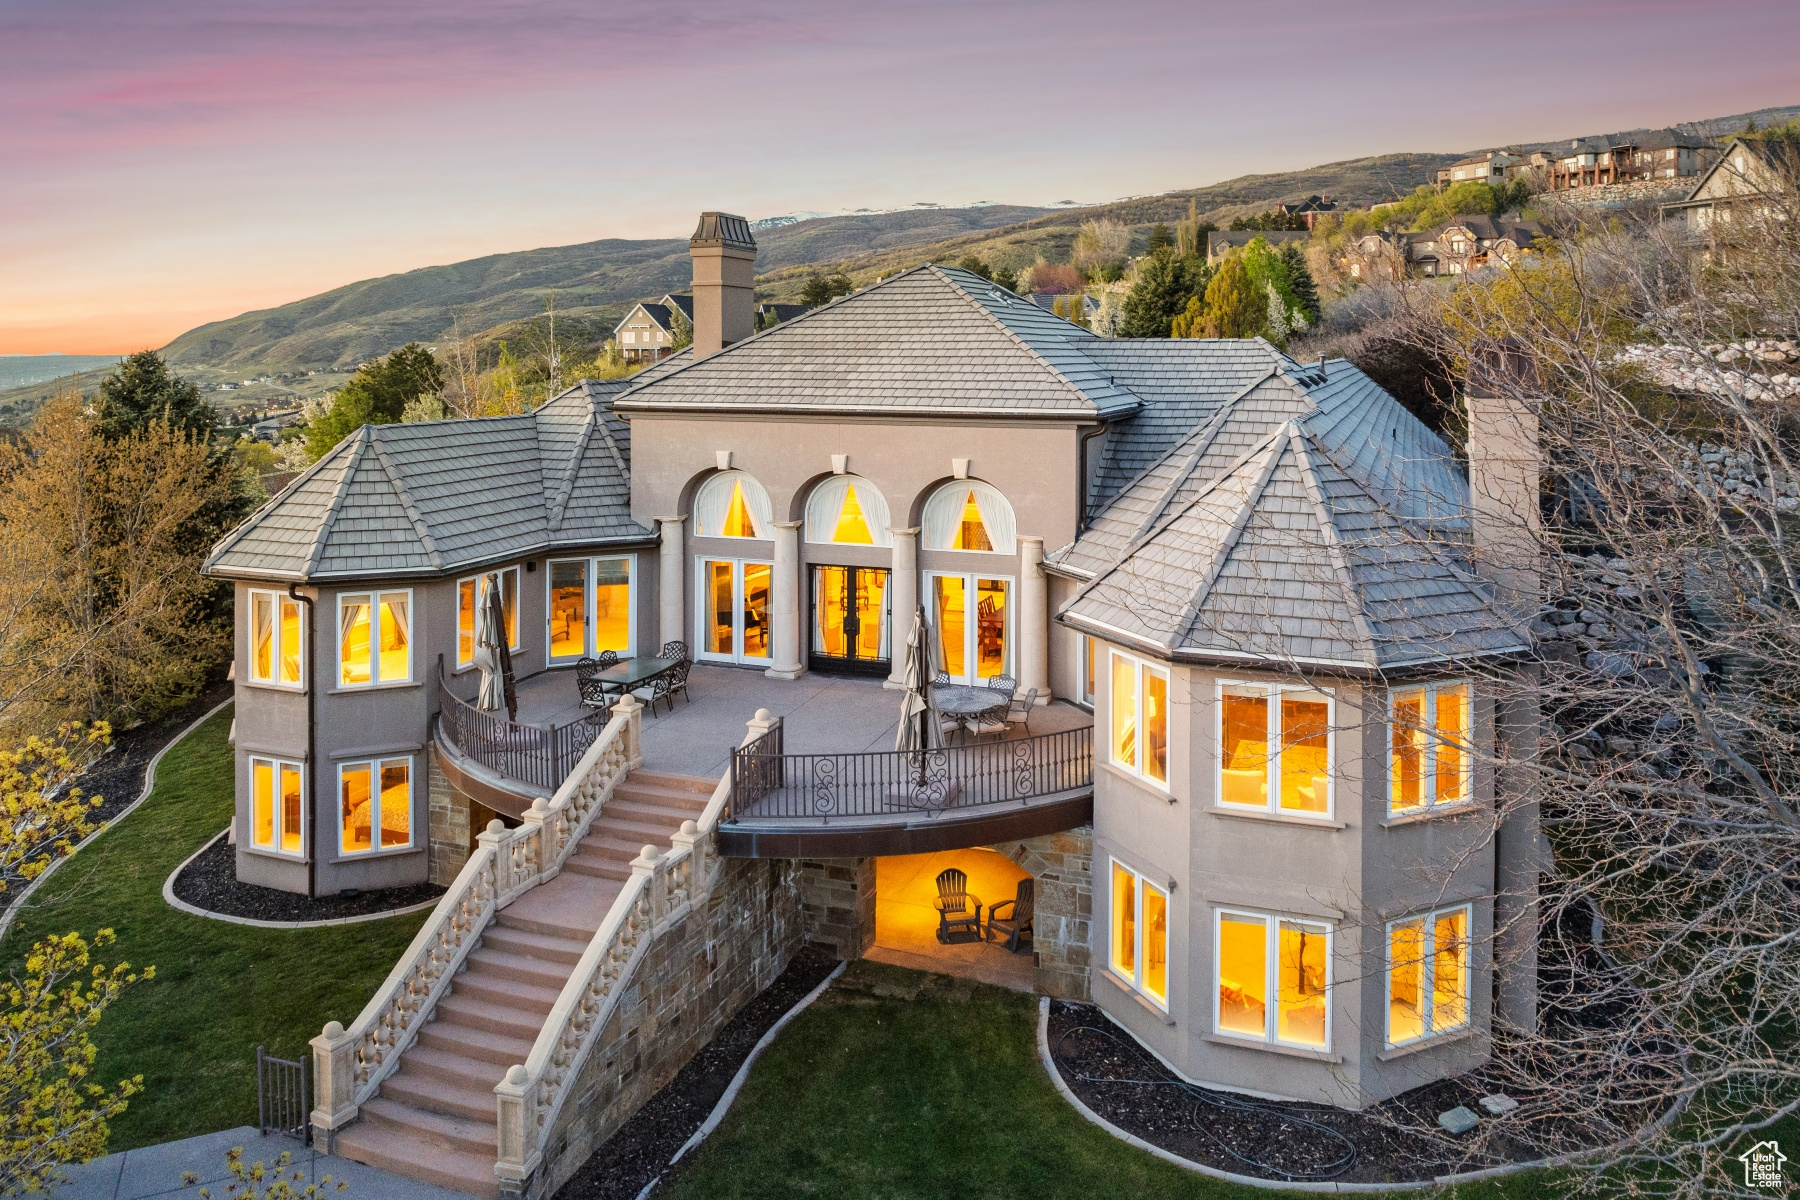
Active
$1,125,000
3
bds
|
3
ba
|
4,171
sqft
|
built
2004
1603 E Millbrook Way, Bountiful, UT 84010
$-2,616
Cash flow
-12.1%
Cash-on-Cash Return
3.5%
Cap rate
0.5%
Rent to Value Ratio

Active
$649,000
5
bds
|
3
ba
|
2,541
sqft
|
built
1977
141 Bona Vista Dr, Bountiful, UT 84010
$-1,659
Cash flow
-13.3%
Cash-on-Cash Return
3.2%
Cap rate
0.4%
Rent to Value Ratio
Active
$514,990
3
bds
|
2
ba
|
1,894
sqft
|
built
1963
1653 S 500 E, Bountiful, UT 84010
$-1,190
Cash flow
-12.1%
Cash-on-Cash Return
3.5%
Cap rate
0.5%
Rent to Value Ratio
Active
$550,000
3
bds
|
2
ba
|
2,550
sqft
|
built
1977
1357 Ridgewood Ln, Bountiful, UT 84010
$-2,025
Cash flow
-19.2%
Cash-on-Cash Return
1.9%
Cap rate
0.4%
Rent to Value Ratio

Active
$465,000
2
bds
|
2
ba
|
1,793
sqft
|
built
1950
2943 S 400 W, Bountiful, UT 84010
$-1,267
Cash flow
-14.2%
Cash-on-Cash Return
3.0%
Cap rate
0.4%
Rent to Value Ratio
Active
$509,000
5
bds
|
2
ba
|
3,332
sqft
|
built
1954
114 W 1900 S, Bountiful, UT 84010
$-794
Cash flow
-8.1%
Cash-on-Cash Return
4.4%
Cap rate
0.6%
Rent to Value Ratio

Active
$575,000
4
bds
|
2
ba
|
2,145
sqft
|
built
1950
65 E 1000 S, Bountiful, UT 84010
$-1,272
Cash flow
-11.5%
Cash-on-Cash Return
3.6%
Cap rate
0.5%
Rent to Value Ratio
Active
$419,000
4
bds
|
3
ba
|
1,771
sqft
|
built
1985
499 N 200 W, Bountiful, UT 84010
$-1,129
Cash flow
-14.1%
Cash-on-Cash Return
3.1%
Cap rate
0.5%
Rent to Value Ratio
Active
$2,295,000
6
bds
|
5
ba
|
8,134
sqft
|
built
1995
1714 Ridge Point Dr, Bountiful, UT 84010
$-10,073
Cash flow
-22.9%
Cash-on-Cash Return
1.0%
Cap rate
0.2%
Rent to Value Ratio
Active
$875,000
6
bds
|
4
ba
|
4,819
sqft
|
built
1990
3893 Bountiful Blvd, Bountiful, UT 84010
$-1,528
Cash flow
-9.1%
Cash-on-Cash Return
4.2%
Cap rate
0.6%
Rent to Value Ratio
Active
$265,000
2
bds
|
1
ba
|
934
sqft
|
built
1970
1316 S 200 W, Bountiful, UT 84010
$-728
Cash flow
-14.3%
Cash-on-Cash Return
3.0%
Cap rate
0.6%
Rent to Value Ratio

Active under contract
$320,000
3
bds
|
4
ba
|
2,440
sqft
|
built
1975
1950 S 200 W, Bountiful, UT 84010
$-879
Cash flow
-14.3%
Cash-on-Cash Return
3.0%
Cap rate
0.6%
Rent to Value Ratio

Active
$697,500
5
bds
|
3
ba
|
2,842
sqft
|
built
1967
386 E 2100 S, Bountiful, UT 84010
$-2,404
Cash flow
-18.0%
Cash-on-Cash Return
2.1%
Cap rate
0.3%
Rent to Value Ratio
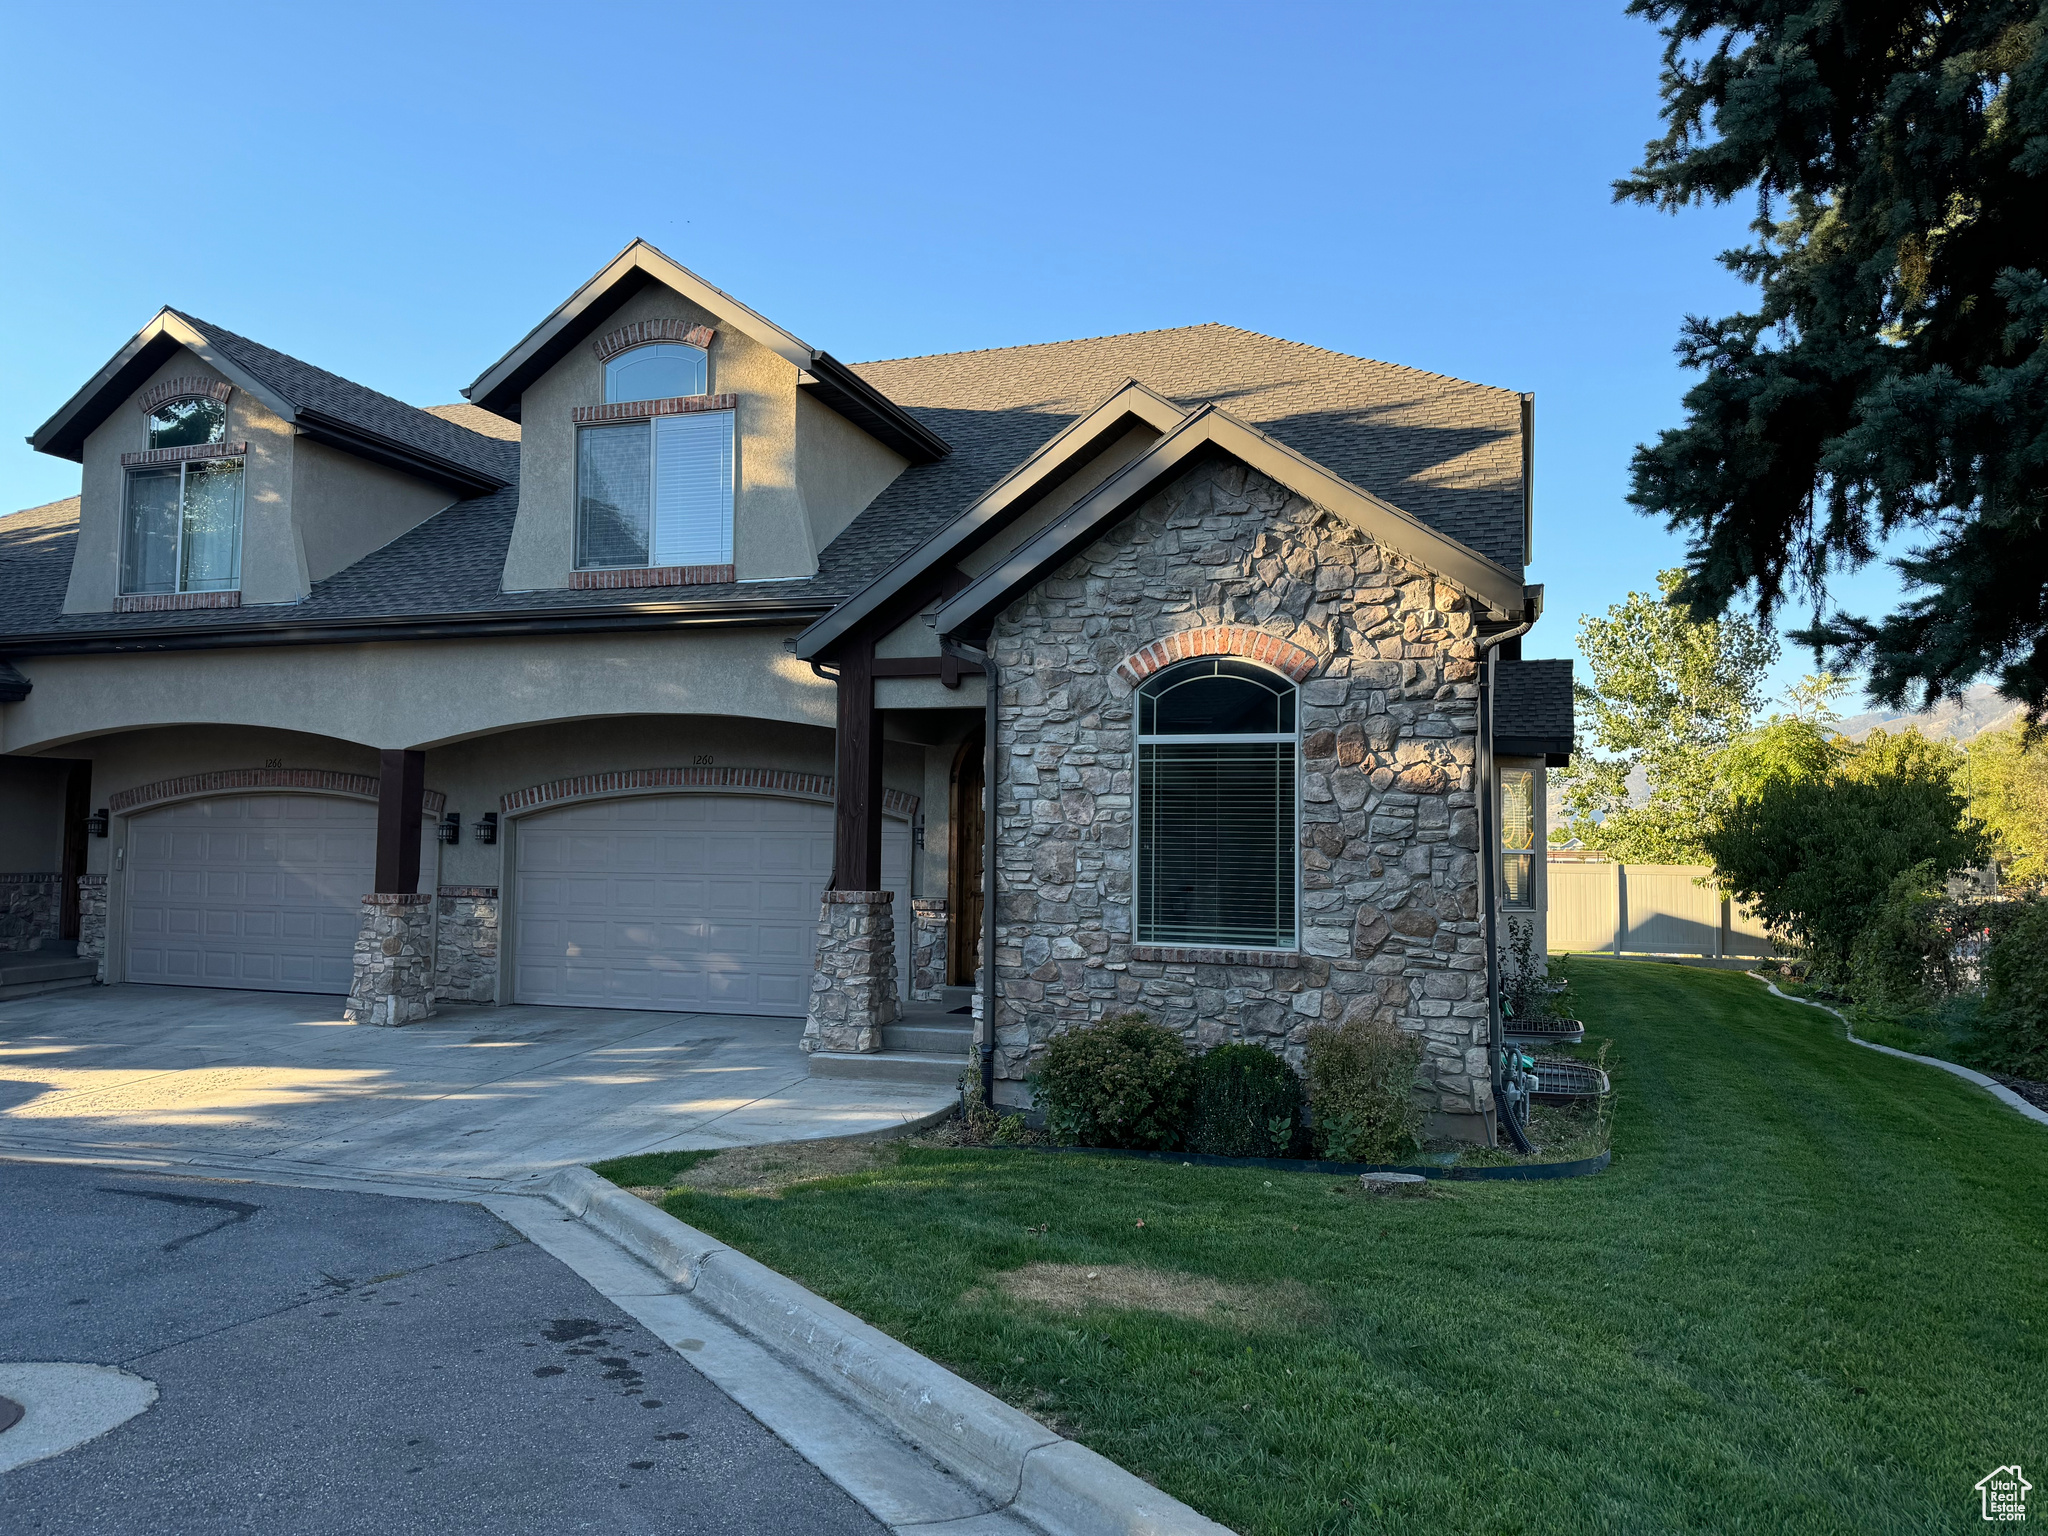
Active
$639,900
4
bds
|
3
ba
|
3,442
sqft
|
built
2010
1260 N 200 W, Bountiful, UT 84010
$-1,725
Cash flow
-14.1%
Cash-on-Cash Return
3.0%
Cap rate
0.5%
Rent to Value Ratio
Active
$800,000
5
bds
|
5
ba
|
4,943
sqft
|
built
1993
795 N 1300 E, Bountiful, UT 84010
$-1,476
Cash flow
-9.6%
Cash-on-Cash Return
4.1%
Cap rate
0.6%
Rent to Value Ratio
Active
$877,000
5
bds
|
4
ba
|
3,750
sqft
|
built
2001
2783 Irene Dr, Bountiful, UT 84010
$-1,897
Cash flow
-11.3%
Cash-on-Cash Return
3.7%
Cap rate
0.5%
Rent to Value Ratio