Bountiful, UT Investment Properties for Sale
Browse homes for sale and investment properties in Bountiful, UT. Refine your search by price, property type, or more.
Best cash flowing properties in Bountiful, UT
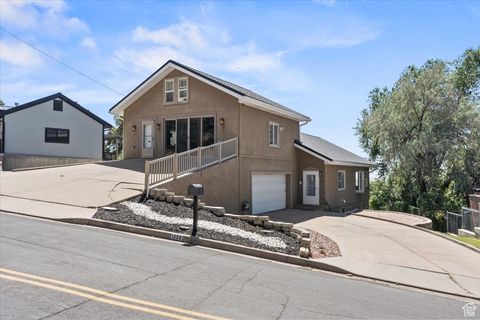
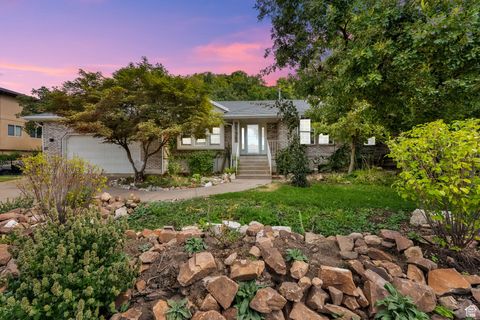
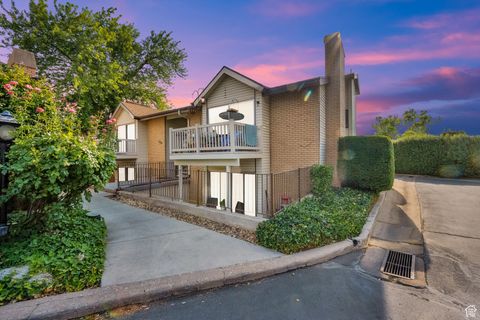
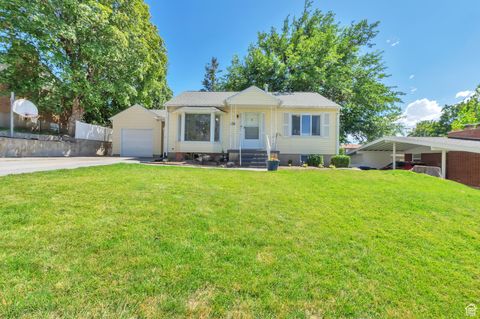
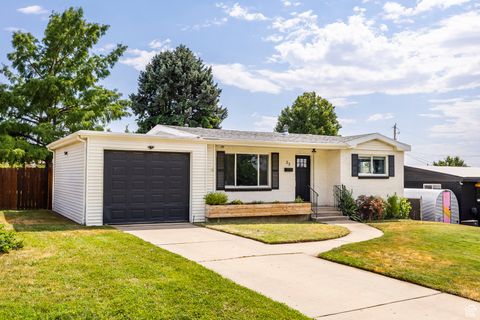
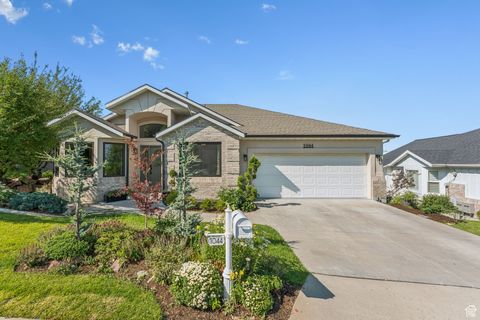
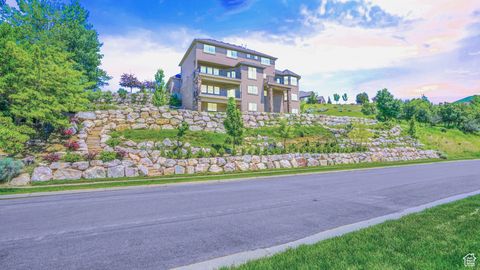
Active
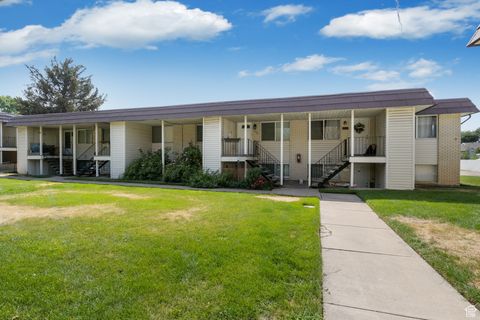
$265,000
2
bds
|
1
ba
|
925
sqft
|
built
1971
314 W Center St, Bountiful, UT 84010
$-434
Cash flow
-8.5%
Cash-on-Cash Return
3.7%
Cap rate
0.7%
Rent to Value Ratio
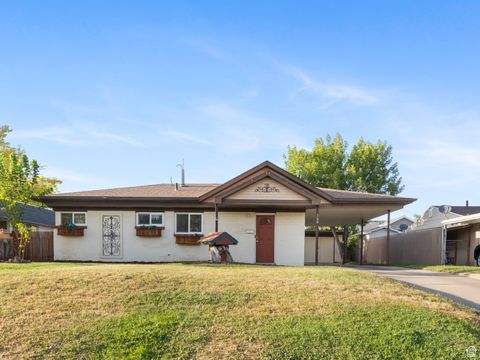
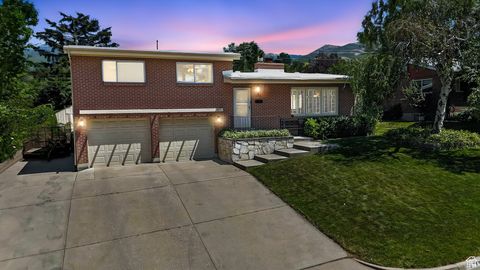
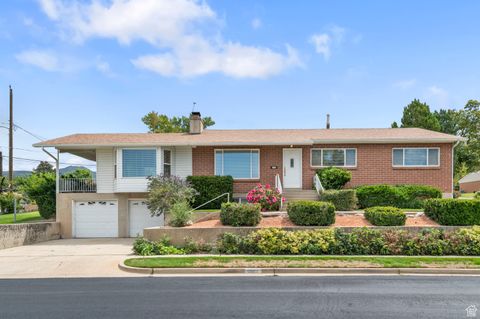
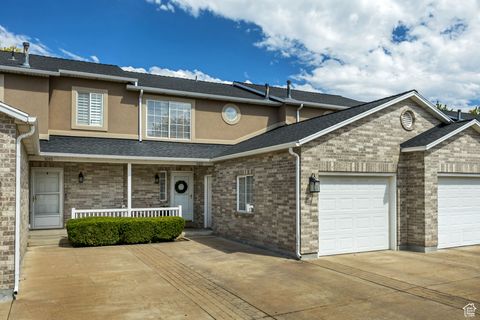
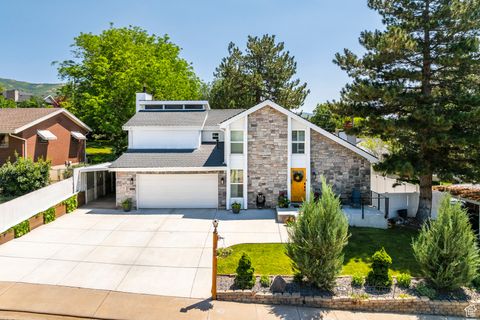
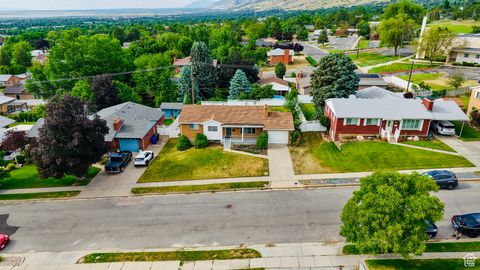
Active
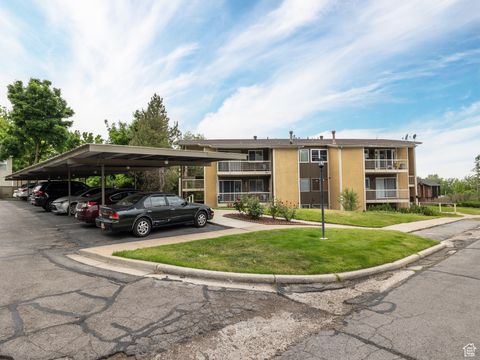
$325,000
2
bds
|
2
ba
|
1,139
sqft
|
built
1973
288 Peach Ln, Bountiful, UT 84010
$-606
Cash flow
-9.7%
Cash-on-Cash Return
3.4%
Cap rate
0.6%
Rent to Value Ratio
42 out of 47 properties for sale in Bountiful, UT
Limited Results Shown
Create a free account, or log in to reveal all property listings and enjoy the complete experience.
Active
$400,000
4
bds
|
2
ba
|
1,888
sqft
|
built
1974
553 N 200 W, Bountiful, UT 84010
$-852
Cash flow
-11.1%
Cash-on-Cash Return
3.1%
Cap rate
0.6%
Rent to Value Ratio
Active
$675,000
4
bds
|
3
ba
|
2,849
sqft
|
built
1966
1399 E Millbrook Way, Bountiful, UT 84010
$-1,747
Cash flow
-13.5%
Cash-on-Cash Return
2.6%
Cap rate
0.4%
Rent to Value Ratio
Active
$659,000
5
bds
|
4
ba
|
3,585
sqft
|
built
1994
1225 N 900 E, Bountiful, UT 84010
$-1,000
Cash flow
-7.9%
Cash-on-Cash Return
3.9%
Cap rate
0.5%
Rent to Value Ratio
Active
$435,000
3
bds
|
1
ba
|
1,070
sqft
|
built
1954
360 W 800 S, Bountiful, UT 84010
$-856
Cash flow
-10.3%
Cash-on-Cash Return
3.3%
Cap rate
0.5%
Rent to Value Ratio
Active
$667,000
4
bds
|
4
ba
|
2,728
sqft
|
built
1993
3033 S 400 E, Bountiful, UT 84010
$-1,613
Cash flow
-12.6%
Cash-on-Cash Return
2.8%
Cap rate
0.4%
Rent to Value Ratio
Active
$539,999
4
bds
|
2
ba
|
1,700
sqft
|
built
1942
16 W 700 N, Bountiful, UT 84010
$-1,511
Cash flow
-14.6%
Cash-on-Cash Return
2.3%
Cap rate
0.3%
Rent to Value Ratio
Active
$580,000
5
bds
|
4
ba
|
3,394
sqft
|
built
1990
2171 Bountiful Blvd, Bountiful, UT 84010
$-1,228
Cash flow
-11.0%
Cash-on-Cash Return
3.1%
Cap rate
0.4%
Rent to Value Ratio

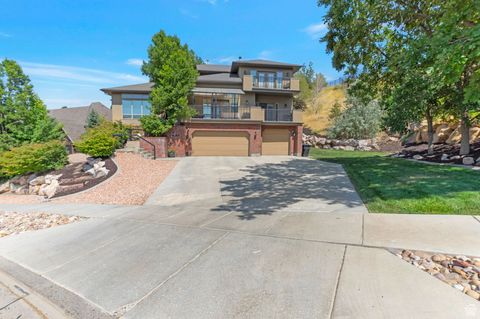
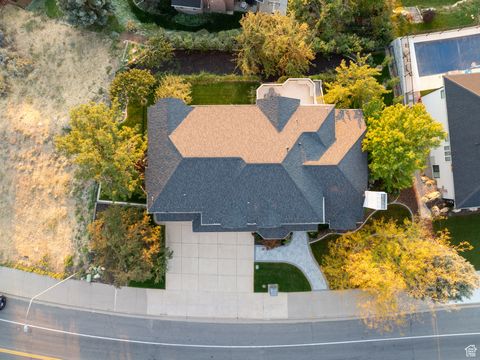
Active
$1,300,000
5
bds
|
3
ba
|
6,656
sqft
|
built
2004
1342 Northridge Dr, Bountiful, UT 84010
$-2,336
Cash flow
-9.4%
Cash-on-Cash Return
3.5%
Cap rate
0.5%
Rent to Value Ratio
Active
$399,900
3
bds
|
3
ba
|
1,249
sqft
|
built
2010
319 W 200 N, Bountiful, UT 84010
$-969
Cash flow
-12.6%
Cash-on-Cash Return
2.8%
Cap rate
0.5%
Rent to Value Ratio
Active
$950,000
5
bds
|
5
ba
|
4,614
sqft
|
built
1978
3551 S 950 E, Bountiful, UT 84010
$-2,624
Cash flow
-14.4%
Cash-on-Cash Return
2.4%
Cap rate
0.3%
Rent to Value Ratio
Active
$860,000
4
bds
|
3
ba
|
4,008
sqft
|
built
1974
159 N Davis Blvd, Bountiful, UT 84010
$-1,930
Cash flow
-11.7%
Cash-on-Cash Return
3.0%
Cap rate
0.4%
Rent to Value Ratio
Active
$279,400
2
bds
|
1
ba
|
934
sqft
|
built
1970
1314 S 200 W, Bountiful, UT 84010
$-655
Cash flow
-12.2%
Cash-on-Cash Return
2.9%
Cap rate
0.6%
Rent to Value Ratio
Active
$800,000
5
bds
|
4
ba
|
3,390
sqft
|
built
1965
2177 Bonneview Dr, Bountiful, UT 84010
$-2,194
Cash flow
-14.3%
Cash-on-Cash Return
2.4%
Cap rate
0.4%
Rent to Value Ratio
Active
$999,000
6
bds
|
6
ba
|
4,763
sqft
|
built
2004
3975 Monarch Dr, Bountiful, UT 84010
$-2,478
Cash flow
-12.9%
Cash-on-Cash Return
2.7%
Cap rate
0.4%
Rent to Value Ratio
Active
$564,900
4
bds
|
2
ba
|
2,678
sqft
|
built
1957
1871 S 350 E, Bountiful, UT 84010
$-1,403
Cash flow
-13.0%
Cash-on-Cash Return
2.7%
Cap rate
0.4%
Rent to Value Ratio
Active
$539,999
5
bds
|
3
ba
|
2,335
sqft
|
built
1951
662 E 1200 N, Bountiful, UT 84010
$-868
Cash flow
-8.4%
Cash-on-Cash Return
3.7%
Cap rate
0.5%
Rent to Value Ratio
Active
$599,900
5
bds
|
3
ba
|
2,823
sqft
|
built
1957
3183 S 500 W, Bountiful, UT 84010
$-1,592
Cash flow
-13.8%
Cash-on-Cash Return
2.5%
Cap rate
0.4%
Rent to Value Ratio
Active
$419,000
4
bds
|
3
ba
|
1,771
sqft
|
built
1985
499 N 200 W, Bountiful, UT 84010
$-918
Cash flow
-11.4%
Cash-on-Cash Return
3.1%
Cap rate
0.5%
Rent to Value Ratio
Active
$1,190,000
7
bds
|
5
ba
|
4,800
sqft
|
built
2022
1350 S 200 W, Bountiful, UT 84010
$-3,666
Cash flow
-16.1%
Cash-on-Cash Return
2.0%
Cap rate
0.3%
Rent to Value Ratio
Active
$495,000
3
bds
|
2
ba
|
1,812
sqft
|
built
1955
33 W Wicker Ln, Bountiful, UT 84010
$-840
Cash flow
-8.9%
Cash-on-Cash Return
3.6%
Cap rate
0.5%
Rent to Value Ratio
Active
$399,900
2
bds
|
3
ba
|
1,200
sqft
|
built
2001
1680 Aliwood Way, Bountiful, UT 84010
$-949
Cash flow
-12.4%
Cash-on-Cash Return
2.8%
Cap rate
0.5%
Rent to Value Ratio
Active
$1,445,000
7
bds
|
4
ba
|
5,353
sqft
|
built
1995
144 Bountiful Blvd, Bountiful, UT 84010
$-4,689
Cash flow
-16.9%
Cash-on-Cash Return
1.8%
Cap rate
0.2%
Rent to Value Ratio
Active
$550,000
5
bds
|
2
ba
|
2,072
sqft
|
built
1956
167 S 425 W, Bountiful, UT 84010
$-1,092
Cash flow
-10.4%
Cash-on-Cash Return
3.3%
Cap rate
0.5%
Rent to Value Ratio
Active
$898,000
6
bds
|
3
ba
|
4,742
sqft
|
built
2003
1044 Terrace Dr, Bountiful, UT 84010
$-3,130
Cash flow
-18.2%
Cash-on-Cash Return
1.5%
Cap rate
0.3%
Rent to Value Ratio
Active
$750,000
5
bds
|
3
ba
|
2,732
sqft
|
built
1975
534 E 1400 S, Bountiful, UT 84010
$-1,665
Cash flow
-11.6%
Cash-on-Cash Return
3.0%
Cap rate
0.4%
Rent to Value Ratio
Active
$360,000
3
bds
|
3
ba
|
1,497
sqft
|
built
1983
527 Applewood Dr, Bountiful, UT 84010
$-986
Cash flow
-14.3%
Cash-on-Cash Return
2.4%
Cap rate
0.5%
Rent to Value Ratio
Active
$305,500
2
bds
|
2
ba
|
1,011
sqft
|
built
1987
650 S Main St, Bountiful, UT 84010
$-707
Cash flow
-12.1%
Cash-on-Cash Return
2.9%
Cap rate
0.6%
Rent to Value Ratio
Active
$2,000,000
4
bds
|
5
ba
|
6,741
sqft
|
built
1996
2679 Wood Hollow Way, Bountiful, UT 84010
$-5,393
Cash flow
-14.1%
Cash-on-Cash Return
2.4%
Cap rate
0.4%
Rent to Value Ratio
Active
$1,075,000
6
bds
|
4
ba
|
5,970
sqft
|
built
1966
861 E Millbrook Way, Bountiful, UT 84010
$-2,040
Cash flow
-9.9%
Cash-on-Cash Return
3.4%
Cap rate
0.5%
Rent to Value Ratio
Active
$968,000
6
bds
|
4
ba
|
4,308
sqft
|
built
1994
3551 Huntington Dr, Bountiful, UT 84010
$-2,225
Cash flow
-12.0%
Cash-on-Cash Return
2.9%
Cap rate
0.4%
Rent to Value Ratio
Active
$638,000
5
bds
|
4
ba
|
2,724
sqft
|
built
1996
1536 N 150 W, Bountiful, UT 84010
$-1,275
Cash flow
-10.4%
Cash-on-Cash Return
3.3%
Cap rate
0.5%
Rent to Value Ratio
Active
$2,850,000
6
bds
|
6
ba
|
9,857
sqft
|
built
2008
1596 E Millbrook Way, Bountiful, UT 84010
$-11,508
Cash flow
-21.1%
Cash-on-Cash Return
0.8%
Cap rate
0.1%
Rent to Value Ratio
Active
$579,000
5
bds
|
3
ba
|
2,258
sqft
|
built
1959
573 E 1600 S, Bountiful, UT 84010
$-841
Cash flow
-7.6%
Cash-on-Cash Return
3.9%
Cap rate
0.5%
Rent to Value Ratio
Active
$247,500
2
bds
|
1
ba
|
769
sqft
|
built
1971
17 E 400 N, Bountiful, UT 84010
$-607
Cash flow
-12.8%
Cash-on-Cash Return
2.7%
Cap rate
0.6%
Rent to Value Ratio
Active
$499,900
4
bds
|
2
ba
|
2,260
sqft
|
built
1963
285 E 1650 S, Bountiful, UT 84010
$-921
Cash flow
-9.6%
Cash-on-Cash Return
3.5%
Cap rate
0.5%
Rent to Value Ratio
Active
$929,000
4
bds
|
4
ba
|
5,238
sqft
|
built
1972
1761 S Davis Blvd, Bountiful, UT 84010
$-2,295
Cash flow
-12.9%
Cash-on-Cash Return
2.7%
Cap rate
0.4%
Rent to Value Ratio
Active
$589,000
5
bds
|
3
ba
|
2,868
sqft
|
built
1976
2285 Ridgewood Way, Bountiful, UT 84010
$-2,054
Cash flow
-18.2%
Cash-on-Cash Return
1.5%
Cap rate
0.4%
Rent to Value Ratio
Active
$499,999
3
bds
|
2
ba
|
1,894
sqft
|
built
1963
1653 S 500 E, Bountiful, UT 84010
$-859
Cash flow
-9.0%
Cash-on-Cash Return
3.6%
Cap rate
0.5%
Rent to Value Ratio