Ogden, UT Investment Properties for Sale
Browse homes for sale and investment properties in Ogden, UT. Refine your search by price, property type, or more.
Best cash flowing properties in Ogden, UT
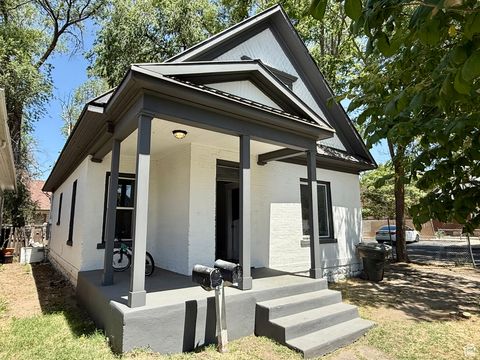
Active
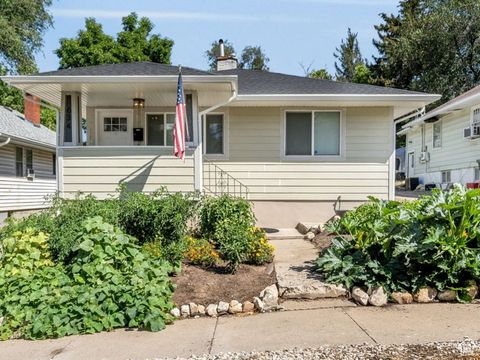
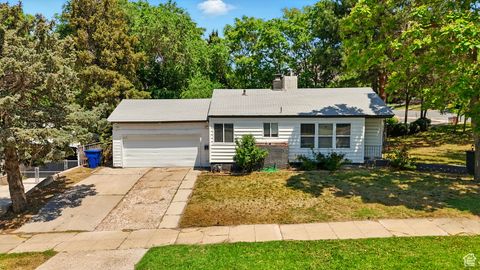
$419,000
7
bds
|
2
ba
|
2,829
sqft
|
built
1917
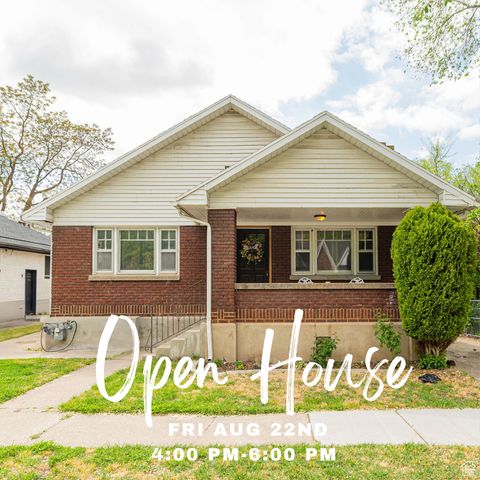
225 8th St, Ogden, UT 84404
$-37
Cash flow
-0.5%
Cash-on-Cash Return
5.6%
Cap rate
0.7%
Rent to Value Ratio
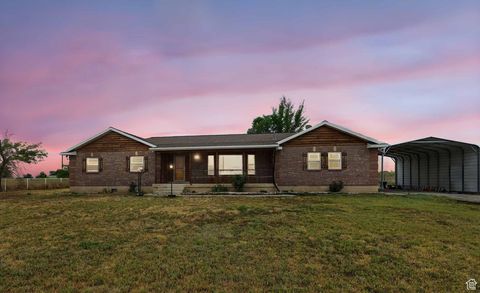
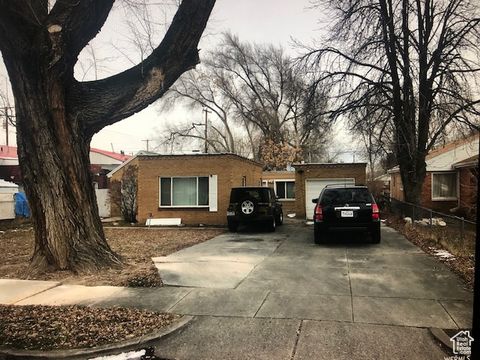
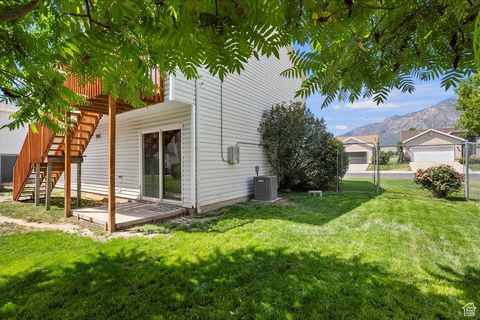
Active
$352,000
4
bds
|
2
ba
|
1,684
sqft
|
built
1947
3317 Jackson Ave, Ogden, UT 84403
$-378
Cash flow
-5.6%
Cash-on-Cash Return
4.4%
Cap rate
0.6%
Rent to Value Ratio
142 out of 326 properties for sale in Ogden, UT
Limited Results Shown
Create a free account, or log in to reveal all property listings and enjoy the complete experience.
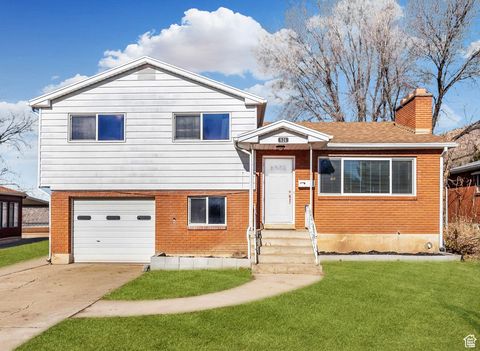
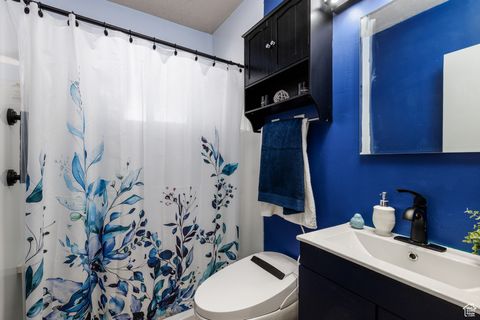
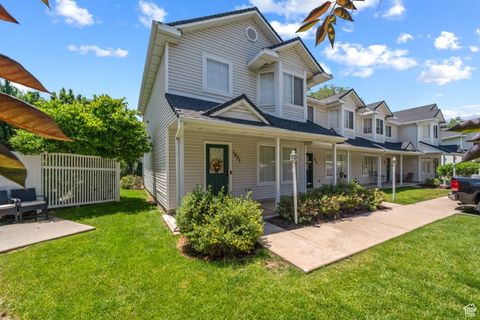
Active
$268,900
2
bds
|
2
ba
|
1,045
sqft
|
built
2019
154 7th St, Ogden, UT 84404
$-601
Cash flow
-11.7%
Cash-on-Cash Return
3.0%
Cap rate
0.6%
Rent to Value Ratio
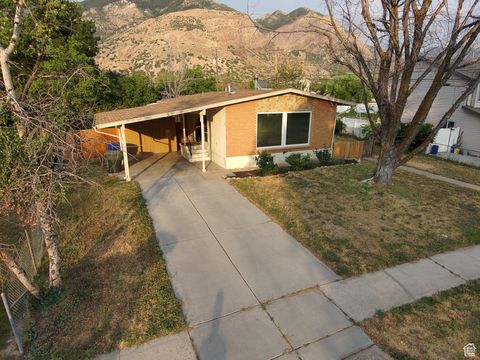
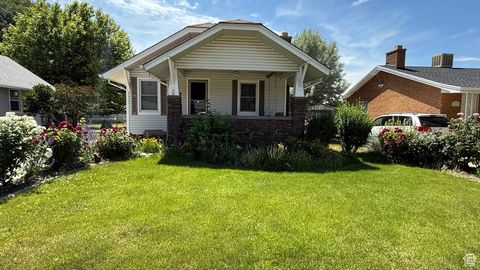
Active
$299,000
4
bds
|
2
ba
|
2,170
sqft
|
built
1975
1177 S 885 E, Ogden, UT 84404
$-758
Cash flow
-13.2%
Cash-on-Cash Return
2.6%
Cap rate
0.5%
Rent to Value Ratio
Active
$425,000
5
bds
|
2
ba
|
2,700
sqft
|
built
1942
2735 Liberty Ave, Ogden, UT 84403
$-514
Cash flow
-6.3%
Cash-on-Cash Return
4.2%
Cap rate
0.6%
Rent to Value Ratio
Active
$455,000
4
bds
|
5
ba
|
2,105
sqft
|
built
2023
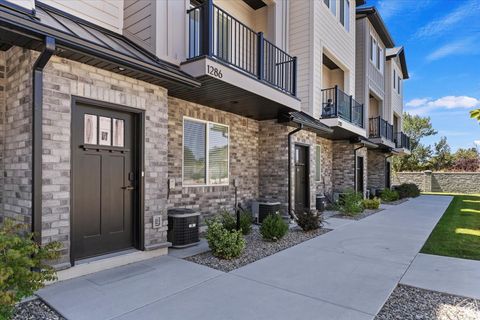
1286 E 1640 S, Ogden, UT 84404
$-679
Cash flow
-7.8%
Cash-on-Cash Return
3.9%
Cap rate
0.6%
Rent to Value Ratio
Active
$339,900
3
bds
|
2
ba
|
1,152
sqft
|
built
1969
758 3rd St, Ogden, UT 84404
$-381
Cash flow
-5.8%
Cash-on-Cash Return
4.3%
Cap rate
0.6%
Rent to Value Ratio
Active
$339,000
3
bds
|
3
ba
|
1,348
sqft
|
built
2000
1451 Olympic Ln, Ogden, UT 84404
$-659
Cash flow
-10.1%
Cash-on-Cash Return
3.3%
Cap rate
0.6%
Rent to Value Ratio
Active
$390,000
4
bds
|
2
ba
|
2,080
sqft
|
built
1920
634 Kershaw St, Ogden, UT 84403
$-529
Cash flow
-7.1%
Cash-on-Cash Return
4.1%
Cap rate
0.6%
Rent to Value Ratio
Active
$535,000
3
bds
|
2
ba
|
2,466
sqft
|
built
1996
3356 W 1200 S, Ogden, UT 84404
$-1,036
Cash flow
-10.1%
Cash-on-Cash Return
3.4%
Cap rate
0.5%
Rent to Value Ratio

Active
$849,000
5
bds
|
3
ba
|
5,099
sqft
|
built
2007
295 W 5650 S, Ogden, UT 84405
$-1,188
Cash flow
-7.3%
Cash-on-Cash Return
4.0%
Cap rate
0.5%
Rent to Value Ratio
Active
$413,900
3
bds
|
2
ba
|
2,160
sqft
|
built
1962
926 Harrop St, Ogden, UT 84404
$-465
Cash flow
-5.9%
Cash-on-Cash Return
4.3%
Cap rate
0.6%
Rent to Value Ratio
Active
$379,000
3
bds
|
2
ba
|
1,920
sqft
|
built
1960
1228 N Jefferson Ave, Ogden, UT 84404
$-421
Cash flow
-5.8%
Cash-on-Cash Return
4.3%
Cap rate
0.6%
Rent to Value Ratio
Active
$449,000
4
bds
|
2
ba
|
2,346
sqft
|
built
1951
2335 Fillmore Ave, Ogden, UT 84401
$-865
Cash flow
-10.1%
Cash-on-Cash Return
3.4%
Cap rate
0.5%
Rent to Value Ratio
Active
$409,900
3
bds
|
2
ba
|
1,266
sqft
|
built
1984
1309 S 1040 E, Ogden, UT 84404
$-1,033
Cash flow
-13.1%
Cash-on-Cash Return
2.7%
Cap rate
0.4%
Rent to Value Ratio
Active
$480,000
4
bds
|
2
ba
|
2,202
sqft
|
built
1955
3035 Brinker Ave, Ogden, UT 84403
$-1,128
Cash flow
-12.3%
Cash-on-Cash Return
2.9%
Cap rate
0.4%
Rent to Value Ratio
Active
$875,000
4
bds
|
3
ba
|
3,147
sqft
|
built
2005
6613 W 200 N, Ogden, UT 84404
$-2,076
Cash flow
-12.4%
Cash-on-Cash Return
2.8%
Cap rate
0.4%
Rent to Value Ratio
Active
$369,000
4
bds
|
2
ba
|
1,850
sqft
|
built
1982
1189 N Quincy Ave, Ogden, UT 84404
$-779
Cash flow
-11.0%
Cash-on-Cash Return
3.1%
Cap rate
0.5%
Rent to Value Ratio
Active
$350,000
3
bds
|
2
ba
|
1,352
sqft
|
built
1942
1191 20th St, Ogden, UT 84401
$-650
Cash flow
-9.7%
Cash-on-Cash Return
3.4%
Cap rate
0.5%
Rent to Value Ratio
Active
$699,900
5
bds
|
3
ba
|
2,478
sqft
|
built
1973
2582 Jacqueline Dr, Ogden, UT 84403
$-1,697
Cash flow
-12.7%
Cash-on-Cash Return
2.8%
Cap rate
0.4%
Rent to Value Ratio
Active
$385,000
5
bds
|
2
ba
|
1,672
sqft
|
built
1983
636 Downs Dr, Ogden, UT 84404
$-637
Cash flow
-8.6%
Cash-on-Cash Return
3.7%
Cap rate
0.5%
Rent to Value Ratio
Active
$319,000
3
bds
|
3
ba
|
1,440
sqft
|
built
2008
419 E 475 N, Ogden, UT 84404
$-618
Cash flow
-10.1%
Cash-on-Cash Return
3.4%
Cap rate
0.6%
Rent to Value Ratio
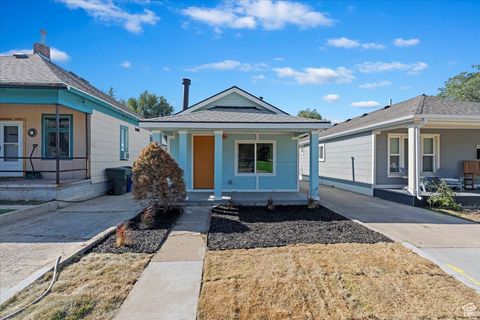
Active
$360,000
3
bds
|
2
ba
|
1,517
sqft
|
built
1907
358 11th St, Ogden, UT 84404
$-505
Cash flow
-7.3%
Cash-on-Cash Return
4.0%
Cap rate
0.6%
Rent to Value Ratio
Active
$434,900
4
bds
|
2
ba
|
2,002
sqft
|
built
1946
1116 Liberty Ave, Ogden, UT 84404
$-745
Cash flow
-8.9%
Cash-on-Cash Return
3.6%
Cap rate
0.5%
Rent to Value Ratio
Active
$364,897
3
bds
|
3
ba
|
2,414
sqft
|
built
1968
1184 16th St, Ogden, UT 84404
$-1,087
Cash flow
-15.5%
Cash-on-Cash Return
2.1%
Cap rate
0.5%
Rent to Value Ratio
Active
$470,000
5
bds
|
2
ba
|
2,840
sqft
|
built
1946
3071 Quincy Ave, Ogden, UT 84403
$-681
Cash flow
-7.6%
Cash-on-Cash Return
3.9%
Cap rate
0.6%
Rent to Value Ratio

Active
$219,000
2
bds
|
1
ba
|
760
sqft
|
built
1913
2743 Grant Ave, Ogden, UT 84401
$-610
Cash flow
-14.5%
Cash-on-Cash Return
2.3%
Cap rate
0.5%
Rent to Value Ratio
Active
$433,000
4
bds
|
2
ba
|
2,086
sqft
|
built
1939
2327 Custer Ave, Ogden, UT 84401
$-903
Cash flow
-10.9%
Cash-on-Cash Return
3.2%
Cap rate
0.5%
Rent to Value Ratio
Active
$950,000
5
bds
|
4
ba
|
4,515
sqft
|
built
1993
1880 Shadow Valley Dr, Ogden, UT 84403
$-2,795
Cash flow
-15.4%
Cash-on-Cash Return
2.1%
Cap rate
0.3%
Rent to Value Ratio
Active
$499,900
3
bds
|
3
ba
|
3,976
sqft
|
built
1951
2342 Van Buren Ave, Ogden, UT 84401
$-1,254
Cash flow
-13.1%
Cash-on-Cash Return
2.7%
Cap rate
0.4%
Rent to Value Ratio
Active
$425,000
5
bds
|
2
ba
|
1,718
sqft
|
built
1951
1284 E 22nd St, Ogden, UT 84401
$-873
Cash flow
-10.7%
Cash-on-Cash Return
3.2%
Cap rate
0.5%
Rent to Value Ratio
Active
$500,000
4
bds
|
2
ba
|
1,583
sqft
|
built
1945
848 Wood St, Ogden, UT 84404
$-1,274
Cash flow
-13.3%
Cash-on-Cash Return
2.6%
Cap rate
0.4%
Rent to Value Ratio
Active
$410,000
4
bds
|
2
ba
|
2,220
sqft
|
built
1960
720 E 850 N, Ogden, UT 84404
$-771
Cash flow
-9.8%
Cash-on-Cash Return
3.4%
Cap rate
0.5%
Rent to Value Ratio
Active
$400,000
3
bds
|
2
ba
|
2,194
sqft
|
built
1929
1137 Liberty Ave, Ogden, UT 84404
$-978
Cash flow
-12.8%
Cash-on-Cash Return
2.7%
Cap rate
0.4%
Rent to Value Ratio
Active
$294,000
2
bds
|
2
ba
|
1,214
sqft
|
built
2000
1021 Sara Ln, Ogden, UT 84404
$-747
Cash flow
-13.3%
Cash-on-Cash Return
2.6%
Cap rate
0.5%
Rent to Value Ratio
Active
$409,000
4
bds
|
2
ba
|
1,897
sqft
|
built
1907
660 23rd St, Ogden, UT 84401
$-1,025
Cash flow
-13.1%
Cash-on-Cash Return
2.7%
Cap rate
0.4%
Rent to Value Ratio

Active
$569,900
3
bds
|
2
ba
|
3,156
sqft
|
built
1946
810 Canyon Rd, Ogden, UT 84404
$-1,376
Cash flow
-12.6%
Cash-on-Cash Return
2.8%
Cap rate
0.4%
Rent to Value Ratio
Active
$275,000
1
bds
|
1
ba
|
643
sqft
|
built
1914
841 20th St, Ogden, UT 84401
$-441
Cash flow
-8.4%
Cash-on-Cash Return
3.8%
Cap rate
0.5%
Rent to Value Ratio
Active
$460,000
4
bds
|
2
ba
|
1,486
sqft
|
built
2003
109 E 1875 N, Ogden, UT 84414
$-1,066
Cash flow
-12.1%
Cash-on-Cash Return
2.9%
Cap rate
0.4%
Rent to Value Ratio

Active
$477,000
2
bds
|
2
ba
|
1,426
sqft
|
built
2007
793 E 2025 N, Ogden, UT 84414
$-985
Cash flow
-10.8%
Cash-on-Cash Return
3.2%
Cap rate
0.5%
Rent to Value Ratio