Boynton Beach, FL Investment Properties for Sale
Browse homes for sale and investment properties in Boynton Beach, FL. Refine your search by price, property type, or more.
Best cash flowing properties in Boynton Beach, FL
Active
$159,900
1
bds
|
1
ba
|
704
sqft
|
built
1986
1626 Meadows Cir W, Boynton Beach, FL 33436
$-257
Cash flow
-8.4%
Cash-on-Cash Return
4.4%
Cap rate
1.1%
Rent to Value Ratio

Active
$210,000
2
bds
|
2
ba
|
864
sqft
|
built
1985
15 Crossings Cir, Boynton Beach, FL 33435
$-337
Cash flow
-8.4%
Cash-on-Cash Return
4.4%
Cap rate
1.0%
Rent to Value Ratio
612 out of 707 properties for sale in Boynton Beach, FL
Limited Results Shown
Create a free account, or log in to reveal all property listings and enjoy the complete experience.
Active
$425,000
2
bds
|
2
ba
|
1,665
sqft
|
built
1955
3260 E Atlantic Dr, Boynton Beach, FL 33435
$-752
Cash flow
-9.2%
Cash-on-Cash Return
4.2%
Cap rate
0.6%
Rent to Value Ratio

Active
$698,000
4
bds
|
2
ba
|
2,154
sqft
|
built
1991
6446 Terra Rosa Cir, Boynton Beach, FL 33472
$-1,536
Cash flow
-11.5%
Cash-on-Cash Return
3.6%
Cap rate
0.6%
Rent to Value Ratio
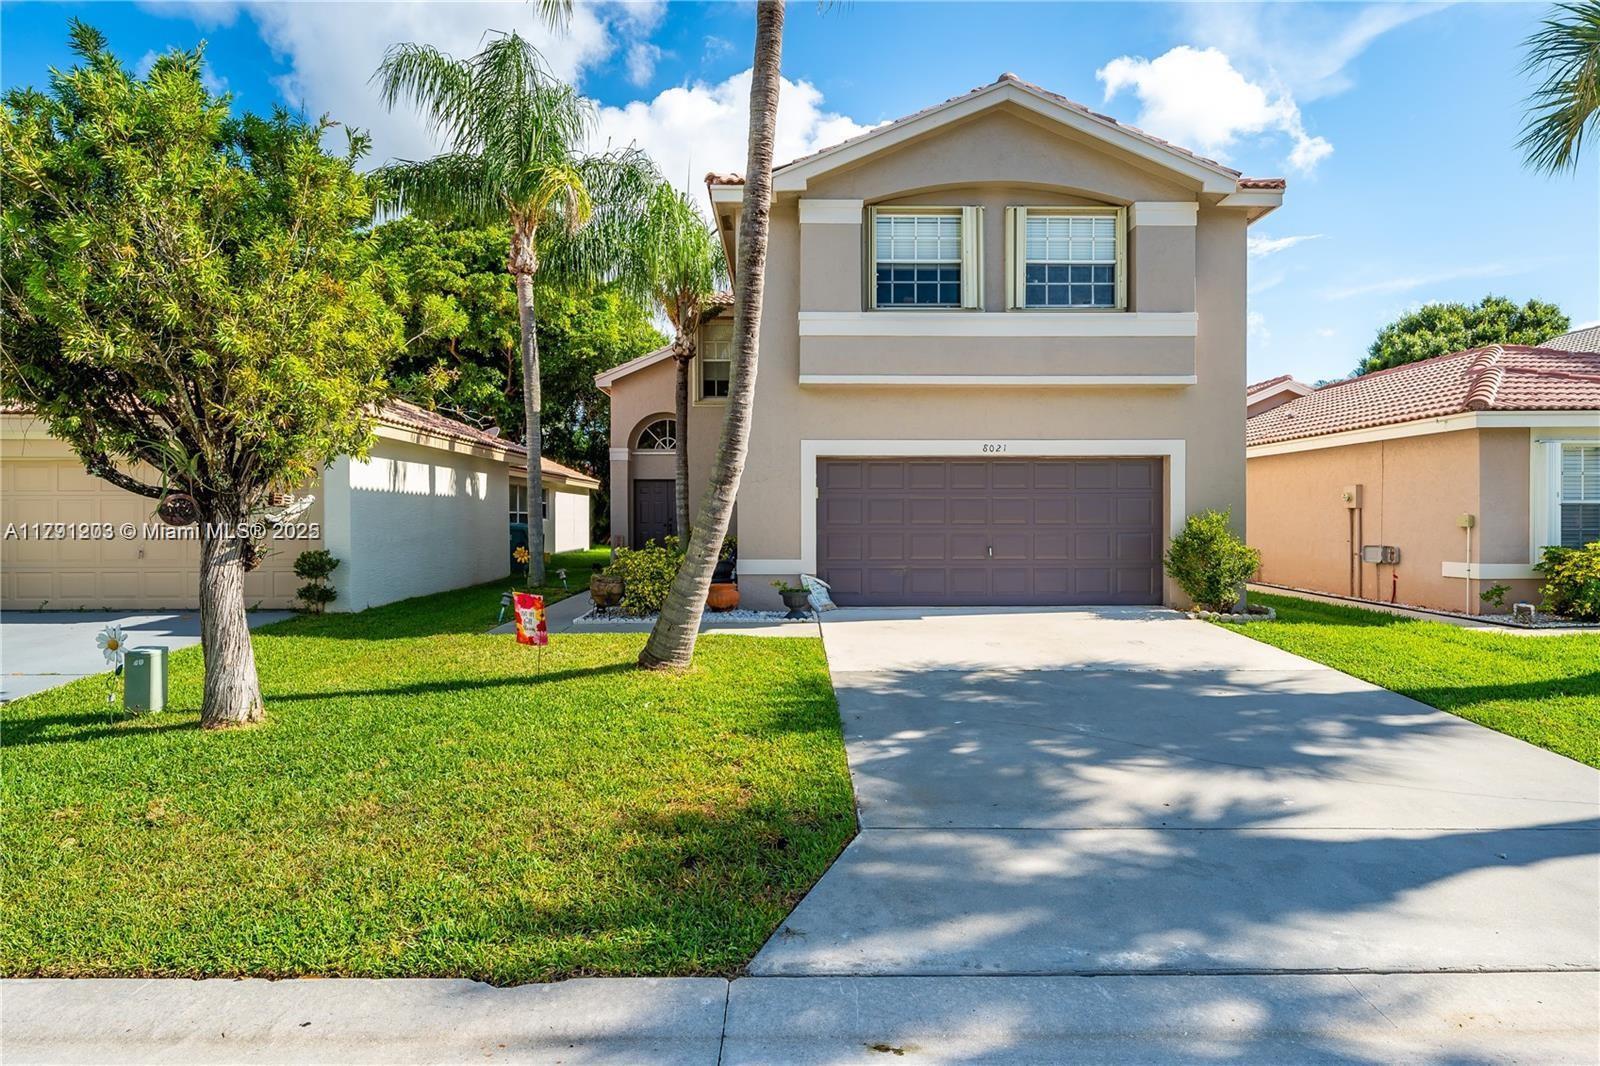
Active
$605,000
4
bds
|
3
ba
|
2,299
sqft
|
built
1997
8021 Stirrup Cay Ct, Boynton Beach, FL 33436
$-943
Cash flow
-8.1%
Cash-on-Cash Return
4.4%
Cap rate
0.6%
Rent to Value Ratio
Active
$589,900
3
bds
|
3
ba
|
2,655
sqft
|
built
2004
7209 Shady Grove Ln, Boynton Beach, FL 33436
$-1,005
Cash flow
-8.9%
Cash-on-Cash Return
4.2%
Cap rate
0.7%
Rent to Value Ratio
Active
$340,000
2
bds
|
2
ba
|
1,030
sqft
|
built
2002
2319 Tuscany Way, Boynton Beach, FL 33435
$-1,069
Cash flow
-16.4%
Cash-on-Cash Return
2.5%
Cap rate
0.7%
Rent to Value Ratio
Active
$690,000
3
bds
|
2
ba
|
1,941
sqft
|
built
2005
26 Country Lake Cir, Boynton Beach, FL 33436
$-1,228
Cash flow
-9.3%
Cash-on-Cash Return
4.1%
Cap rate
0.7%
Rent to Value Ratio
Active
$499,900
2
bds
|
2
ba
|
1,901
sqft
|
built
1998
3922 Diamond Palladium Ter, Boynton Beach, FL 33436
$-1,353
Cash flow
-14.1%
Cash-on-Cash Return
3.0%
Cap rate
0.6%
Rent to Value Ratio
Active
$799,000
3
bds
|
3
ba
|
1,875
sqft
|
built
2004
132 Harbors Way, Boynton Beach, FL 33435
$-2,854
Cash flow
-18.6%
Cash-on-Cash Return
2.0%
Cap rate
0.5%
Rent to Value Ratio
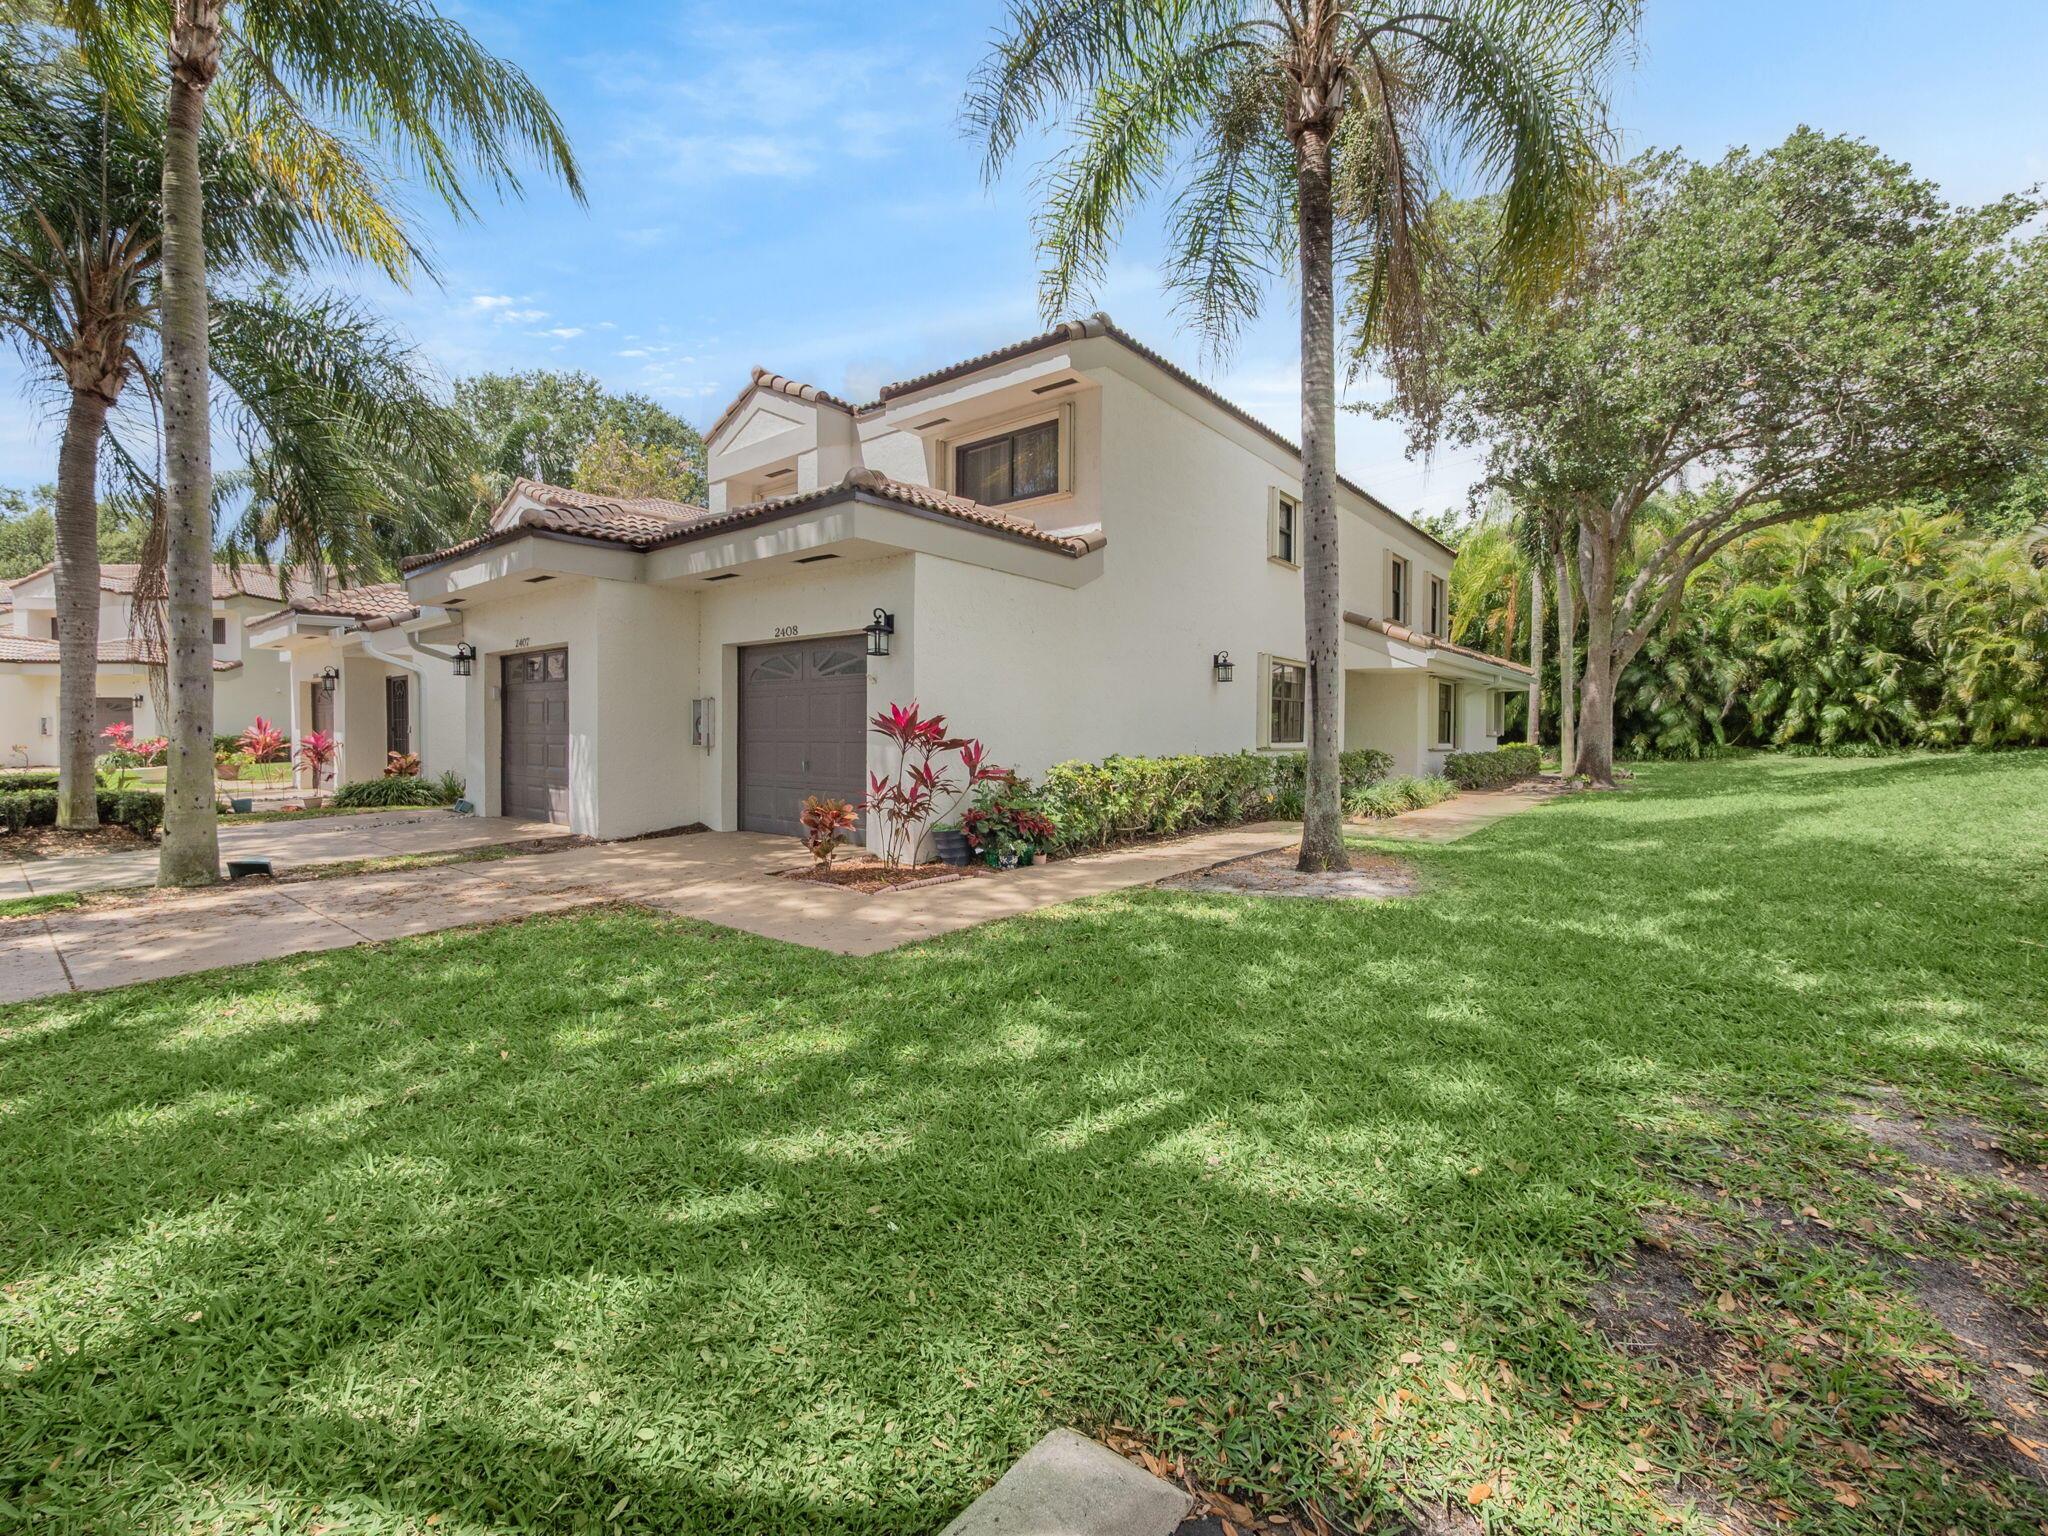
Active
$379,000
3
bds
|
2
ba
|
1,375
sqft
|
built
1990
2408 Aspen Way, Boynton Beach, FL 33436
$-1,192
Cash flow
-16.4%
Cash-on-Cash Return
2.5%
Cap rate
0.8%
Rent to Value Ratio
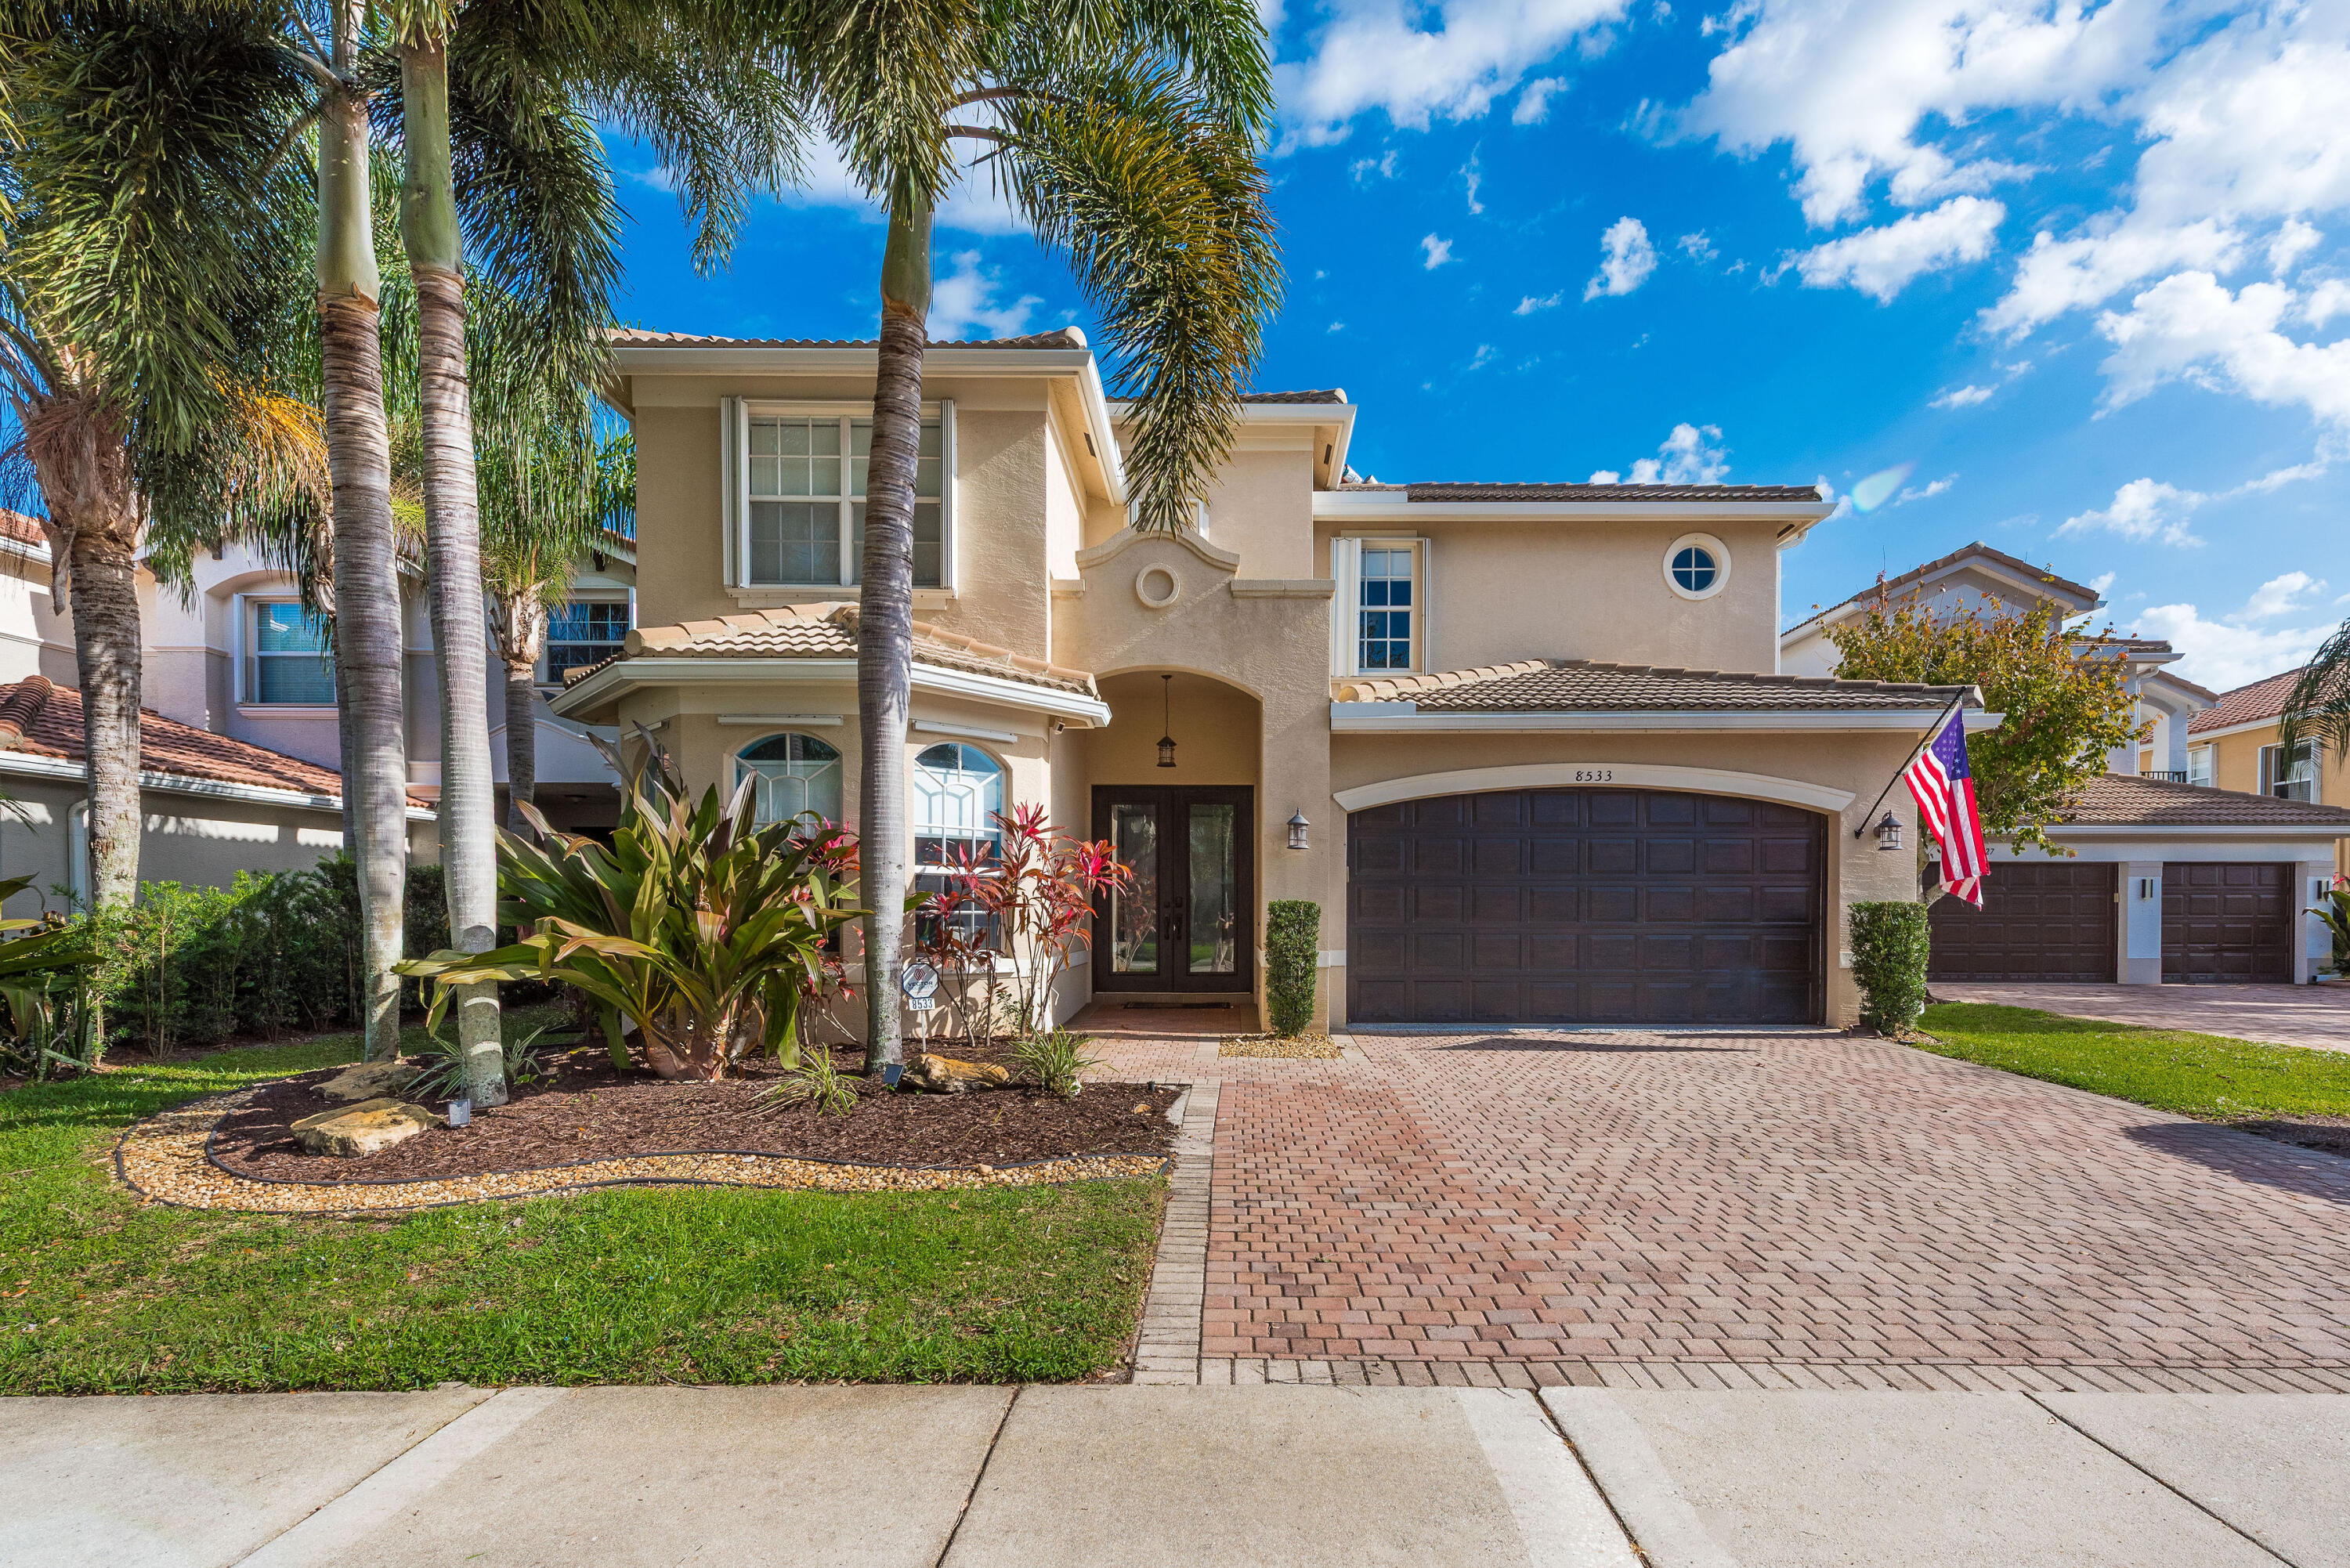
Active
$1,165,000
5
bds
|
4
ba
|
3,507
sqft
|
built
2007
8533 Briar Rose Pt, Boynton Beach, FL 33473
$-3,817
Cash flow
-17.1%
Cash-on-Cash Return
2.4%
Cap rate
0.4%
Rent to Value Ratio
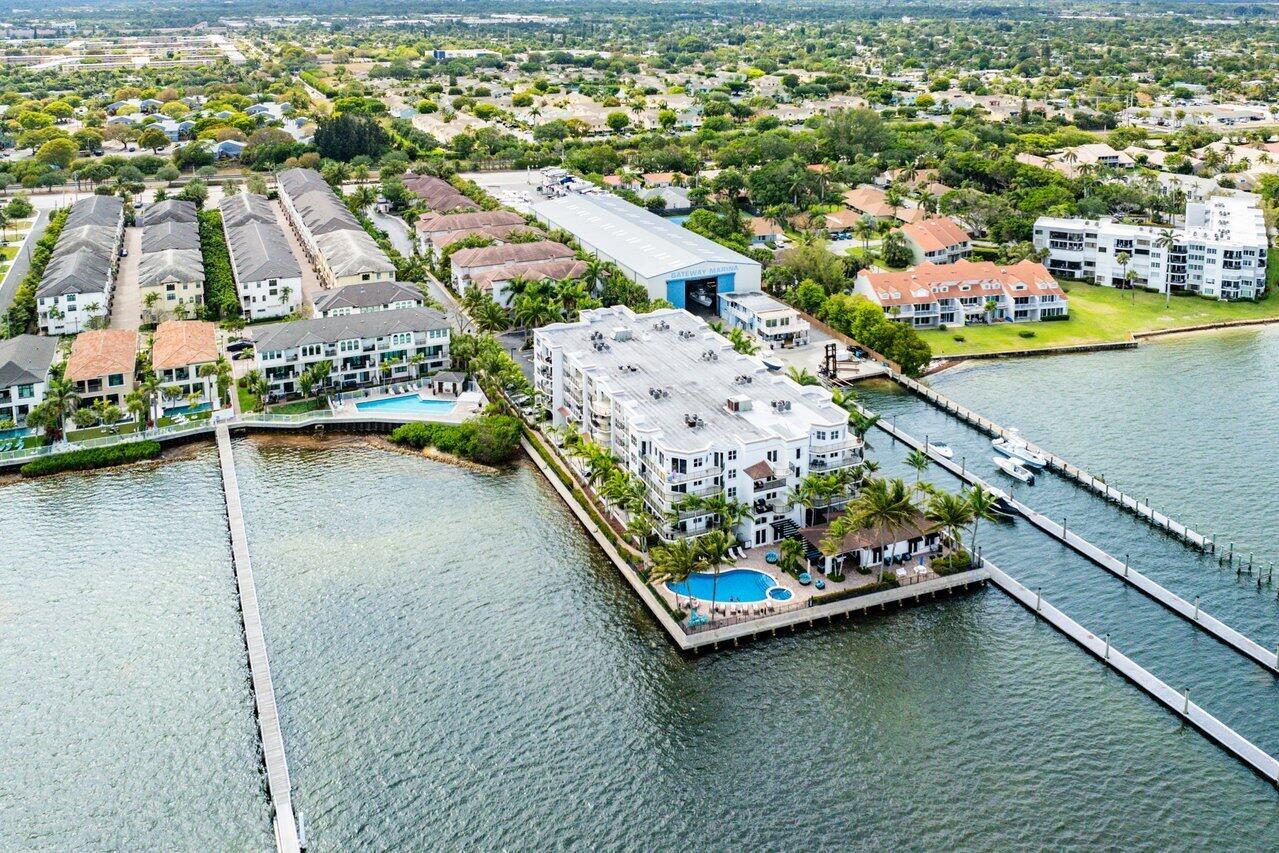
Active
$585,000
3
bds
|
4
ba
|
1,822
sqft
|
built
2011
2678 N Federal Hwy, Boynton Beach, FL 33435
$-1,647
Cash flow
-14.7%
Cash-on-Cash Return
2.9%
Cap rate
0.7%
Rent to Value Ratio
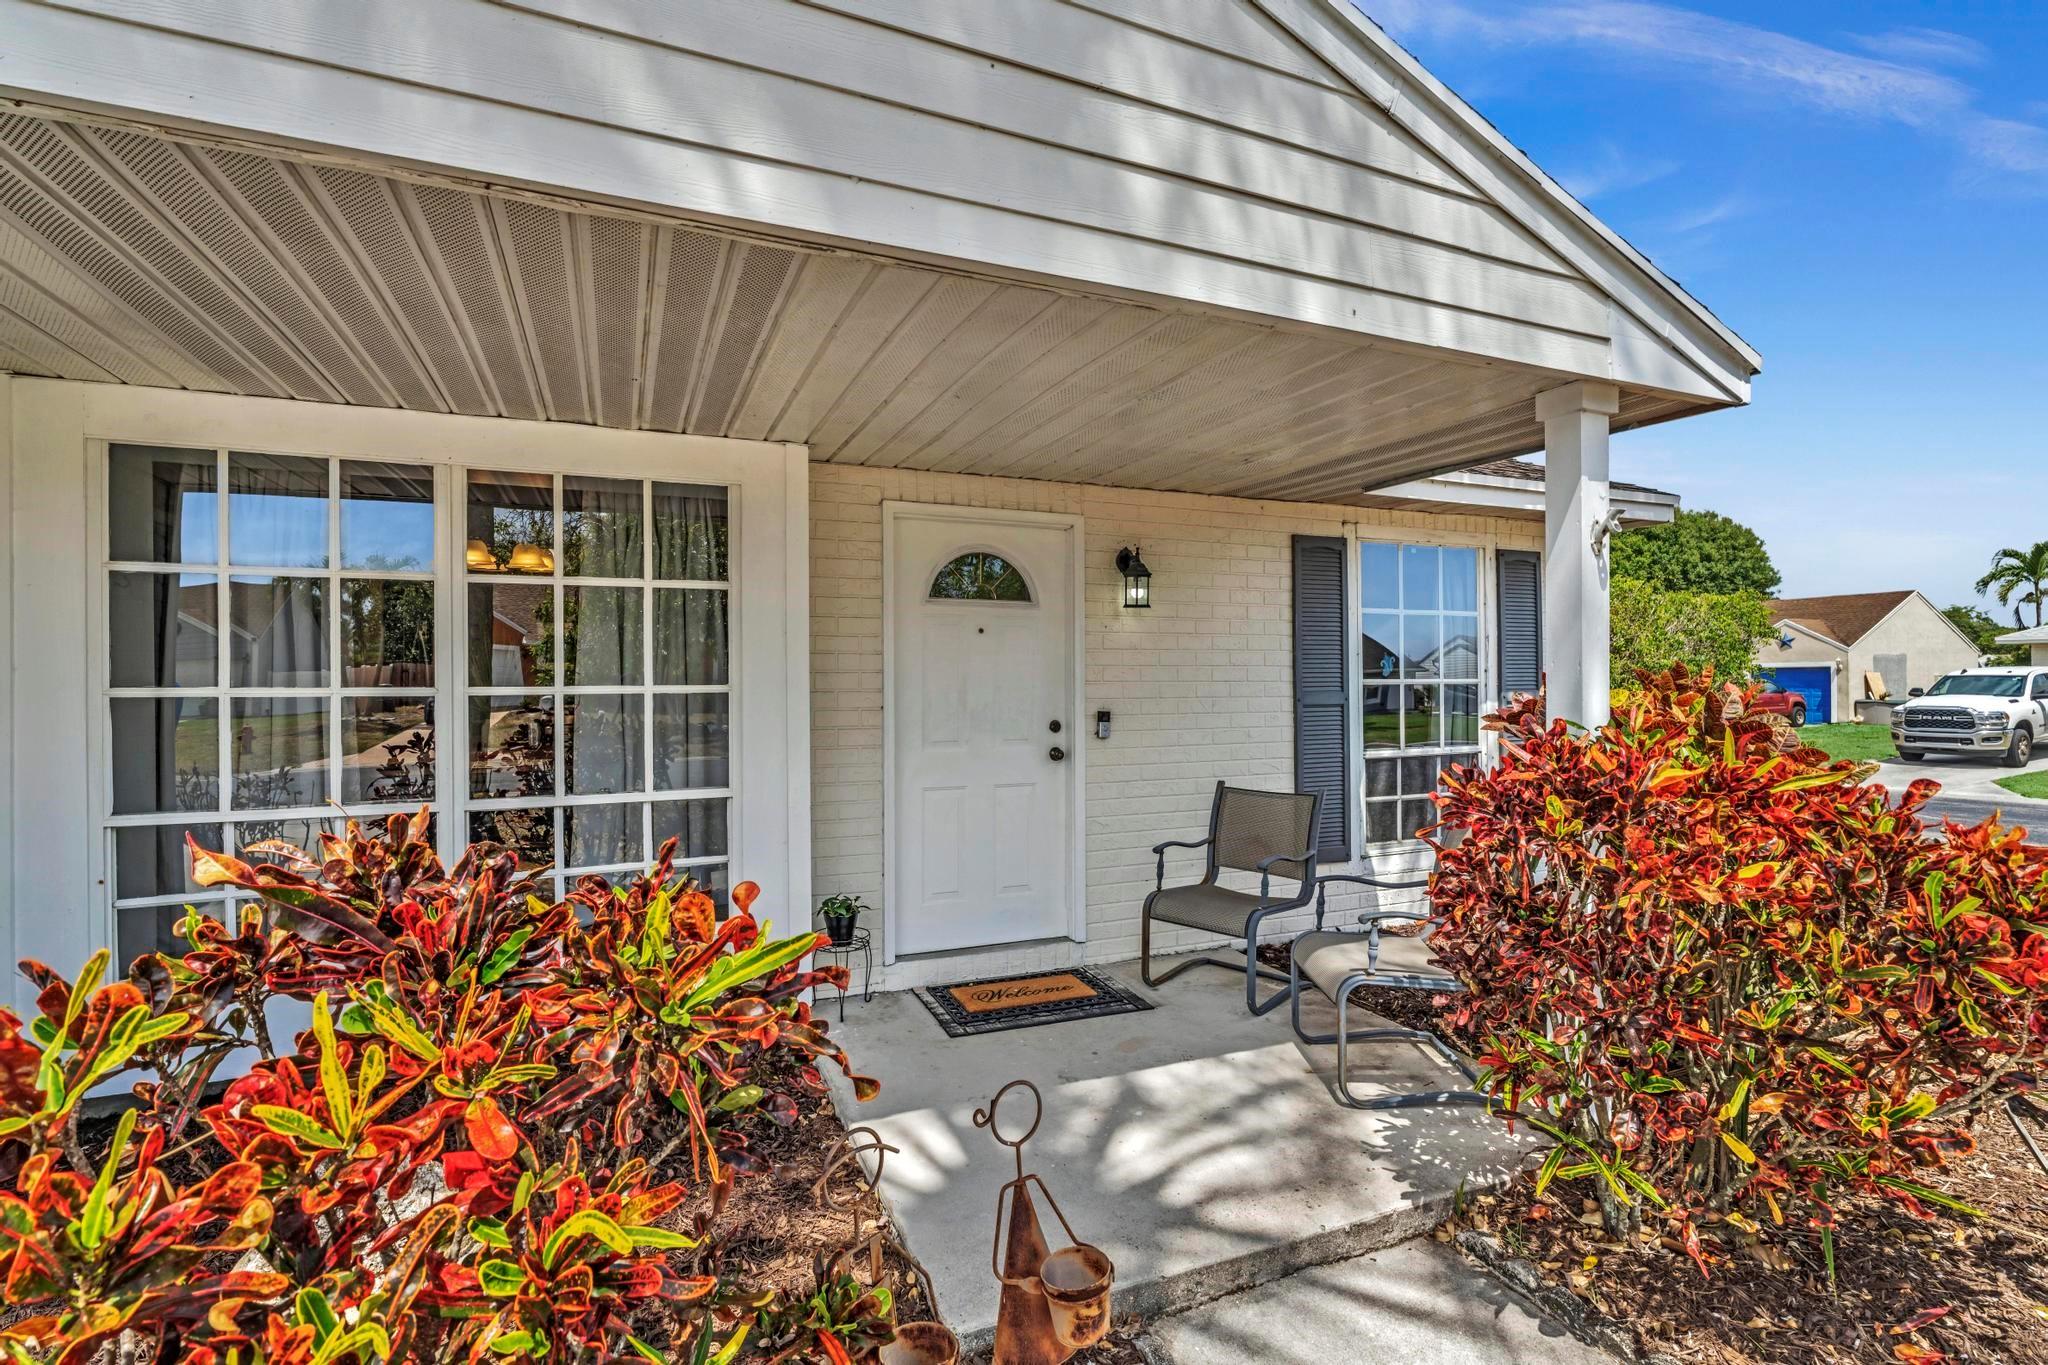
Active under contract
$375,000
2
bds
|
1
ba
|
946
sqft
|
built
1986
8727 Spring Valley Dr, Boynton Beach, FL 33472
$-506
Cash flow
-7.0%
Cash-on-Cash Return
4.7%
Cap rate
0.7%
Rent to Value Ratio
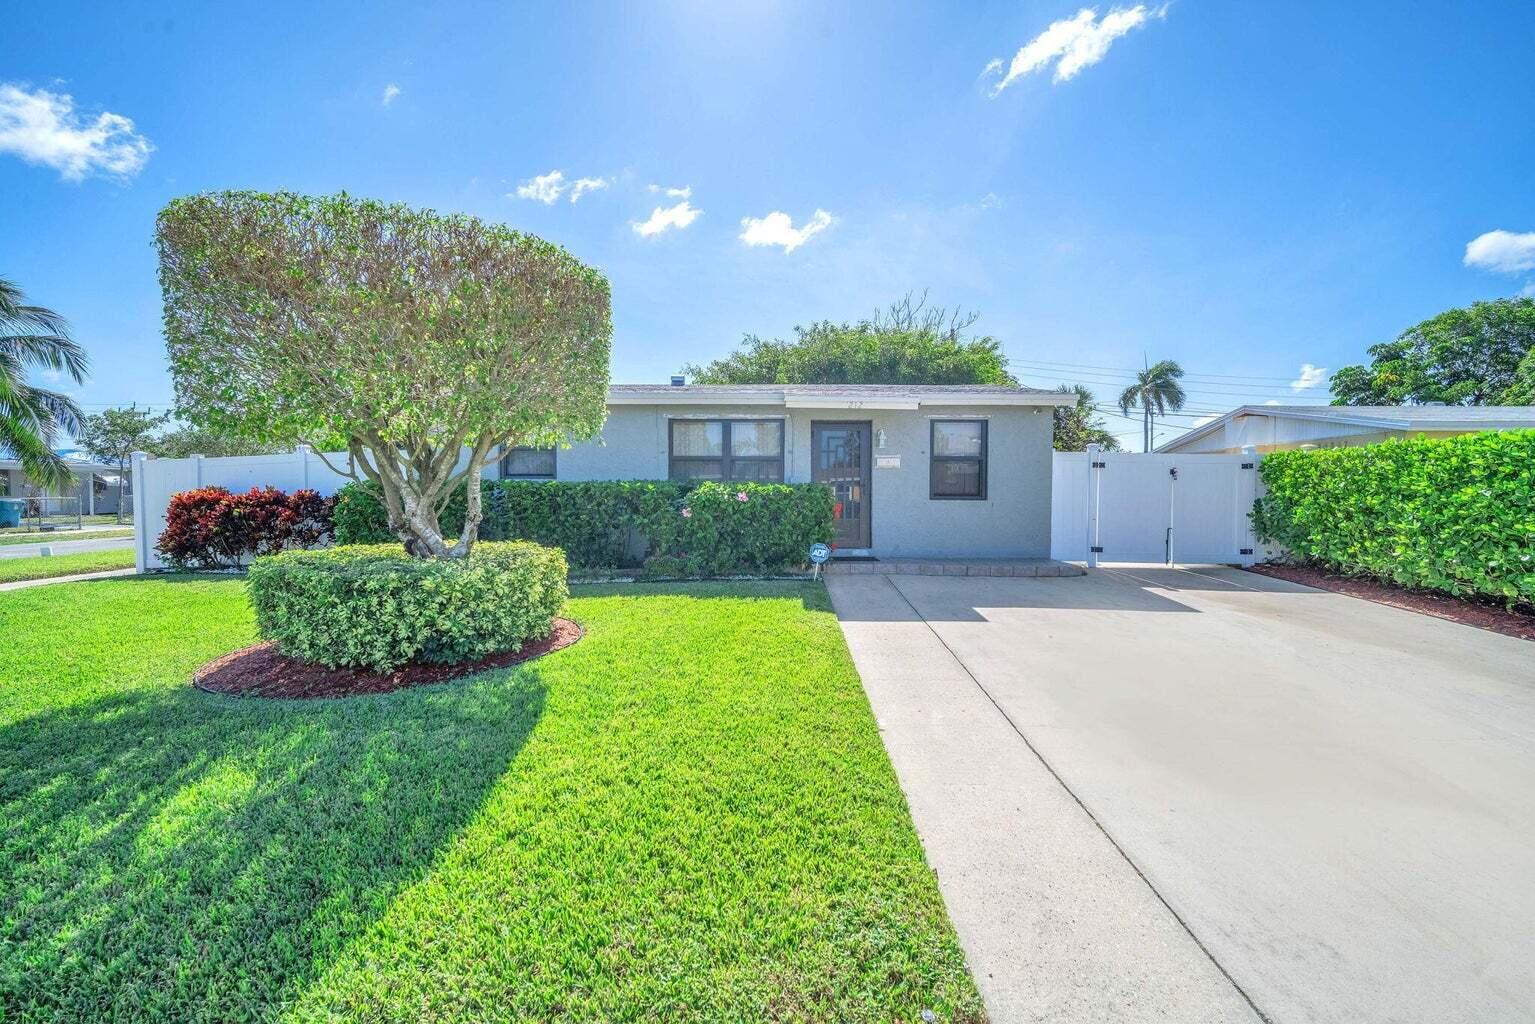
Active
$340,000
3
bds
|
1
ba
|
828
sqft
|
built
1960
212 NW 11th Ave, Boynton Beach, FL 33435
$-792
Cash flow
-12.2%
Cash-on-Cash Return
3.5%
Cap rate
0.7%
Rent to Value Ratio
Active
$665,000
4
bds
|
3
ba
|
2,655
sqft
|
built
2004
4087 Woodhill Pl, Boynton Beach, FL 33436
$-1,751
Cash flow
-13.7%
Cash-on-Cash Return
3.1%
Cap rate
0.6%
Rent to Value Ratio
Active
$364,000
3
bds
|
2
ba
|
1,580
sqft
|
built
1989
9761 Nickels Blvd, Boynton Beach, FL 33436
$-1,056
Cash flow
-15.1%
Cash-on-Cash Return
2.8%
Cap rate
0.8%
Rent to Value Ratio
Active
$259,000
3
bds
|
2
ba
|
1,578
sqft
|
built
1995
5229 Brisata Cir, Boynton Beach, FL 33437
$-746
Cash flow
-15.0%
Cash-on-Cash Return
2.8%
Cap rate
1.0%
Rent to Value Ratio
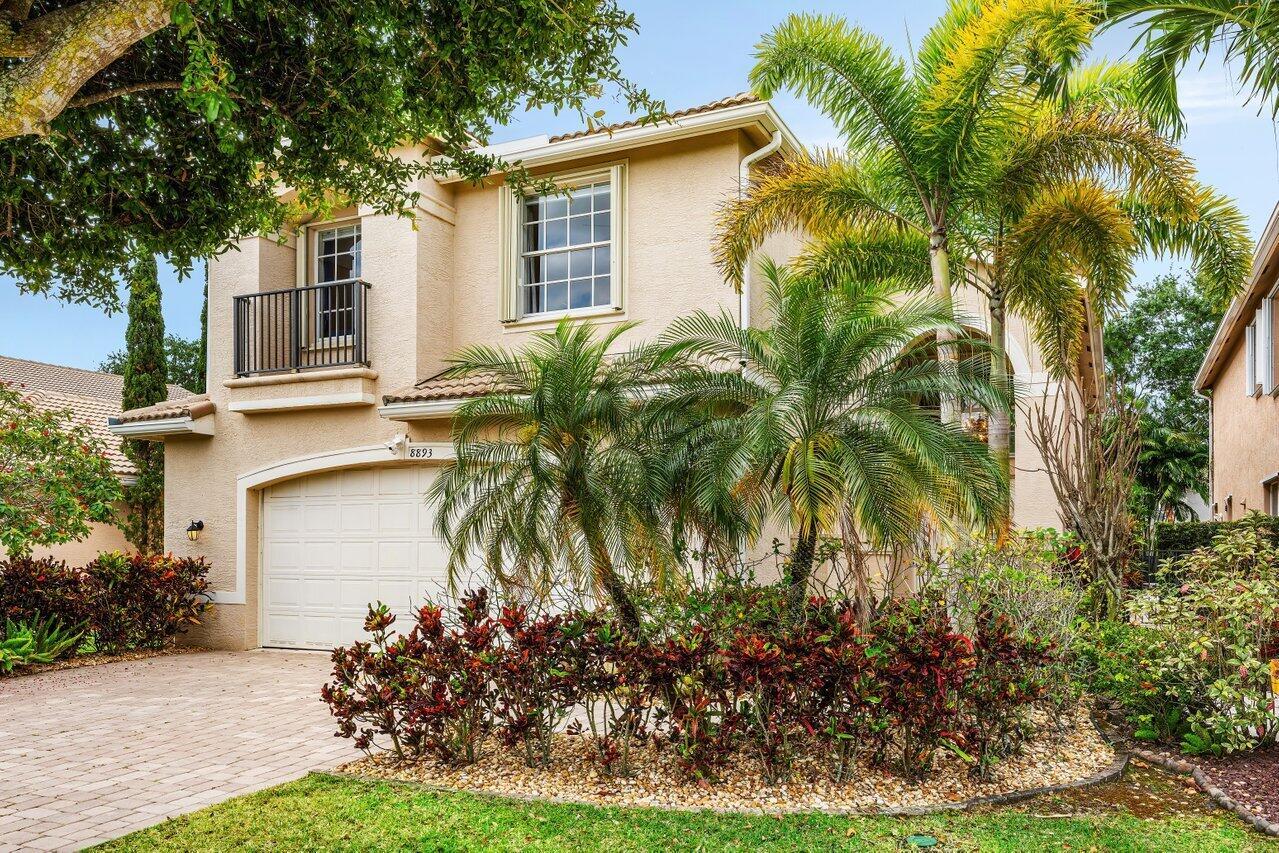
Active
$785,000
4
bds
|
3
ba
|
2,737
sqft
|
built
2006
8893 Sandy Crest Ln, Boynton Beach, FL 33473
$-2,049
Cash flow
-13.6%
Cash-on-Cash Return
3.2%
Cap rate
0.6%
Rent to Value Ratio
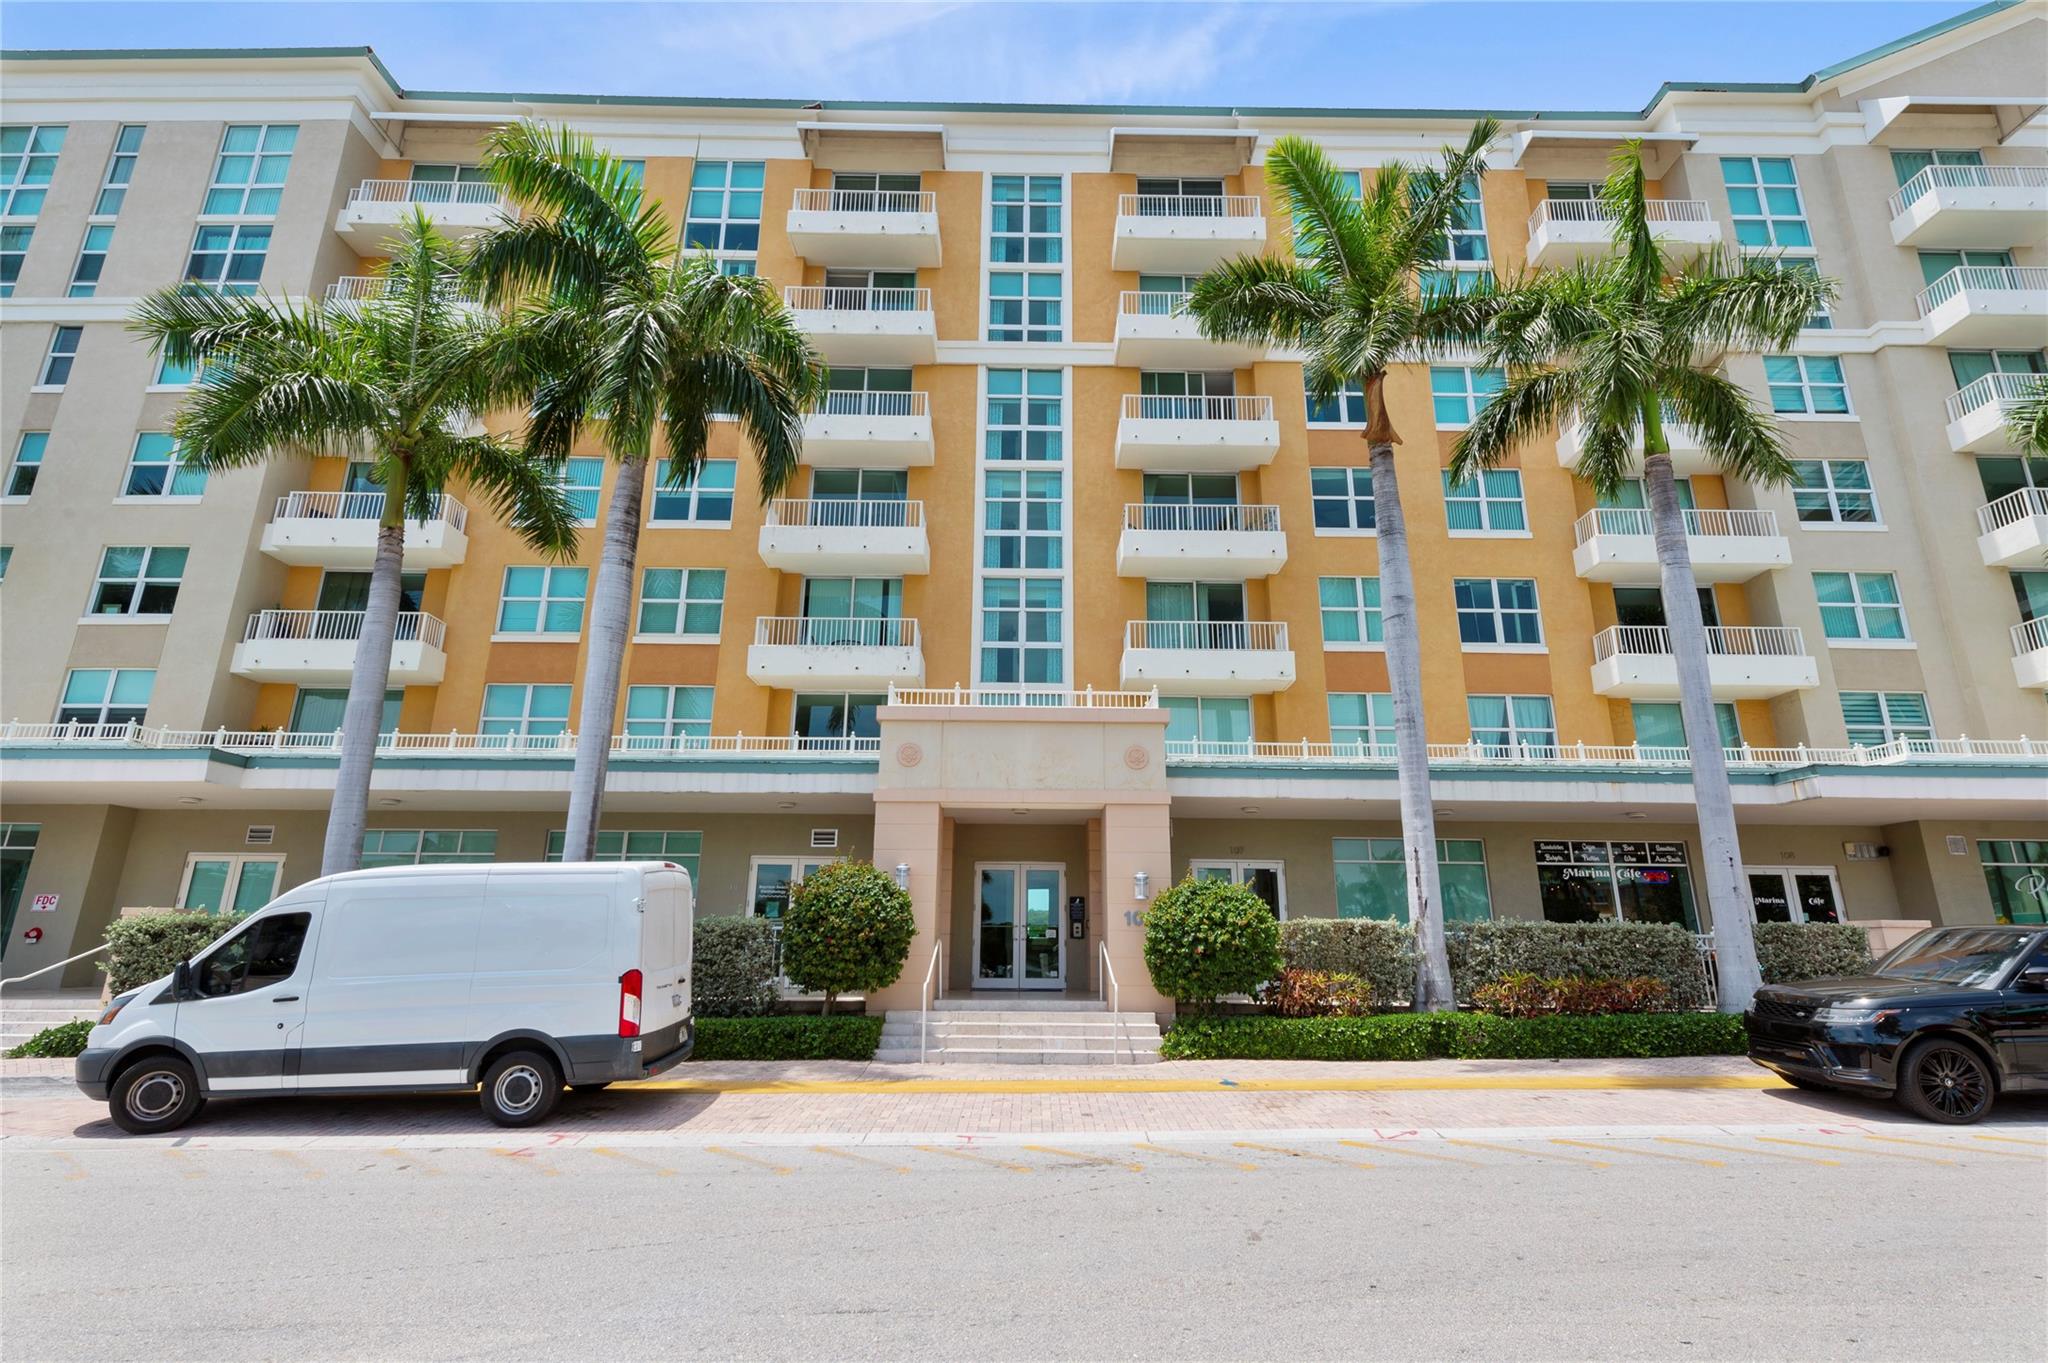
Active
$289,900
1
bds
|
1
ba
|
691
sqft
|
built
2006
100 NE 6th St, Boynton Beach, FL 33435
$-1,031
Cash flow
-18.6%
Cash-on-Cash Return
2.0%
Cap rate
0.8%
Rent to Value Ratio
Active
$159,900
1
bds
|
1
ba
|
704
sqft
|
built
1986
1626 Meadows Cir W, Boynton Beach, FL 33436
$-257
Cash flow
-8.4%
Cash-on-Cash Return
4.4%
Cap rate
1.1%
Rent to Value Ratio
Active
$635,000
4
bds
|
3
ba
|
2,299
sqft
|
built
1996
8300 Bermuda Sound Way, Boynton Beach, FL 33436
$-1,130
Cash flow
-9.3%
Cash-on-Cash Return
4.1%
Cap rate
0.6%
Rent to Value Ratio
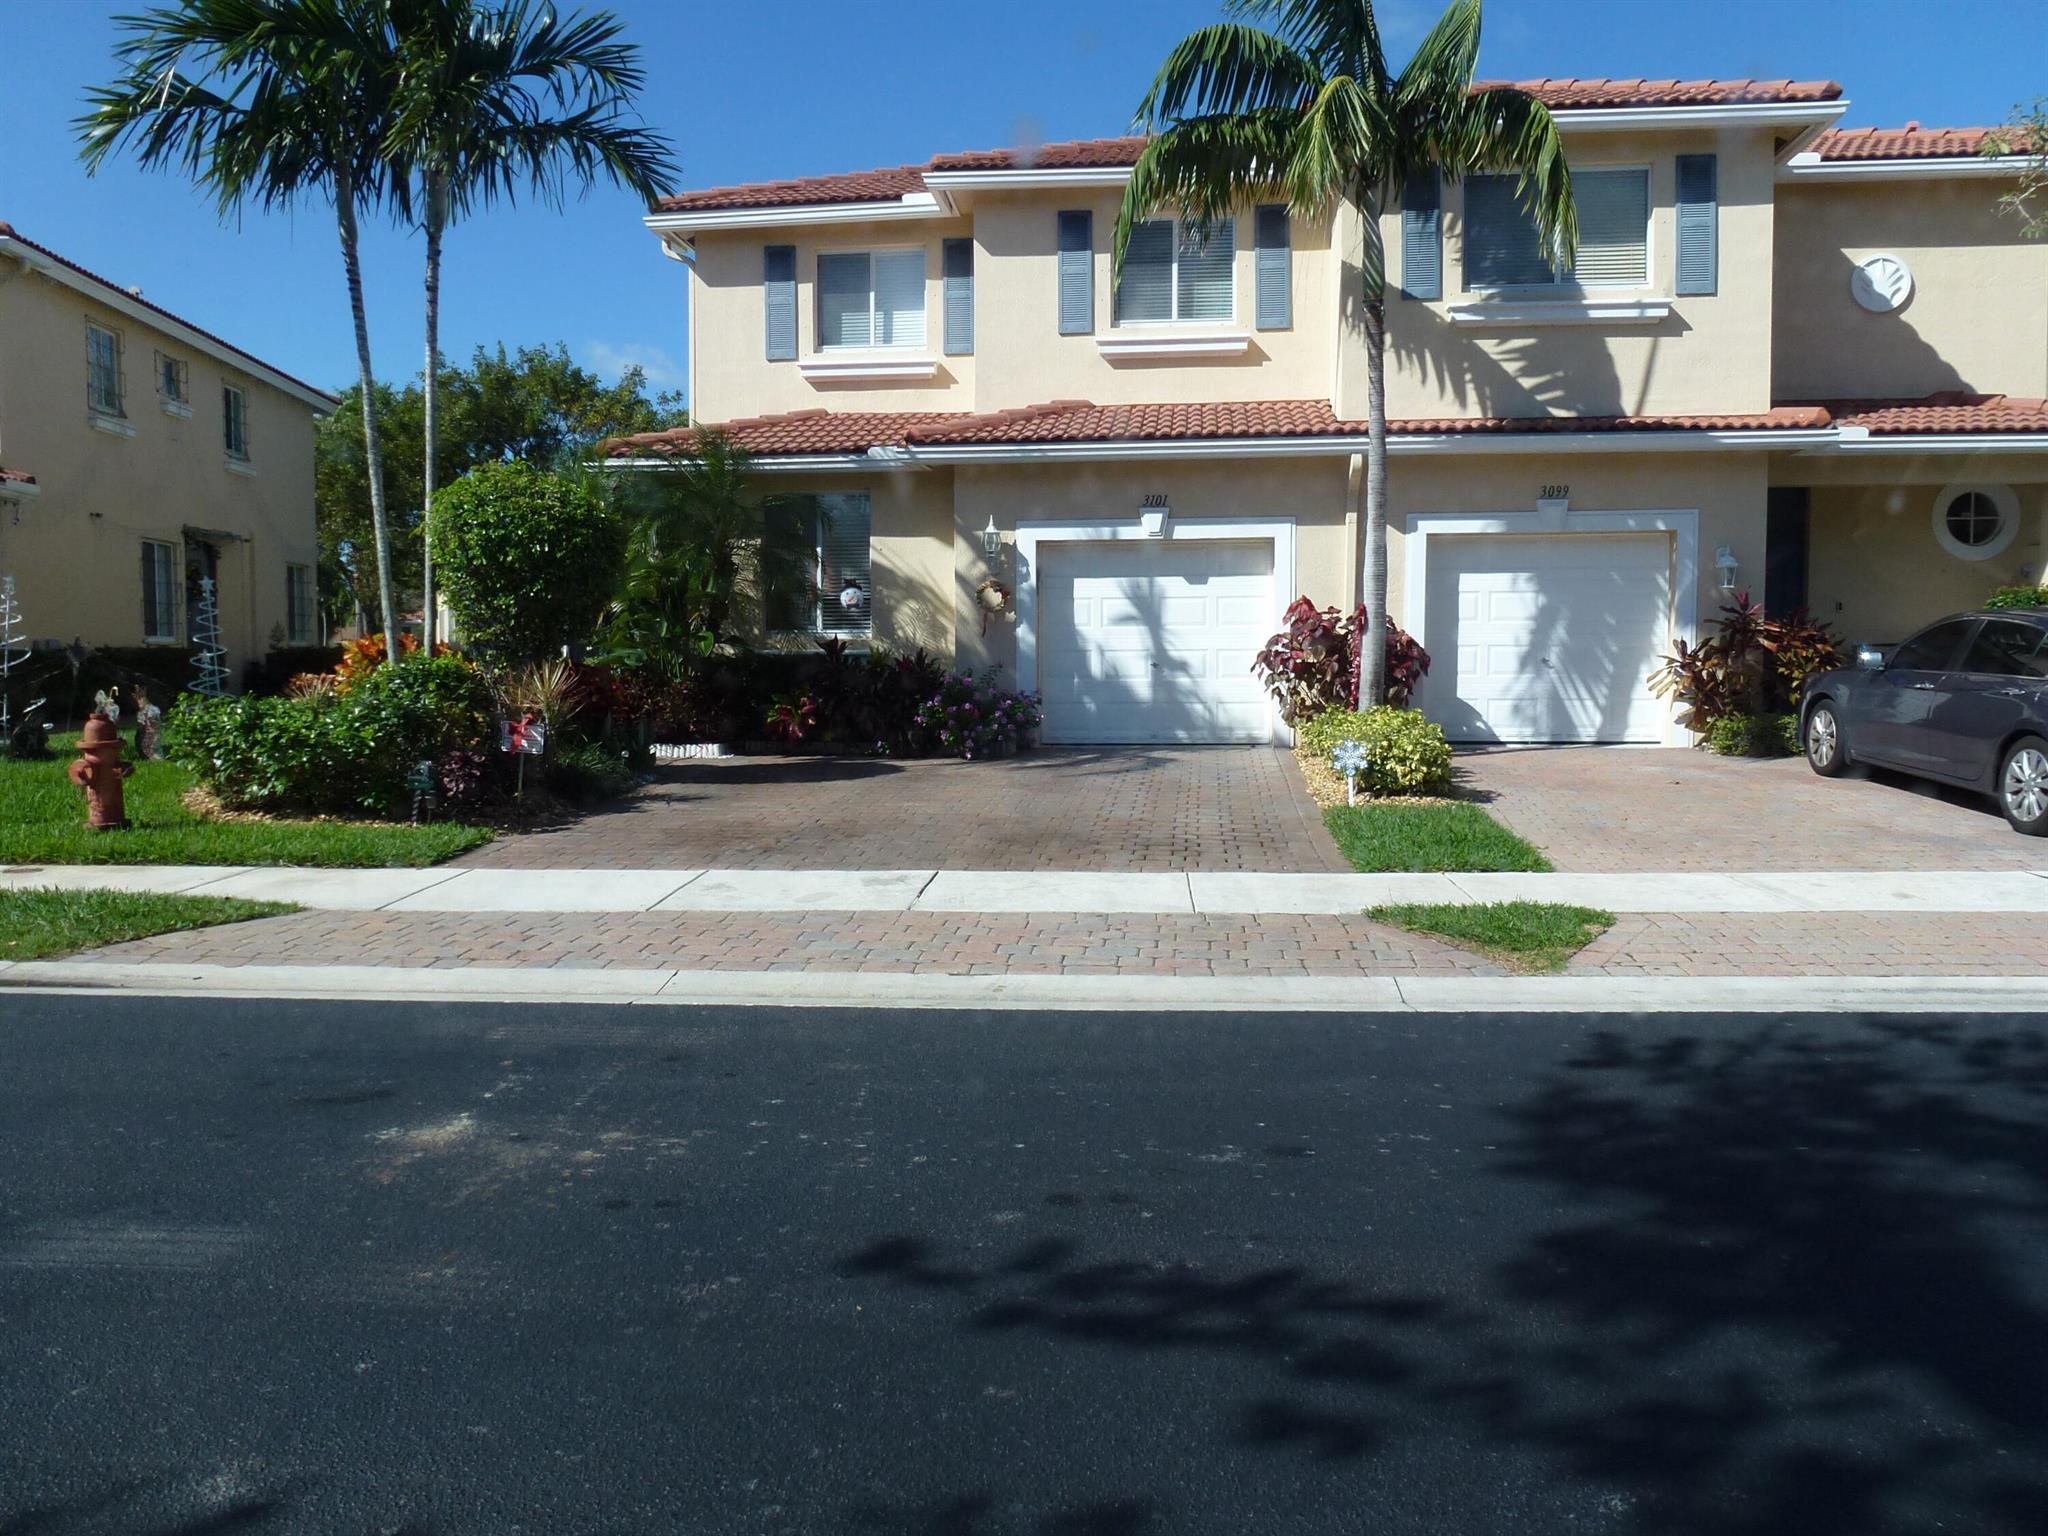
Pending
$420,000
3
bds
|
3
ba
|
1,684
sqft
|
built
2004
3101 N Evergreen Cir, Boynton Beach, FL 33426
$-577
Cash flow
-7.2%
Cash-on-Cash Return
4.6%
Cap rate
0.7%
Rent to Value Ratio
Active
$1,445,000
6
bds
|
6
ba
|
4,504
sqft
|
built
2014
8207 Venosa Haven Ter, Boynton Beach, FL 33473
$-3,986
Cash flow
-14.4%
Cash-on-Cash Return
3.0%
Cap rate
0.5%
Rent to Value Ratio
Active
$575,000
3
bds
|
2
ba
|
1,782
sqft
|
built
2000
113 Citrus Park Cir, Boynton Beach, FL 33436
$-1,380
Cash flow
-12.5%
Cash-on-Cash Return
3.4%
Cap rate
0.6%
Rent to Value Ratio
Active
$399,900
2
bds
|
3
ba
|
1,502
sqft
|
built
2001
8127 Bellagio Ln, Boynton Beach, FL 33472
$-912
Cash flow
-11.9%
Cash-on-Cash Return
3.5%
Cap rate
0.7%
Rent to Value Ratio
Active
$369,000
3
bds
|
3
ba
|
1,441
sqft
|
built
2007
6635 Old Farm Trl, Boynton Beach, FL 33437
$-996
Cash flow
-14.1%
Cash-on-Cash Return
3.0%
Cap rate
0.8%
Rent to Value Ratio
Active
$340,000
2
bds
|
3
ba
|
1,500
sqft
|
built
1979
2717 SE 27th Way, Boynton Beach, FL 33435
$-1,092
Cash flow
-16.8%
Cash-on-Cash Return
2.4%
Cap rate
0.7%
Rent to Value Ratio
Active
$305,000
3
bds
|
2
ba
|
1,347
sqft
|
built
1993
5155 Europa Dr, Boynton Beach, FL 33437
$-881
Cash flow
-15.1%
Cash-on-Cash Return
2.8%
Cap rate
1.0%
Rent to Value Ratio
Active
$815,000
4
bds
|
3
ba
|
2,737
sqft
|
built
2006
8876 Sandy Crest Ln, Boynton Beach, FL 33473
$-2,456
Cash flow
-15.7%
Cash-on-Cash Return
2.7%
Cap rate
0.5%
Rent to Value Ratio
Active under contract
$499,000
3
bds
|
2
ba
|
1,238
sqft
|
built
1951
1008 SE 3rd St, Boynton Beach, FL 33435
$-1,131
Cash flow
-11.8%
Cash-on-Cash Return
3.6%
Cap rate
0.6%
Rent to Value Ratio
Active
$489,000
3
bds
|
2
ba
|
1,872
sqft
|
built
1952
310 SW 1st Ave, Boynton Beach, FL 33435
$-715
Cash flow
-7.6%
Cash-on-Cash Return
4.5%
Cap rate
0.6%
Rent to Value Ratio

Active
$1,195,999
4
bds
|
5
ba
|
3,312
sqft
|
built
2017
9091 Grand Prix Ln, Boynton Beach, FL 33472
$-2,082
Cash flow
-9.1%
Cash-on-Cash Return
4.2%
Cap rate
0.7%
Rent to Value Ratio
Active
$628,000
4
bds
|
3
ba
|
2,655
sqft
|
built
2004
7109 Old Orchard Way, Boynton Beach, FL 33436
$-1,569
Cash flow
-13.0%
Cash-on-Cash Return
3.3%
Cap rate
0.6%
Rent to Value Ratio
Active
$285,000
2
bds
|
2
ba
|
1,147
sqft
|
built
1990
9794 Nickels Blvd, Boynton Beach, FL 33436
$-748
Cash flow
-13.7%
Cash-on-Cash Return
3.1%
Cap rate
0.8%
Rent to Value Ratio
Active
$210,000
2
bds
|
2
ba
|
864
sqft
|
built
1985
15 Crossings Cir, Boynton Beach, FL 33435
$-337
Cash flow
-8.4%
Cash-on-Cash Return
4.4%
Cap rate
1.0%
Rent to Value Ratio
Active
$345,000
2
bds
|
2
ba
|
1,030
sqft
|
built
2002
2221 Tuscany Way, Boynton Beach, FL 33435
$-1,600
Cash flow
-24.2%
Cash-on-Cash Return
0.7%
Cap rate
0.7%
Rent to Value Ratio
Active
$189,000
2
bds
|
2
ba
|
921
sqft
|
built
1986
420 Meadows Cir, Boynton Beach, FL 33436
$-559
Cash flow
-15.4%
Cash-on-Cash Return
2.7%
Cap rate
1.1%
Rent to Value Ratio

Active
$235,000
2
bds
|
2
ba
|
1,131
sqft
|
built
1990
5439 Verona Dr, Boynton Beach, FL 33437
$-597
Cash flow
-13.3%
Cash-on-Cash Return
3.2%
Cap rate
1.1%
Rent to Value Ratio
Active
$309,999
2
bds
|
2
ba
|
908
sqft
|
built
1974
740 E Ocean Ave, Boynton Beach, FL 33435
$-951
Cash flow
-16.0%
Cash-on-Cash Return
2.6%
Cap rate
0.8%
Rent to Value Ratio
Active
$1,795,000
3
bds
|
2
ba
|
1,907
sqft
|
built
1959
902 SW 27th Pl, Boynton Beach, FL 33435
$-7,145
Cash flow
-20.8%
Cash-on-Cash Return
1.5%
Cap rate
0.2%
Rent to Value Ratio
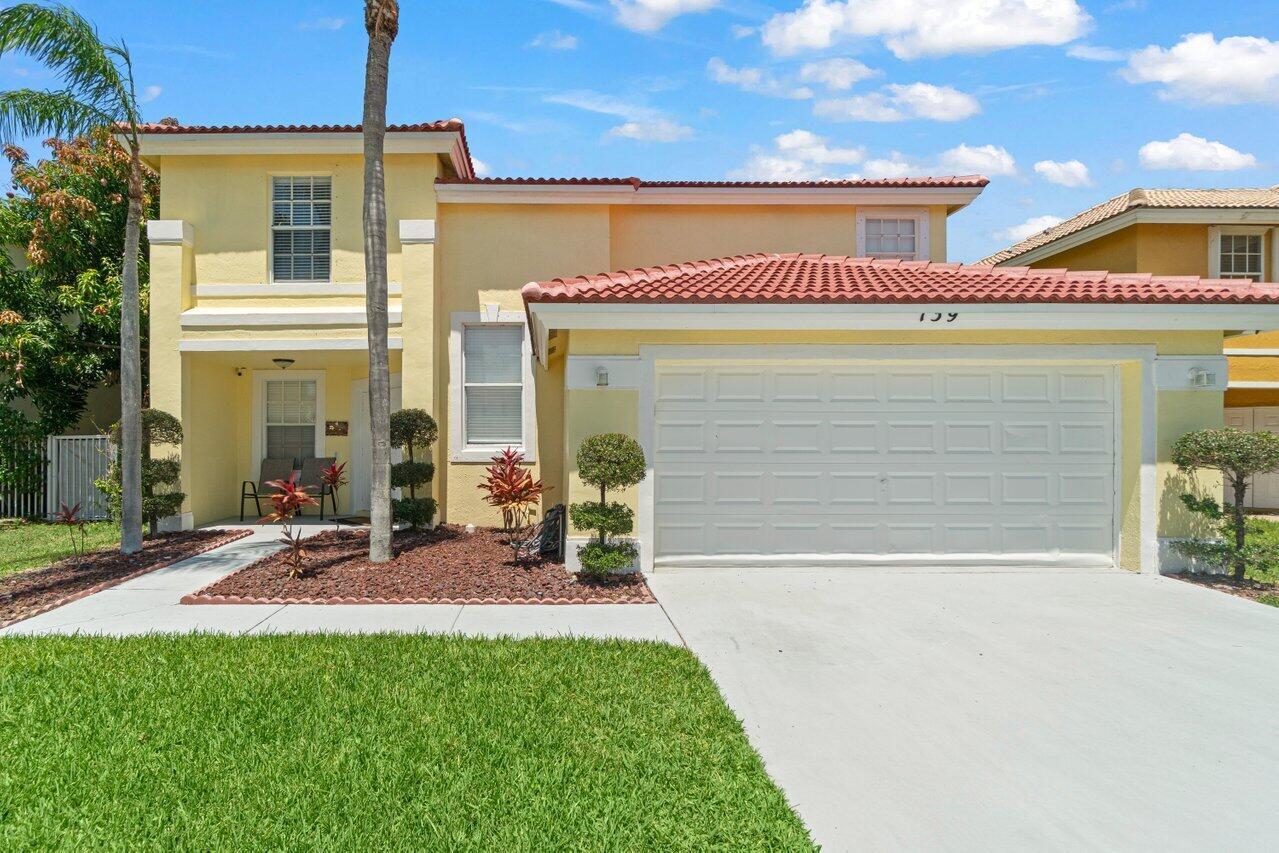
Active
$635,000
4
bds
|
3
ba
|
2,208
sqft
|
built
2000
139 Citrus Park Cir, Boynton Beach, FL 33436
$-1,712
Cash flow
-14.1%
Cash-on-Cash Return
3.0%
Cap rate
0.6%
Rent to Value Ratio