Boynton Beach, FL Investment Properties for Sale
Browse homes for sale and investment properties in Boynton Beach, FL. Refine your search by price, property type, or more.
Best cash flowing properties in Boynton Beach, FL
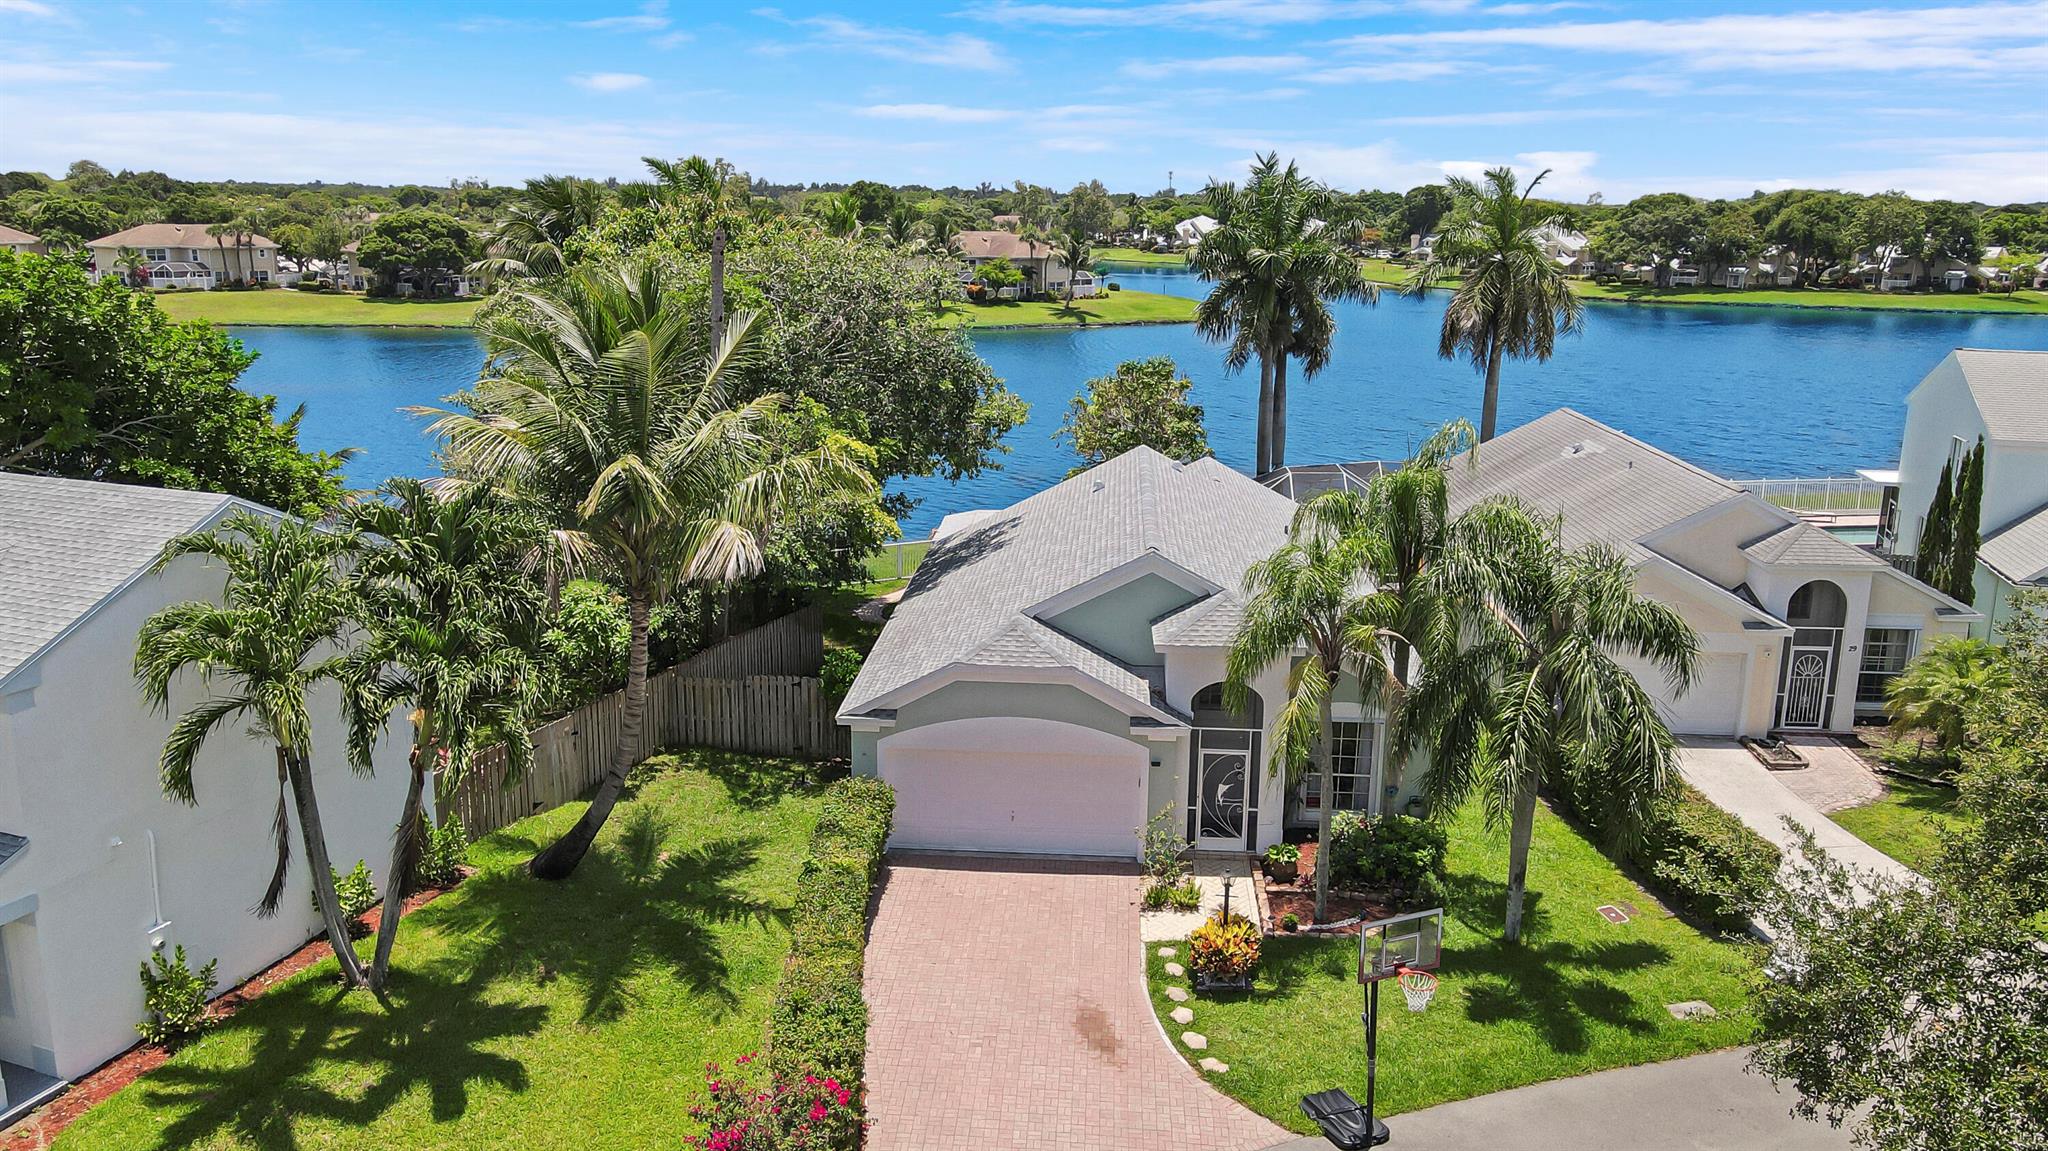
Active
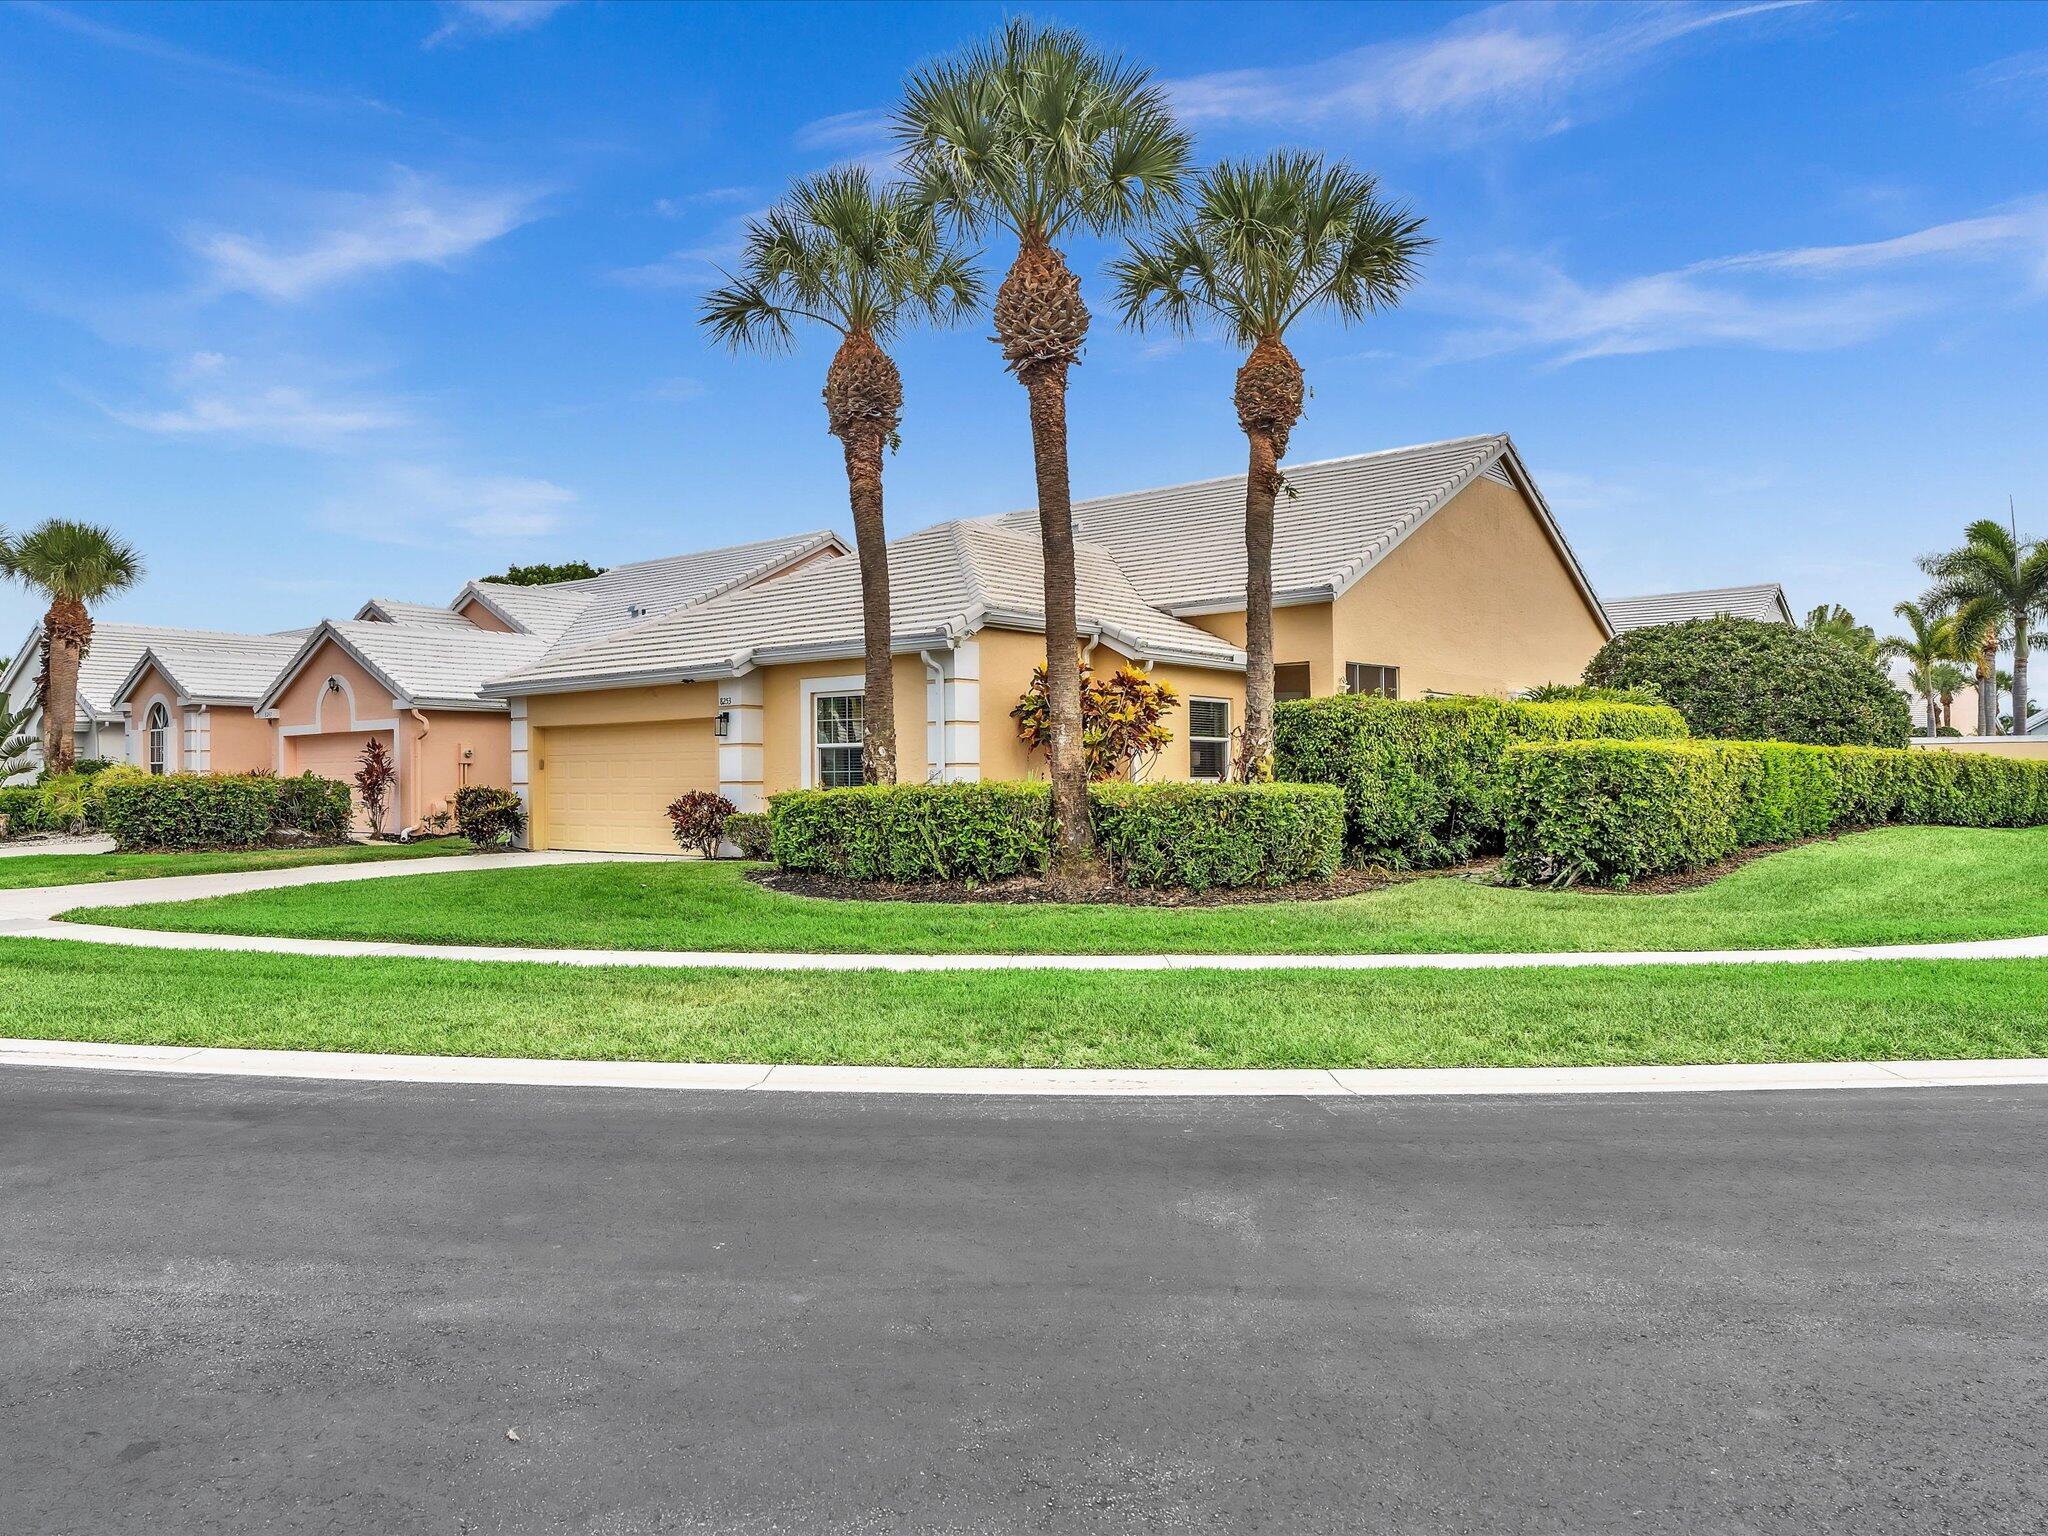
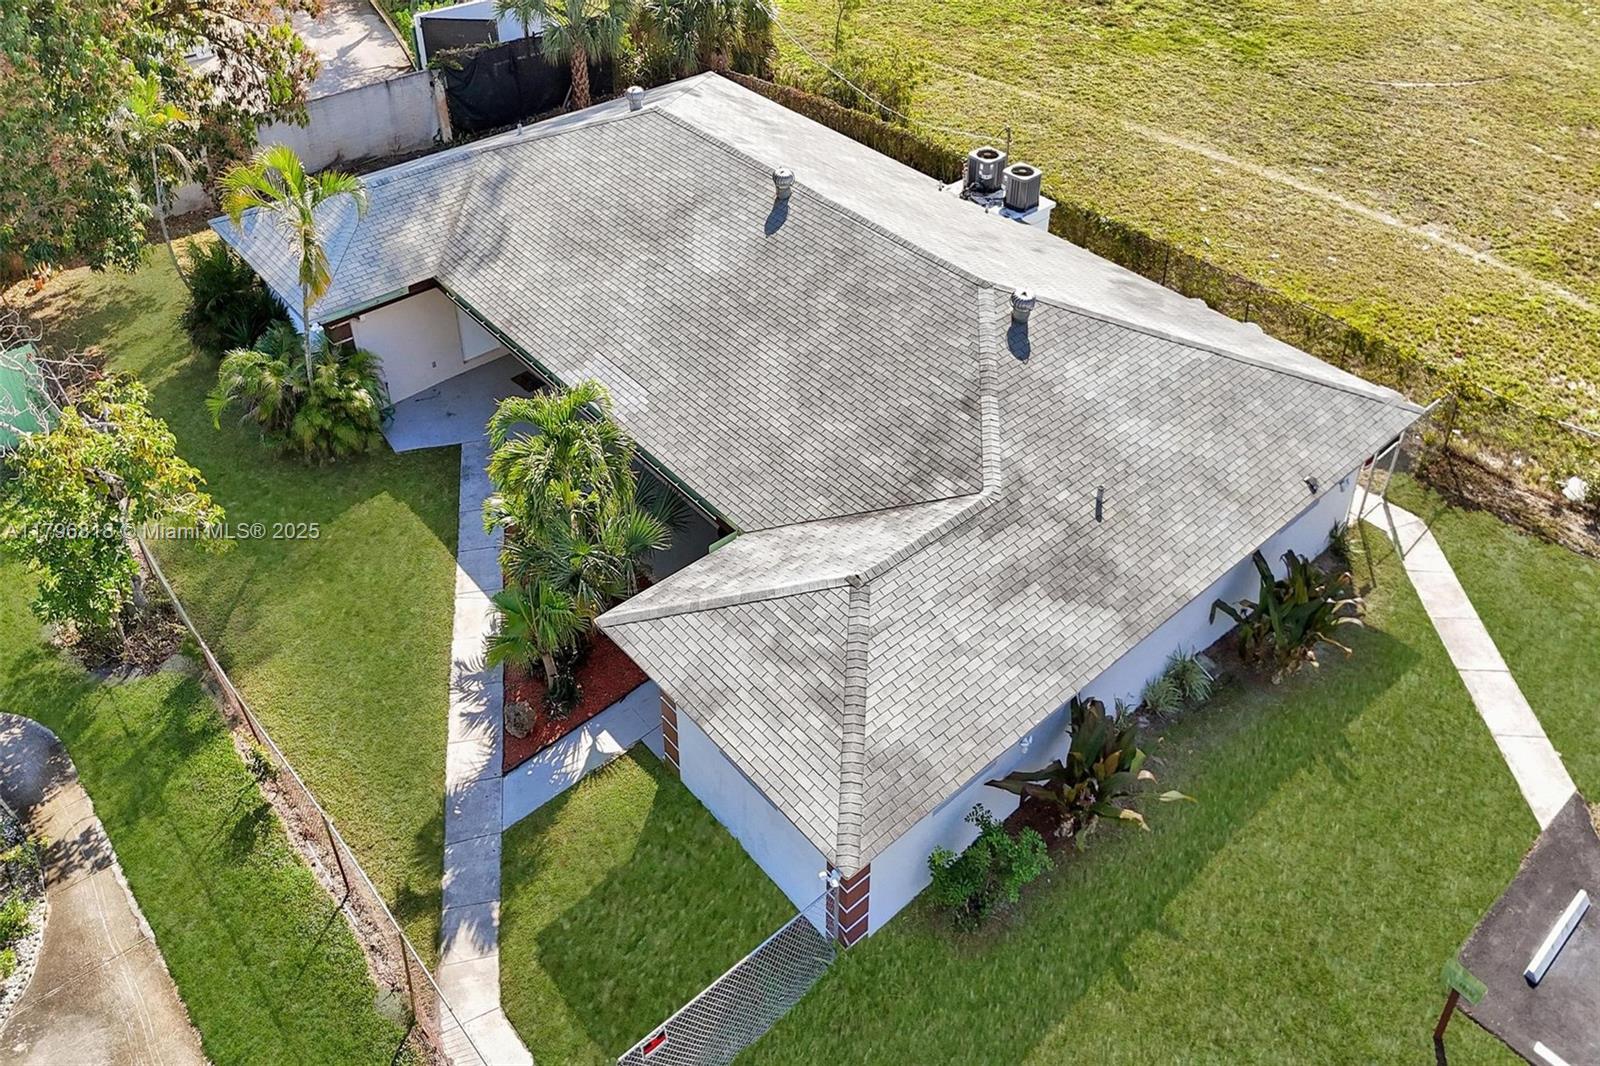
$459,000
3
bds
|
2
ba
|
2,009
sqft
|
built
1990
8253 Horseshoe Bay Rd, Boynton Beach, FL 33472
$967
Cash flow
11.0%
Cash-on-Cash Return
8.8%
Cap rate
1.4%
Rent to Value Ratio
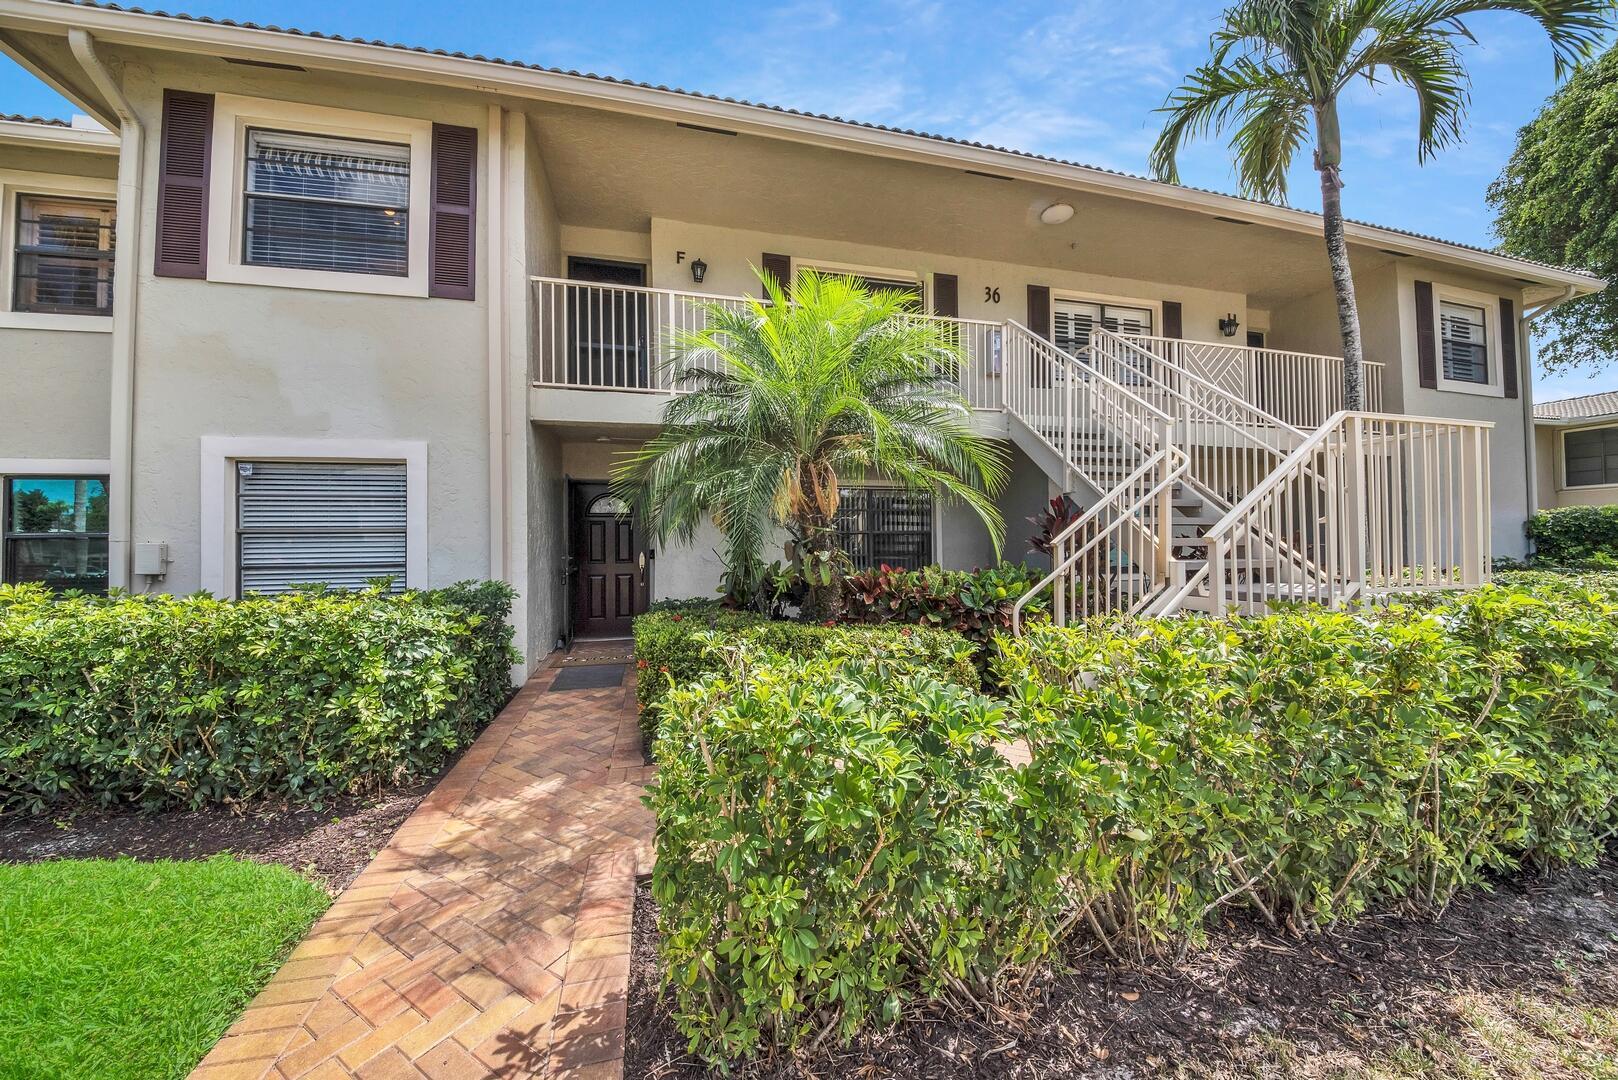
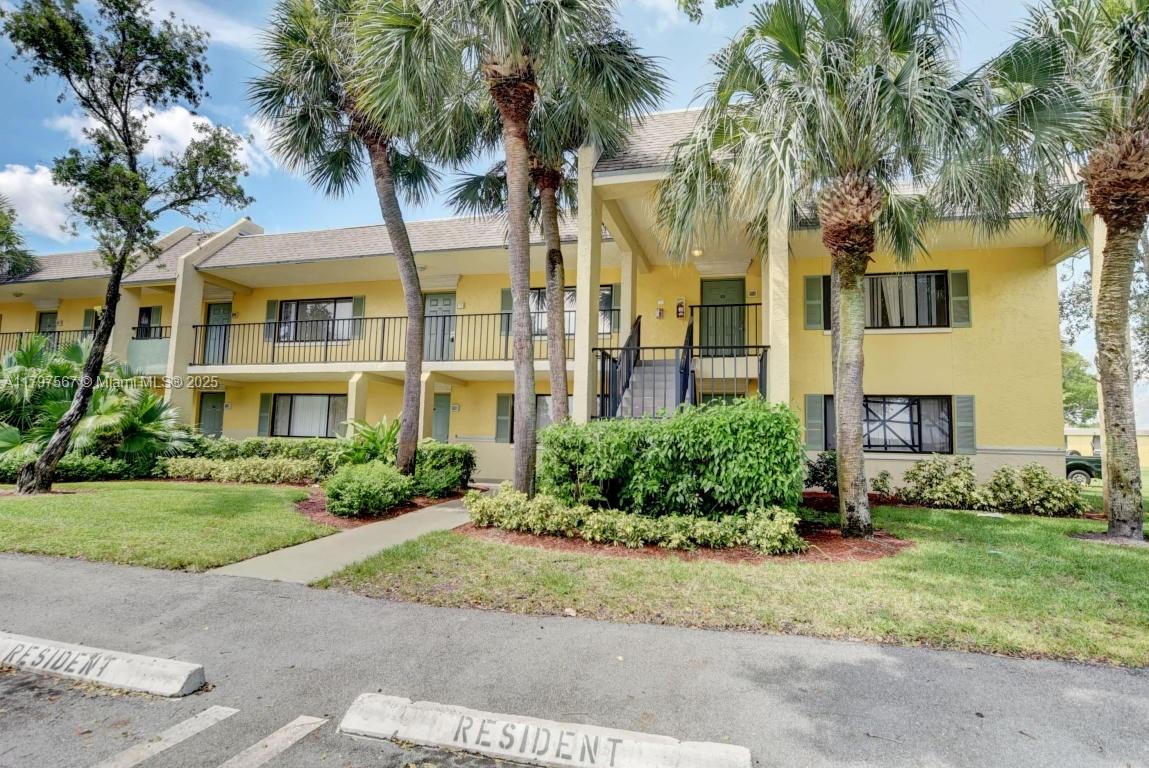
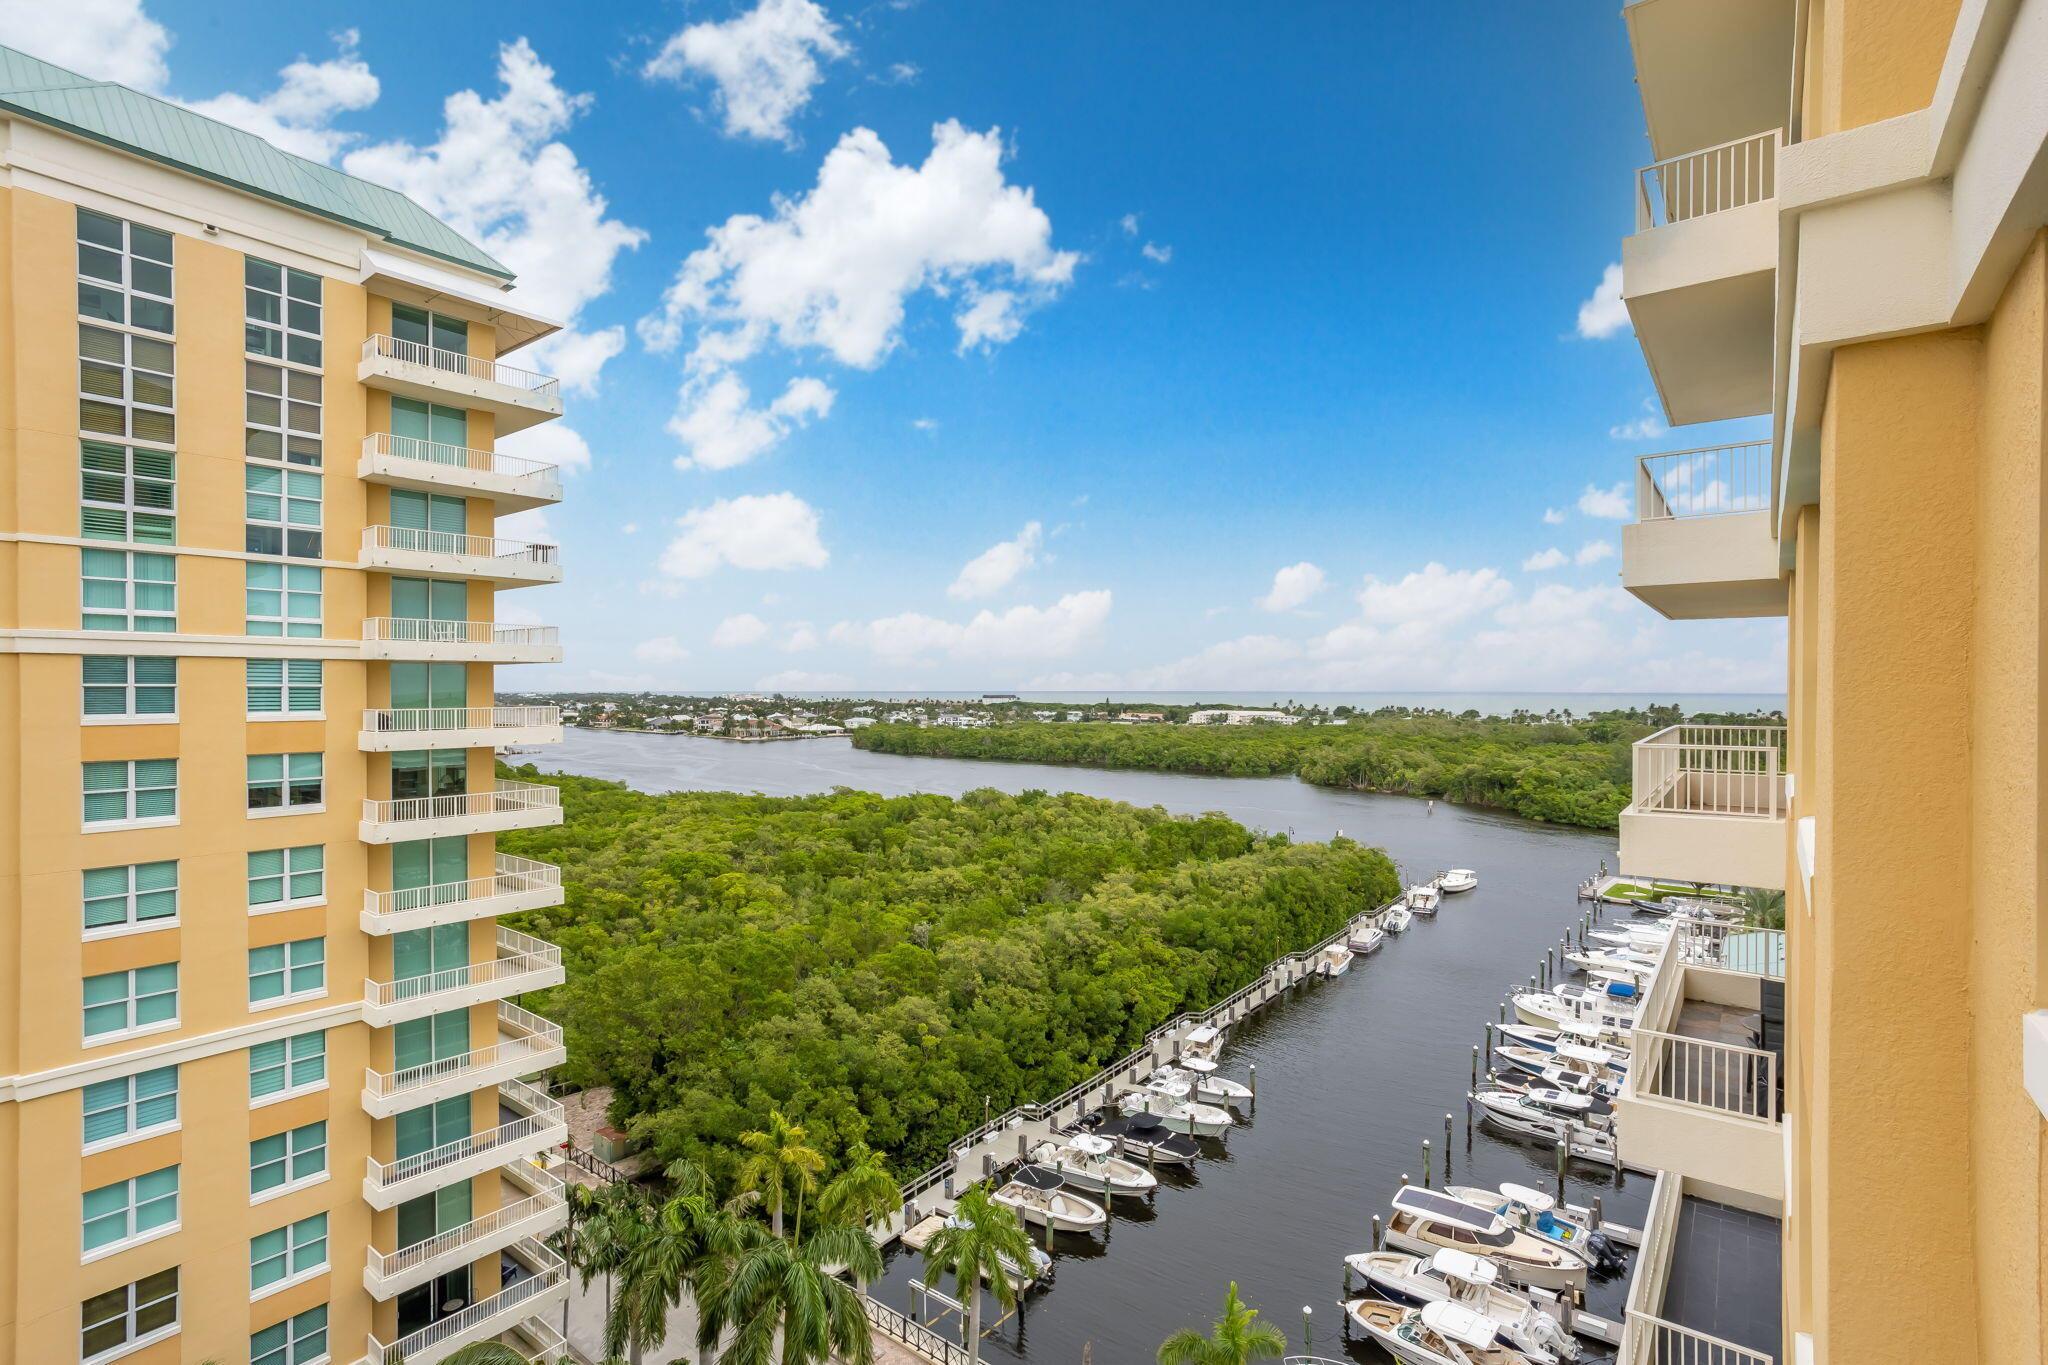
Active
$68,000
2
bds
|
2
ba
|
1,388
sqft
|
built
1981
36 Stratford Ln W, Boynton Beach, FL 33436
$521
Cash flow
8.9%
Cash-on-Cash Return
9.2%
Cap rate
2.9%
Rent to Value Ratio
611 out of 705 properties for sale in Boynton Beach, FL
Limited Results Shown
Create a free account, or log in to reveal all property listings and enjoy the complete experience.
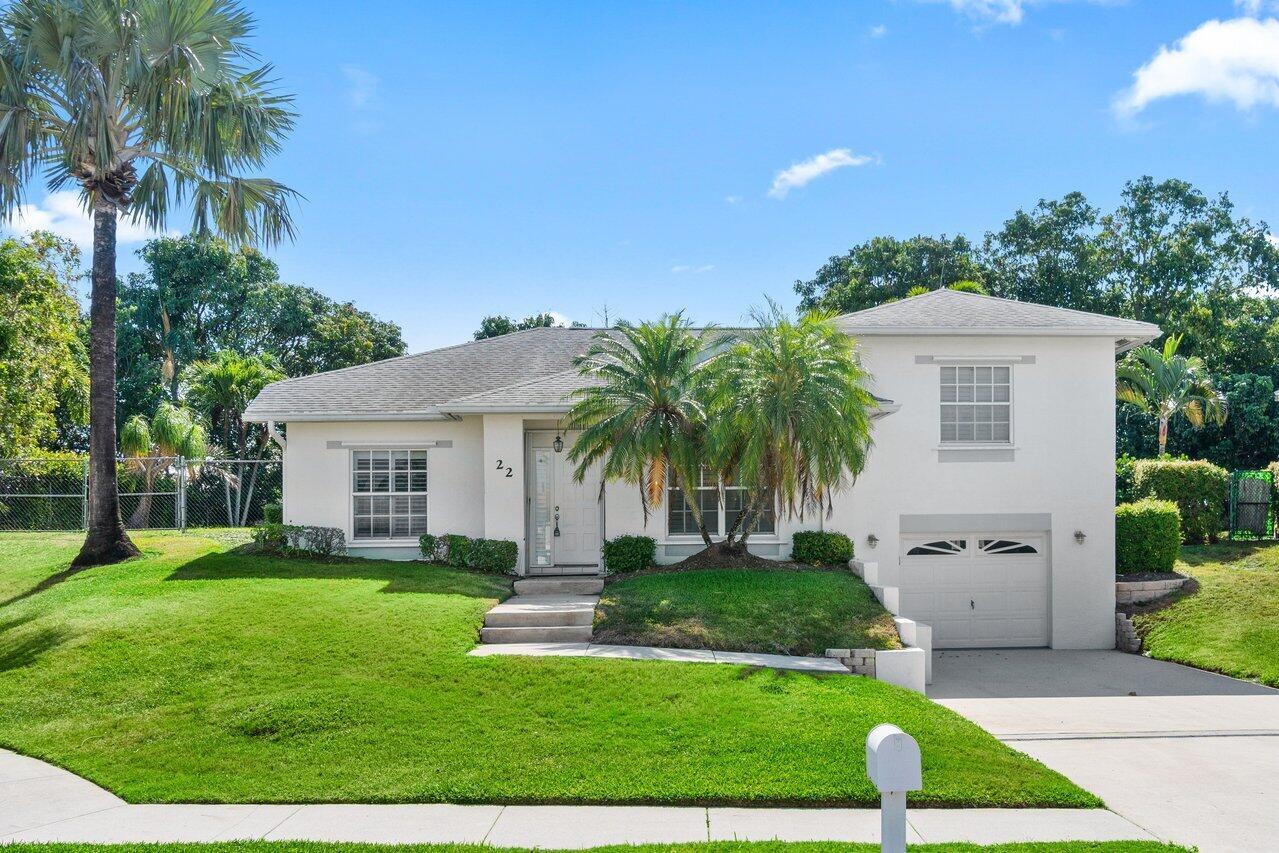
Active
$550,000
3
bds
|
2
ba
|
1,469
sqft
|
built
1996
22 Pepperwood Ct, Boynton Beach, FL 33426
$-736
Cash flow
-7.0%
Cash-on-Cash Return
4.7%
Cap rate
0.7%
Rent to Value Ratio
Active
$1,100,000
3
bds
|
2
ba
|
2,431
sqft
|
built
1999
54 Lake Eden Dr, Boynton Beach, FL 33435
$-3,818
Cash flow
-18.1%
Cash-on-Cash Return
2.1%
Cap rate
0.4%
Rent to Value Ratio
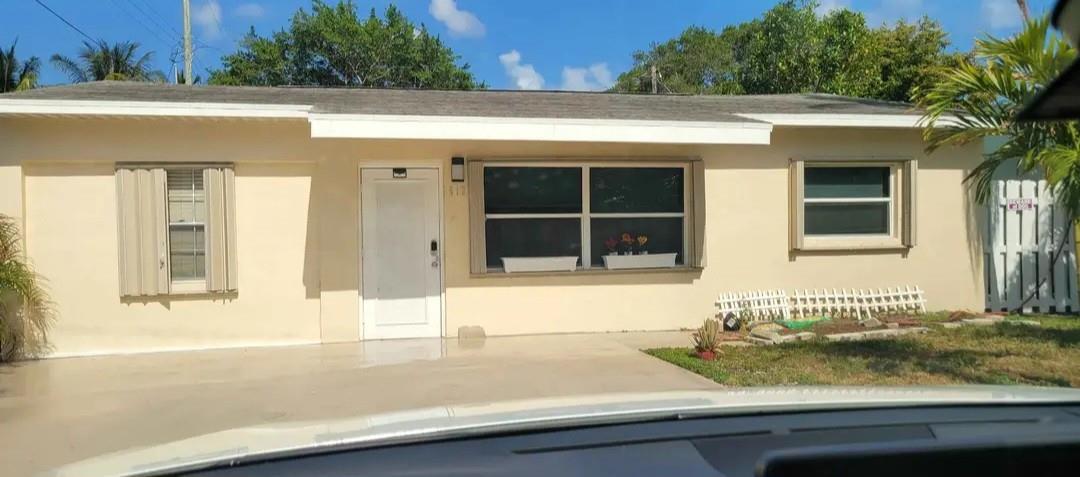
Active
$385,000
2
bds
|
1
ba
|
918
sqft
|
built
1955
512 SE 1st St, Boynton Beach, FL 33435
$-743
Cash flow
-10.1%
Cash-on-Cash Return
4.0%
Cap rate
0.6%
Rent to Value Ratio

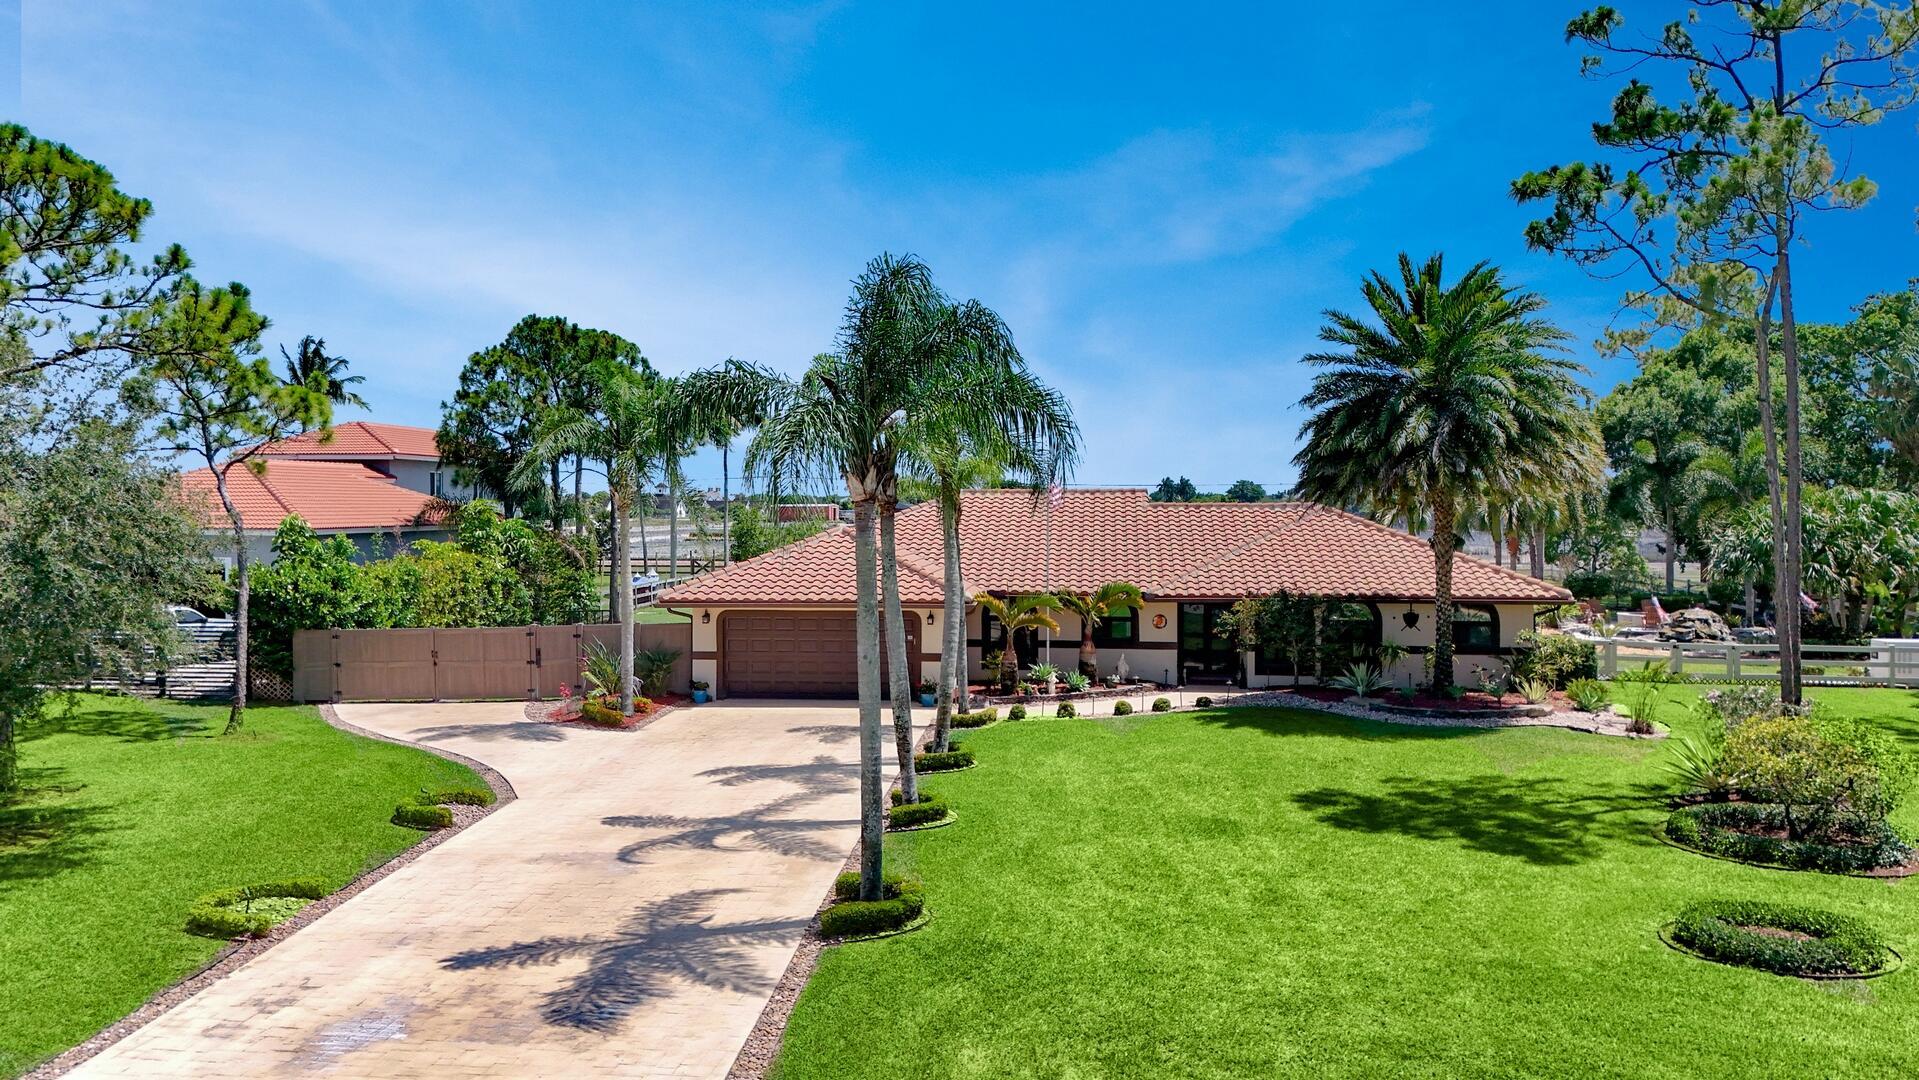
Active
$750,000
5
bds
|
4
ba
|
2,439
sqft
|
built
2005
4940 Gateway Gardens Dr, Boynton Beach, FL 33436
$-1,421
Cash flow
-9.9%
Cash-on-Cash Return
4.0%
Cap rate
0.6%
Rent to Value Ratio
Active
$1,475,000
5
bds
|
3
ba
|
3,592
sqft
|
built
1988
9116 Talway Cir, Boynton Beach, FL 33472
$-4,365
Cash flow
-15.4%
Cash-on-Cash Return
2.7%
Cap rate
0.4%
Rent to Value Ratio
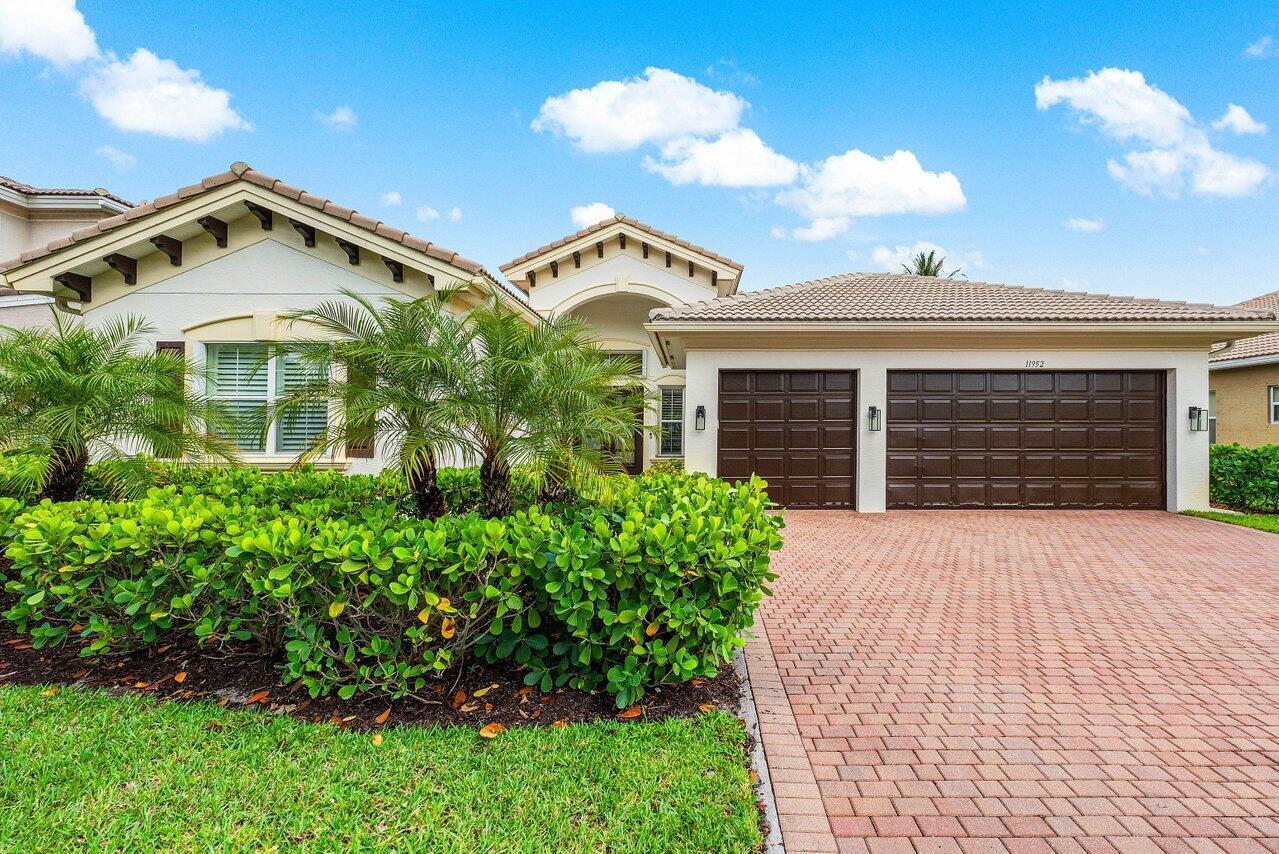
Active
$1,074,900
5
bds
|
4
ba
|
2,783
sqft
|
built
2010
11952 Fox Hill Cir, Boynton Beach, FL 33473
$-2,990
Cash flow
-14.5%
Cash-on-Cash Return
2.9%
Cap rate
0.5%
Rent to Value Ratio
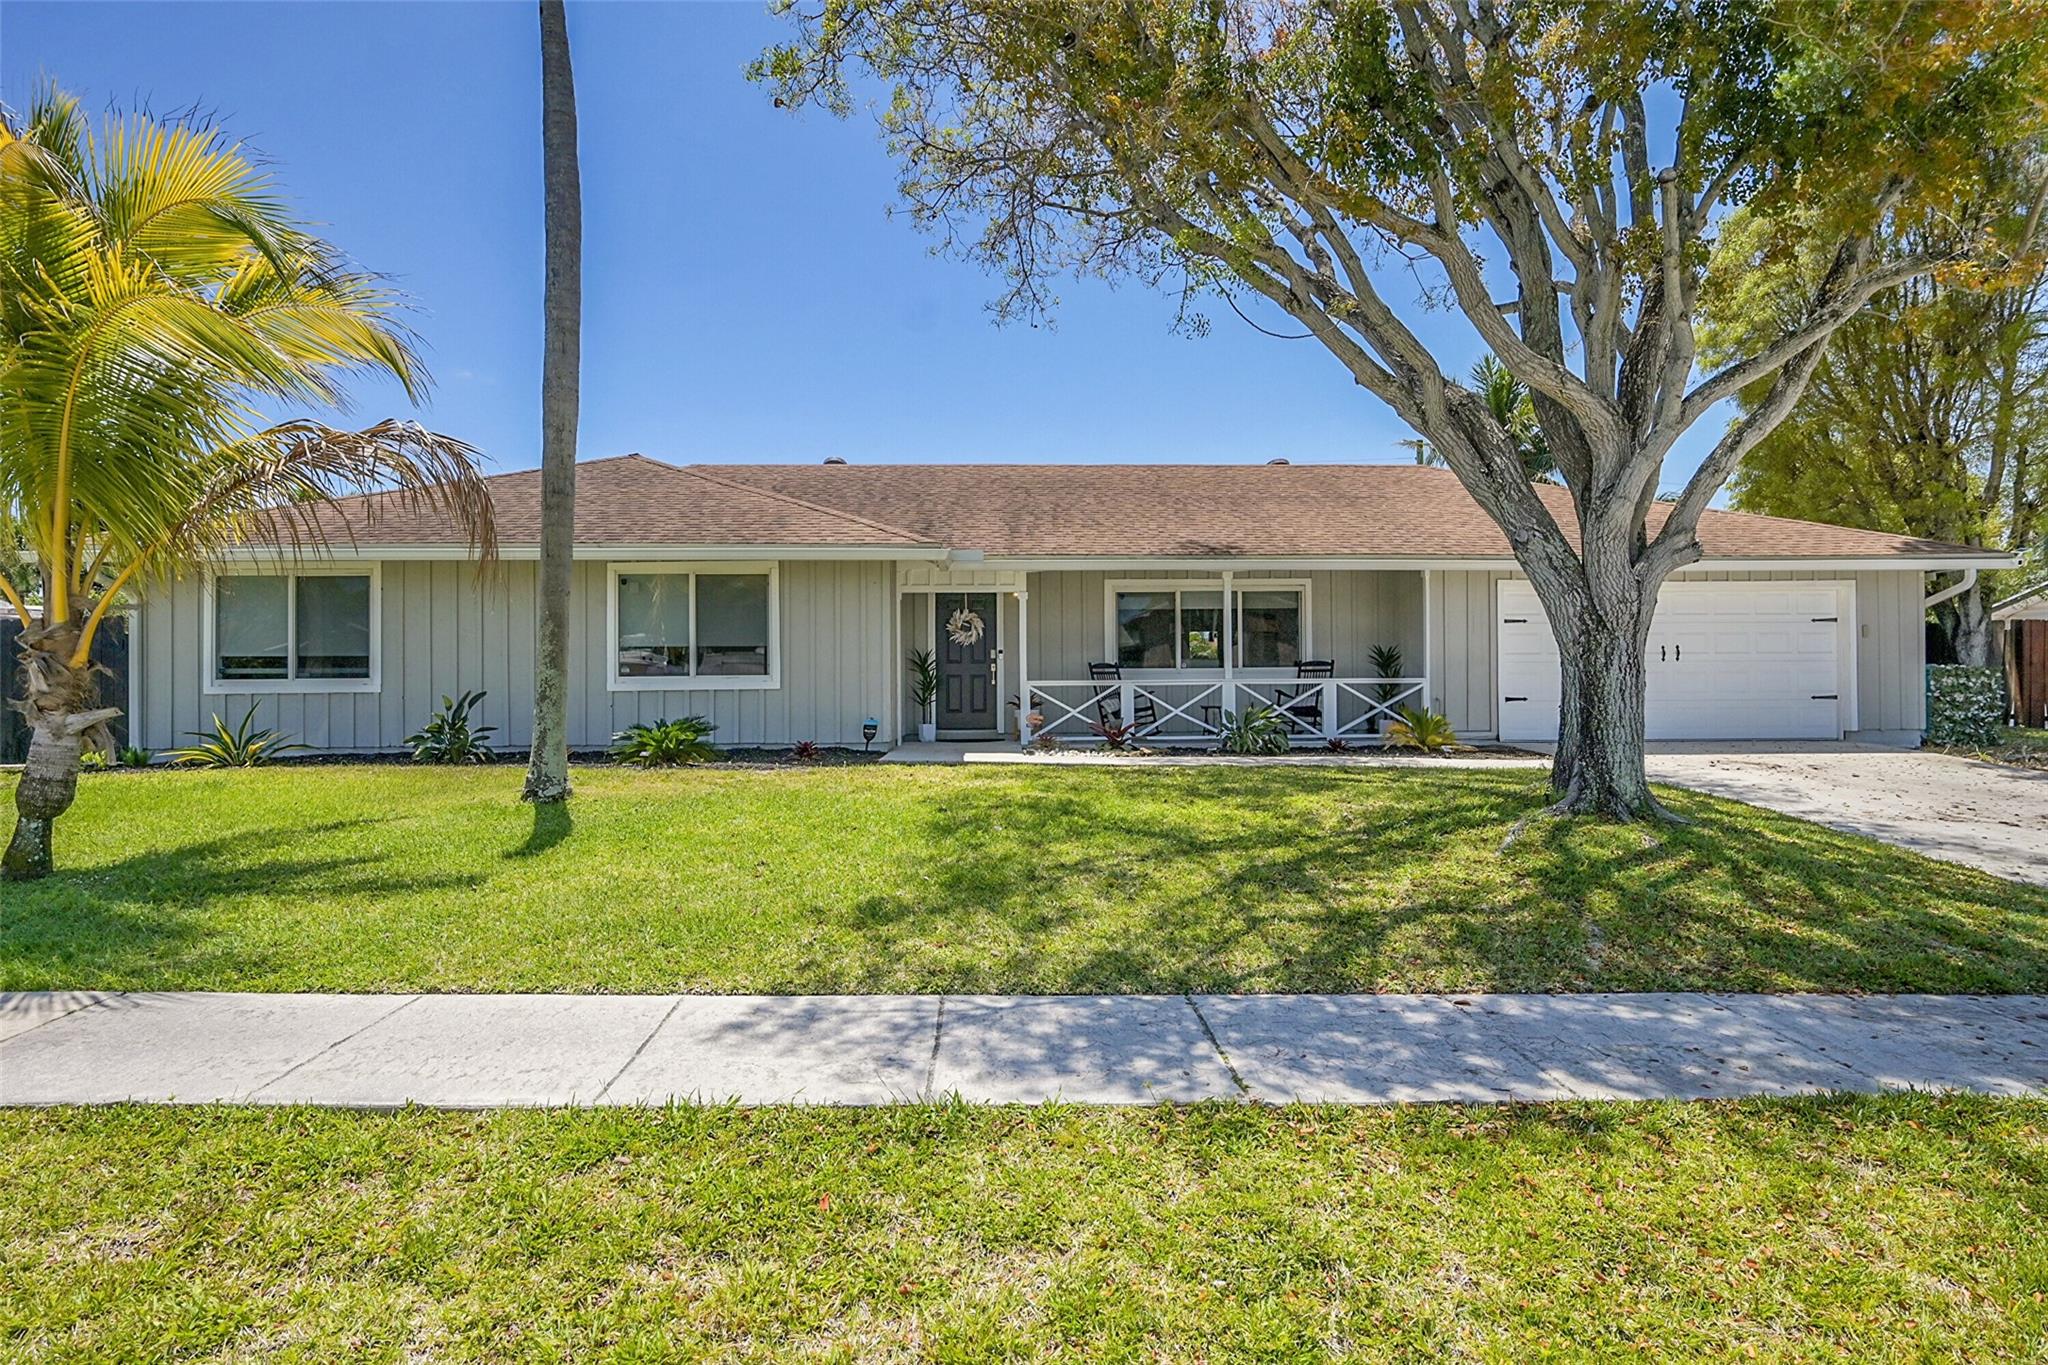
Pending
$699,000
4
bds
|
2
ba
|
1,985
sqft
|
built
1983
340 SW 10th Ave, Boynton Beach, FL 33435
$-1,413
Cash flow
-10.5%
Cash-on-Cash Return
3.9%
Cap rate
0.6%
Rent to Value Ratio
Active
$599,999
3
bds
|
3
ba
|
2,236
sqft
|
built
1993
10039 Lexington Cir N, Boynton Beach, FL 33436
$-1,331
Cash flow
-11.6%
Cash-on-Cash Return
3.6%
Cap rate
0.6%
Rent to Value Ratio
Active
$429,900
3
bds
|
3
ba
|
1,692
sqft
|
built
1990
9842 Watermill Cir, Boynton Beach, FL 33437
$-932
Cash flow
-11.3%
Cash-on-Cash Return
3.7%
Cap rate
0.7%
Rent to Value Ratio
Active
$259,900
2
bds
|
2
ba
|
996
sqft
|
built
1986
7 Via De Casas Sur, Boynton Beach, FL 33426
$-1,211
Cash flow
-24.3%
Cash-on-Cash Return
0.7%
Cap rate
0.8%
Rent to Value Ratio
Active
$1,030,000
5
bds
|
4
ba
|
3,119
sqft
|
built
2005
40 Country Lake Cir, Boynton Beach, FL 33436
$-3,069
Cash flow
-15.5%
Cash-on-Cash Return
2.7%
Cap rate
0.4%
Rent to Value Ratio
Active
$499,000
3
bds
|
2
ba
|
1,412
sqft
|
built
1988
8516 Tourmaline Blvd, Boynton Beach, FL 33472
$-1,201
Cash flow
-12.6%
Cash-on-Cash Return
3.4%
Cap rate
0.6%
Rent to Value Ratio
Active
$459,000
3
bds
|
2
ba
|
2,009
sqft
|
built
1990
8253 Horseshoe Bay Rd, Boynton Beach, FL 33472
$967
Cash flow
11.0%
Cash-on-Cash Return
8.8%
Cap rate
1.4%
Rent to Value Ratio
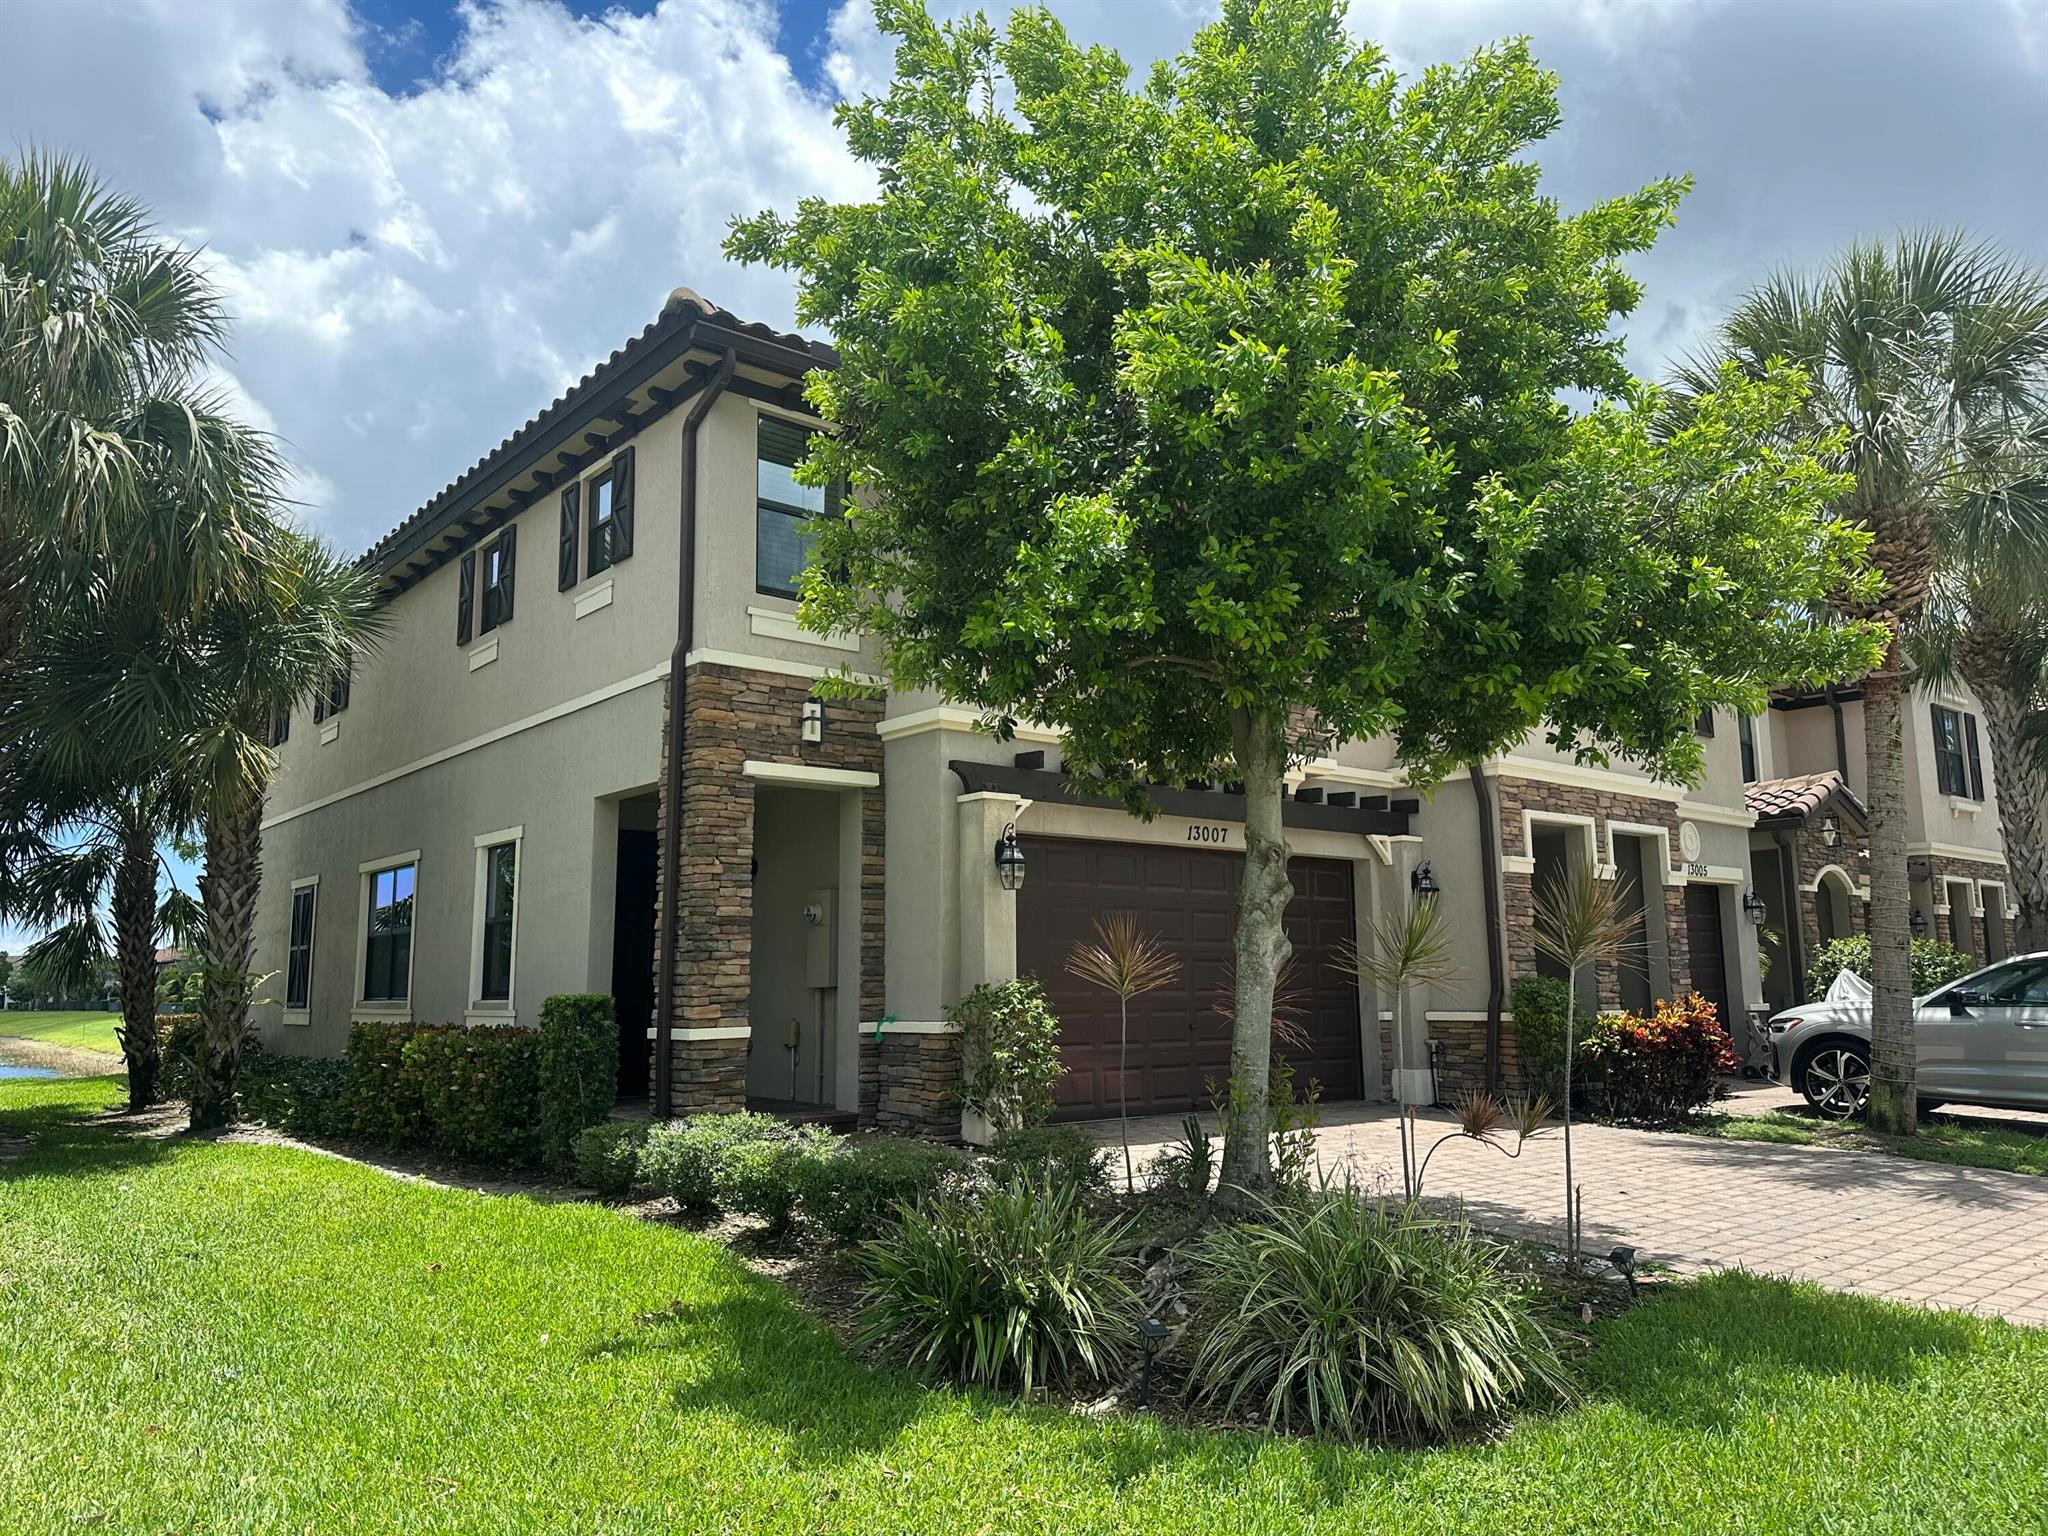
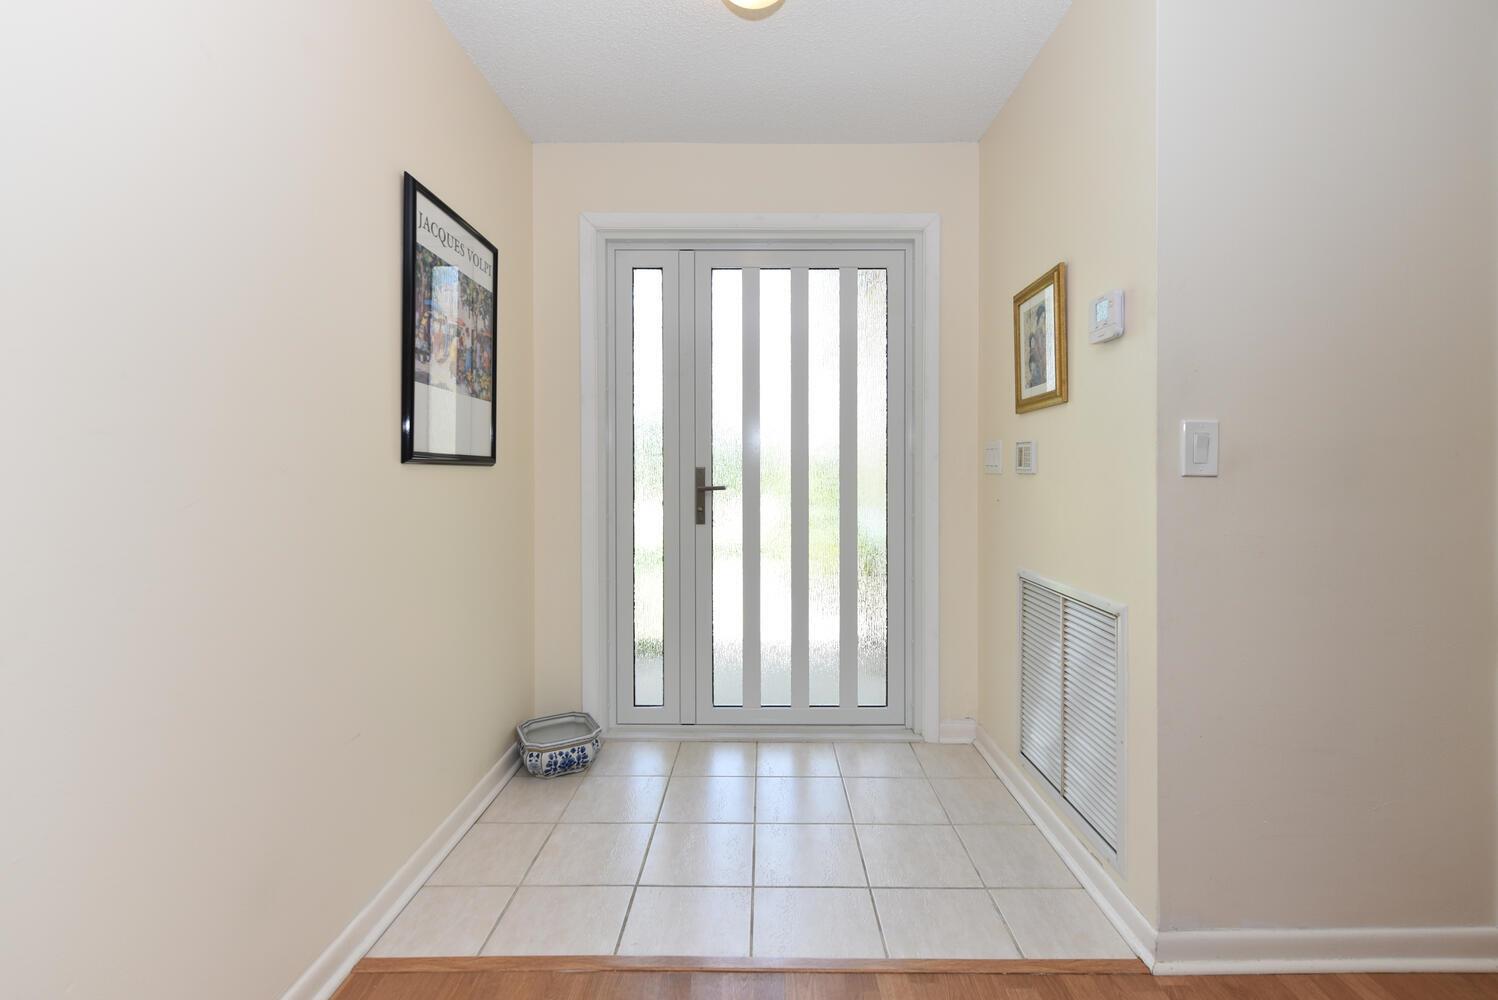
Active
$630,000
4
bds
|
4
ba
|
2,008
sqft
|
built
2017
13007 Anthorne Ln, Boynton Beach, FL 33436
$-1,447
Cash flow
-12.0%
Cash-on-Cash Return
3.5%
Cap rate
0.6%
Rent to Value Ratio
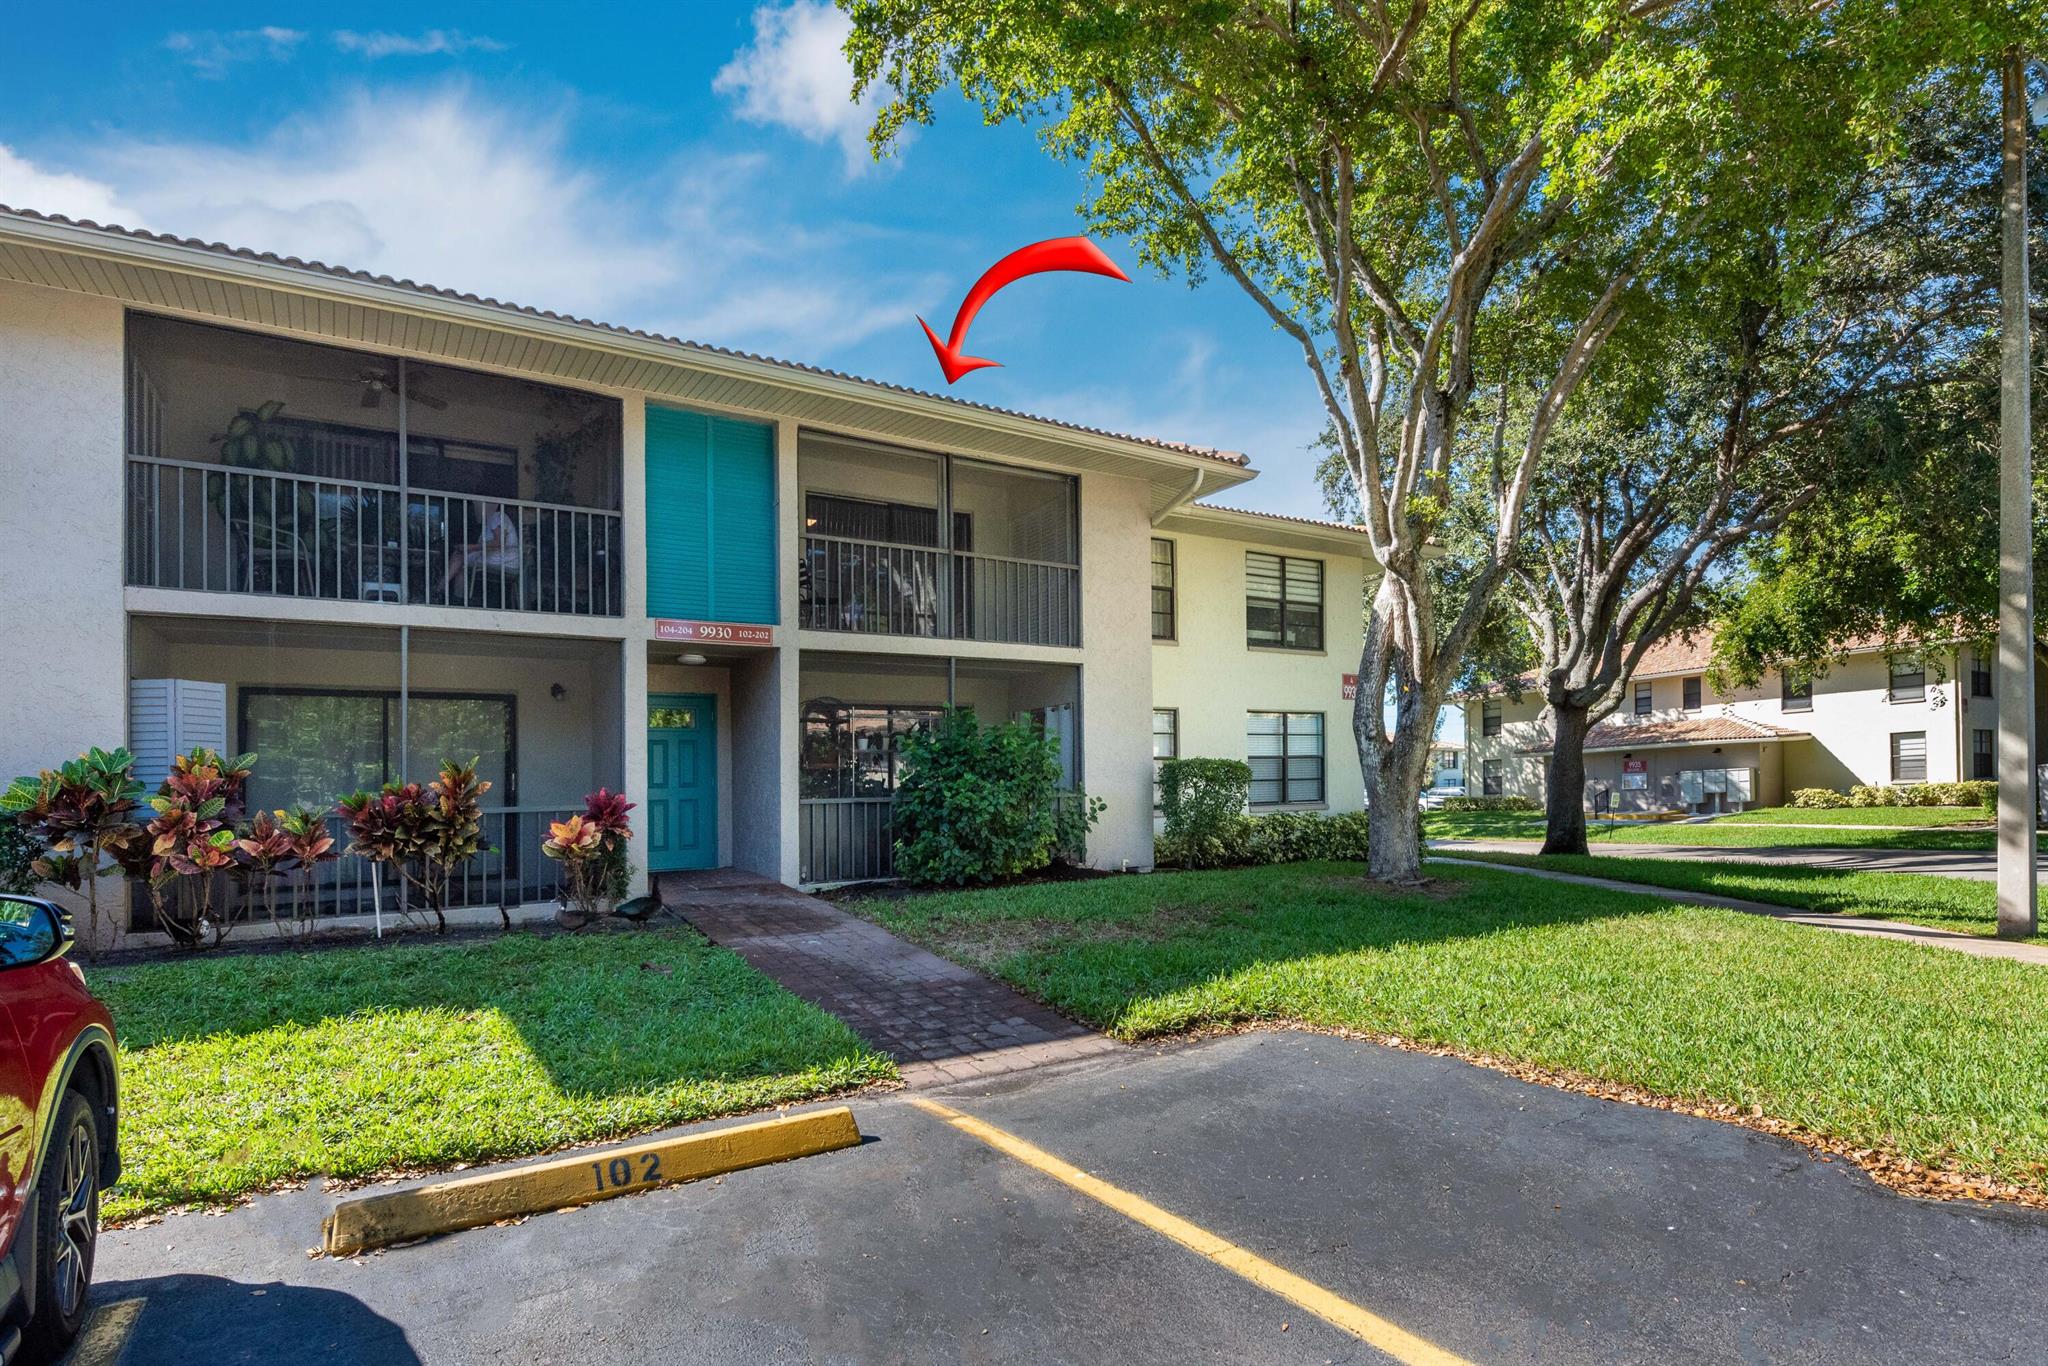
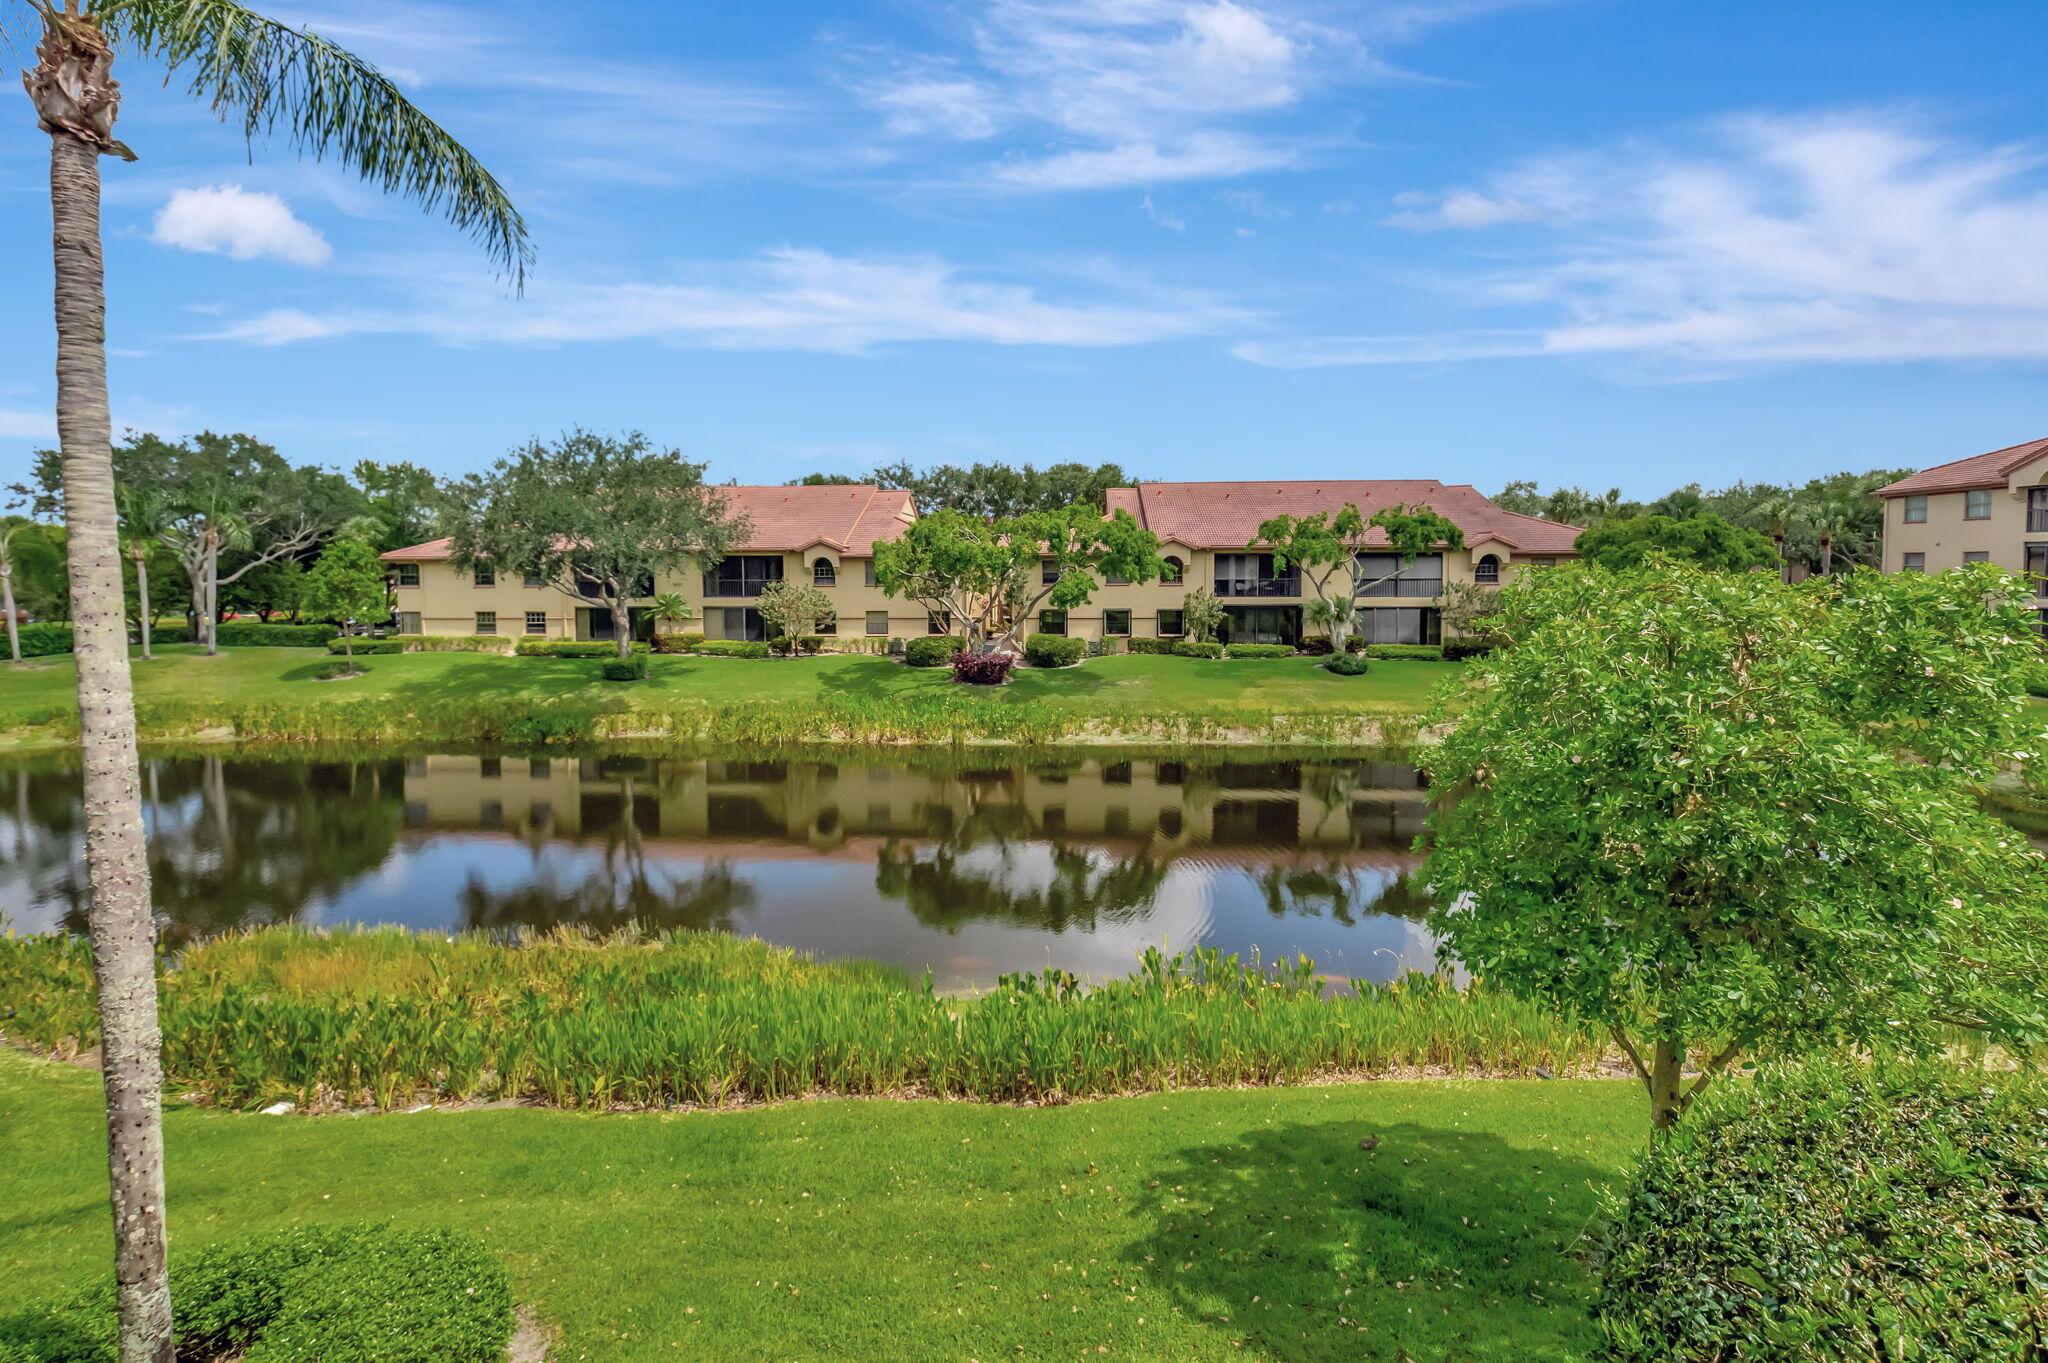
Active
$260,000
2
bds
|
2
ba
|
1,008
sqft
|
built
1981
9930 Pineapple Tree Dr, Boynton Beach, FL 33436
$-405
Cash flow
-8.1%
Cash-on-Cash Return
4.4%
Cap rate
1.0%
Rent to Value Ratio
Active
$235,000
3
bds
|
2
ba
|
1,447
sqft
|
built
1993
5099 Splendido Ct, Boynton Beach, FL 33437
$-703
Cash flow
-15.6%
Cash-on-Cash Return
2.7%
Cap rate
1.1%
Rent to Value Ratio
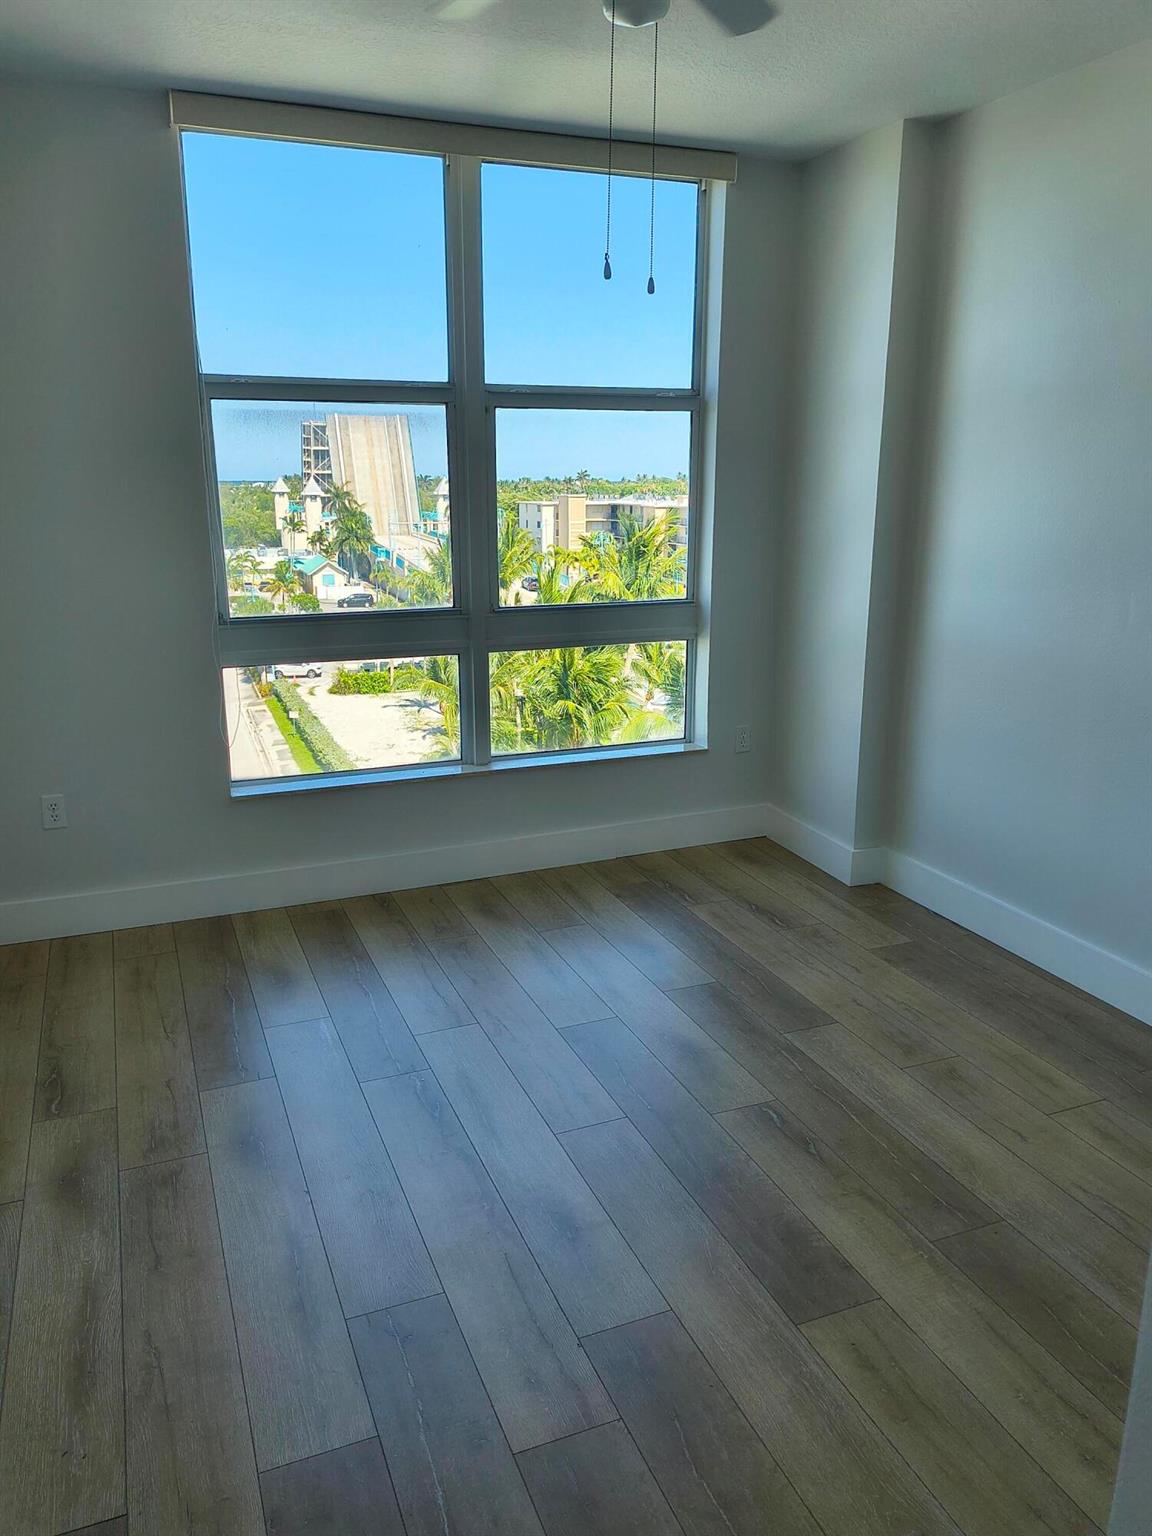
Active
$369,000
1
bds
|
1
ba
|
691
sqft
|
built
2006
100 NE 6th St, Boynton Beach, FL 33435
$-1,384
Cash flow
-19.6%
Cash-on-Cash Return
1.8%
Cap rate
0.7%
Rent to Value Ratio
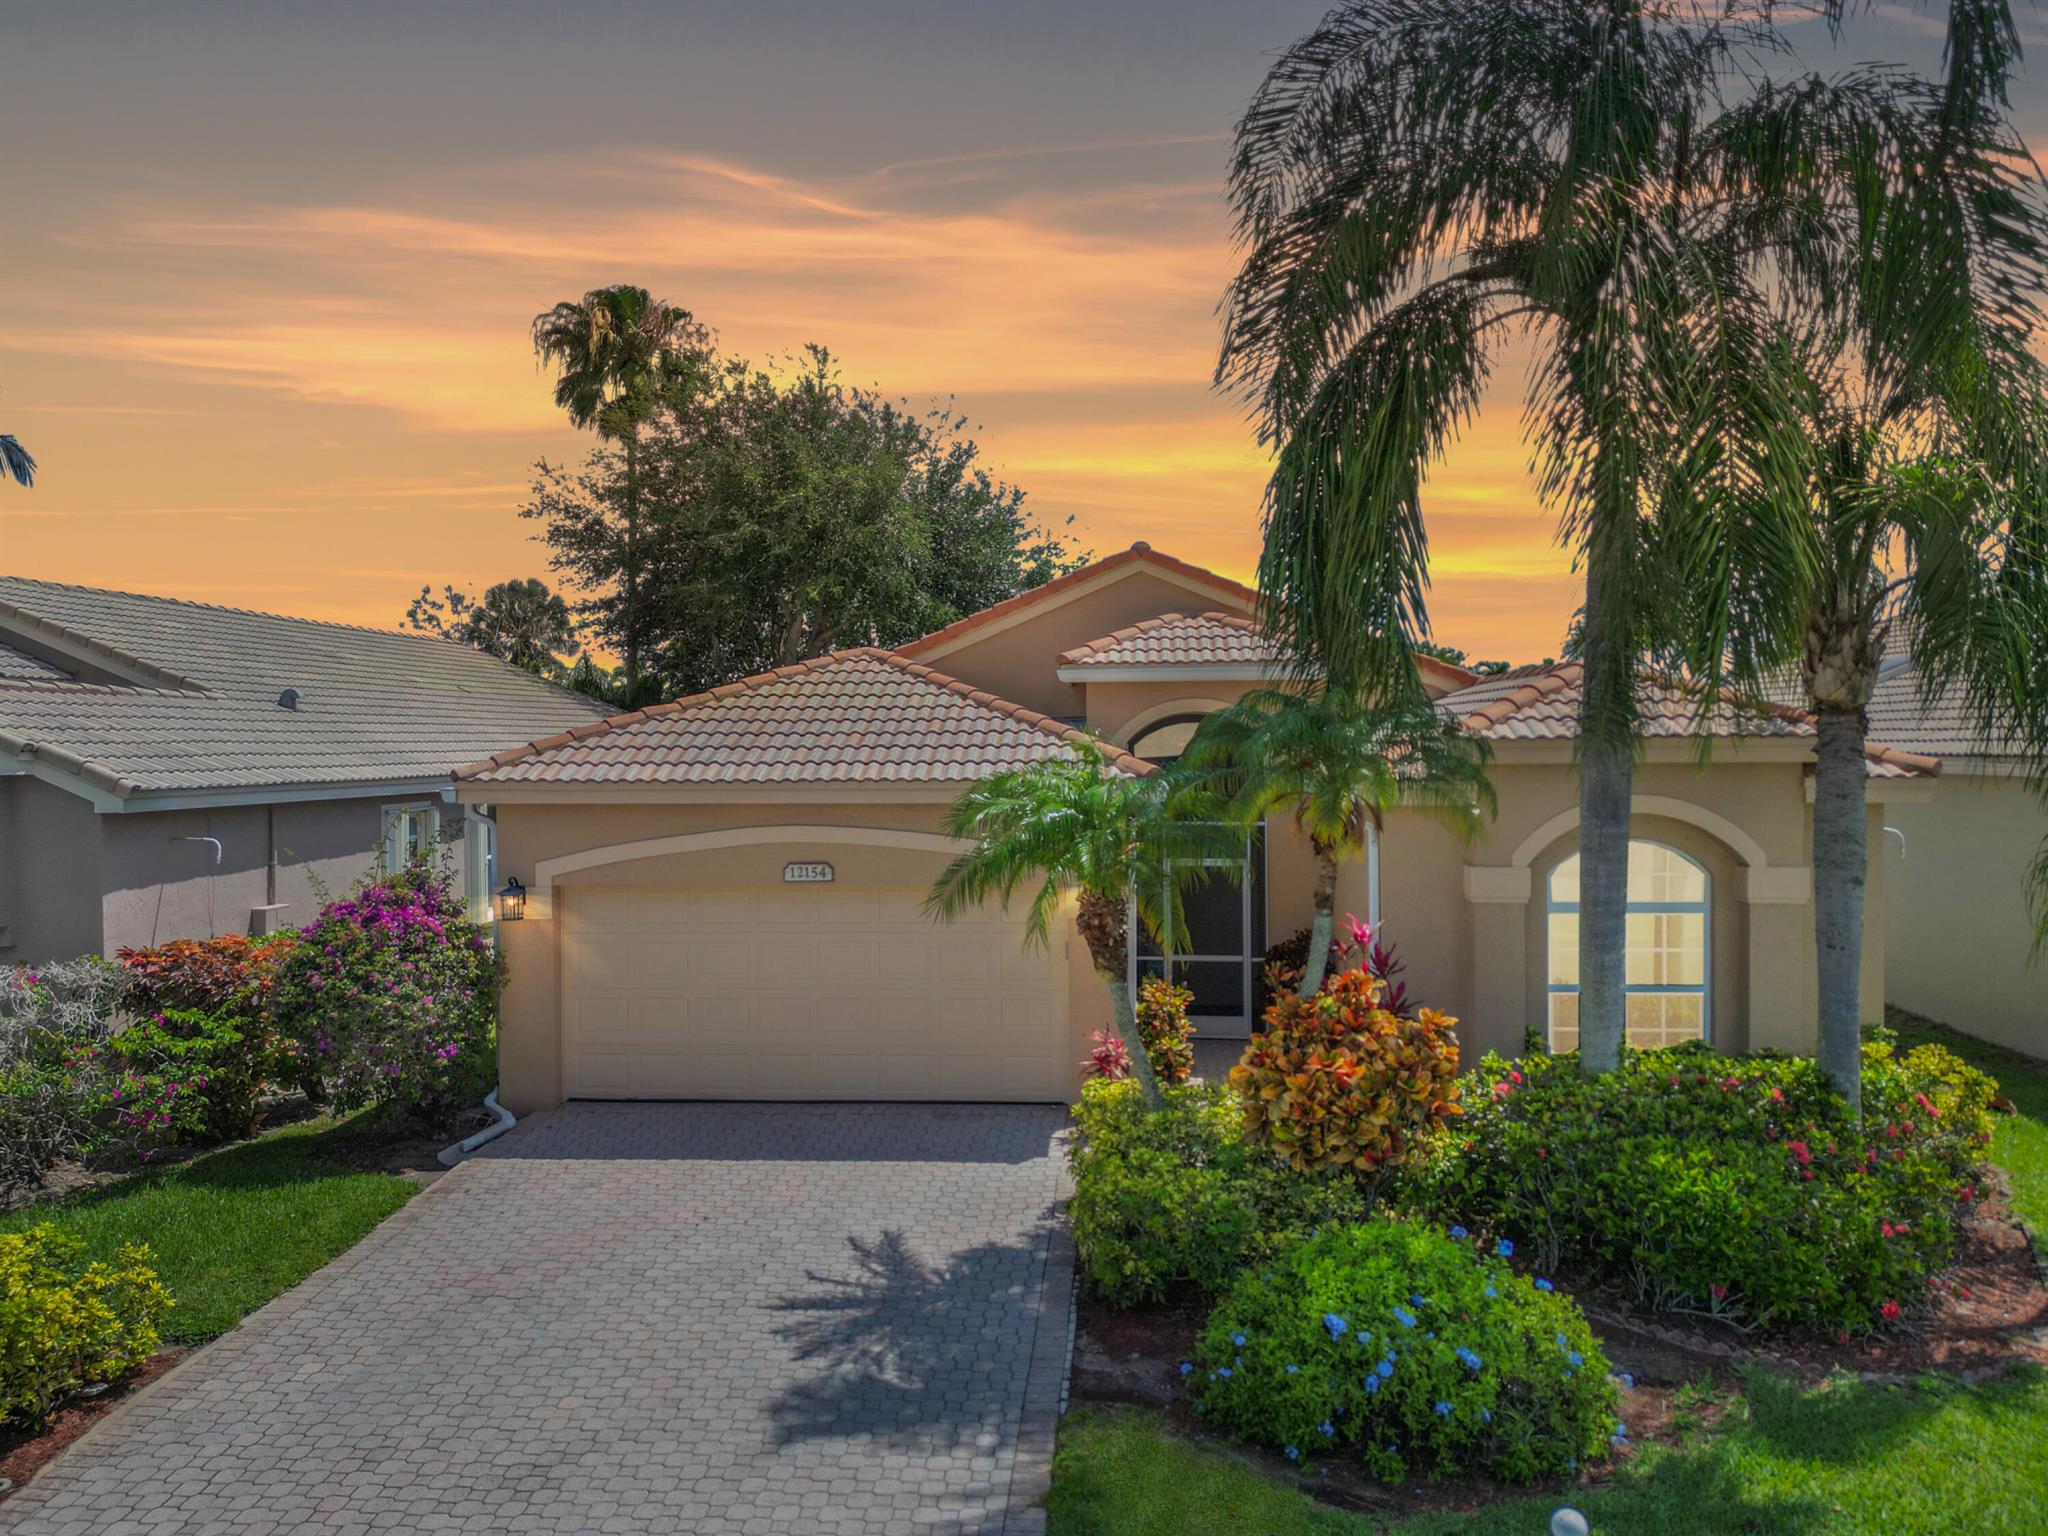
Active
$489,000
3
bds
|
2
ba
|
1,864
sqft
|
built
1998
12154 Cordia Dr, Boynton Beach, FL 33437
$-804
Cash flow
-8.6%
Cash-on-Cash Return
4.3%
Cap rate
0.7%
Rent to Value Ratio
Active
$68,000
2
bds
|
2
ba
|
1,388
sqft
|
built
1981
36 Stratford Ln W, Boynton Beach, FL 33436
$521
Cash flow
8.9%
Cash-on-Cash Return
9.2%
Cap rate
2.9%
Rent to Value Ratio
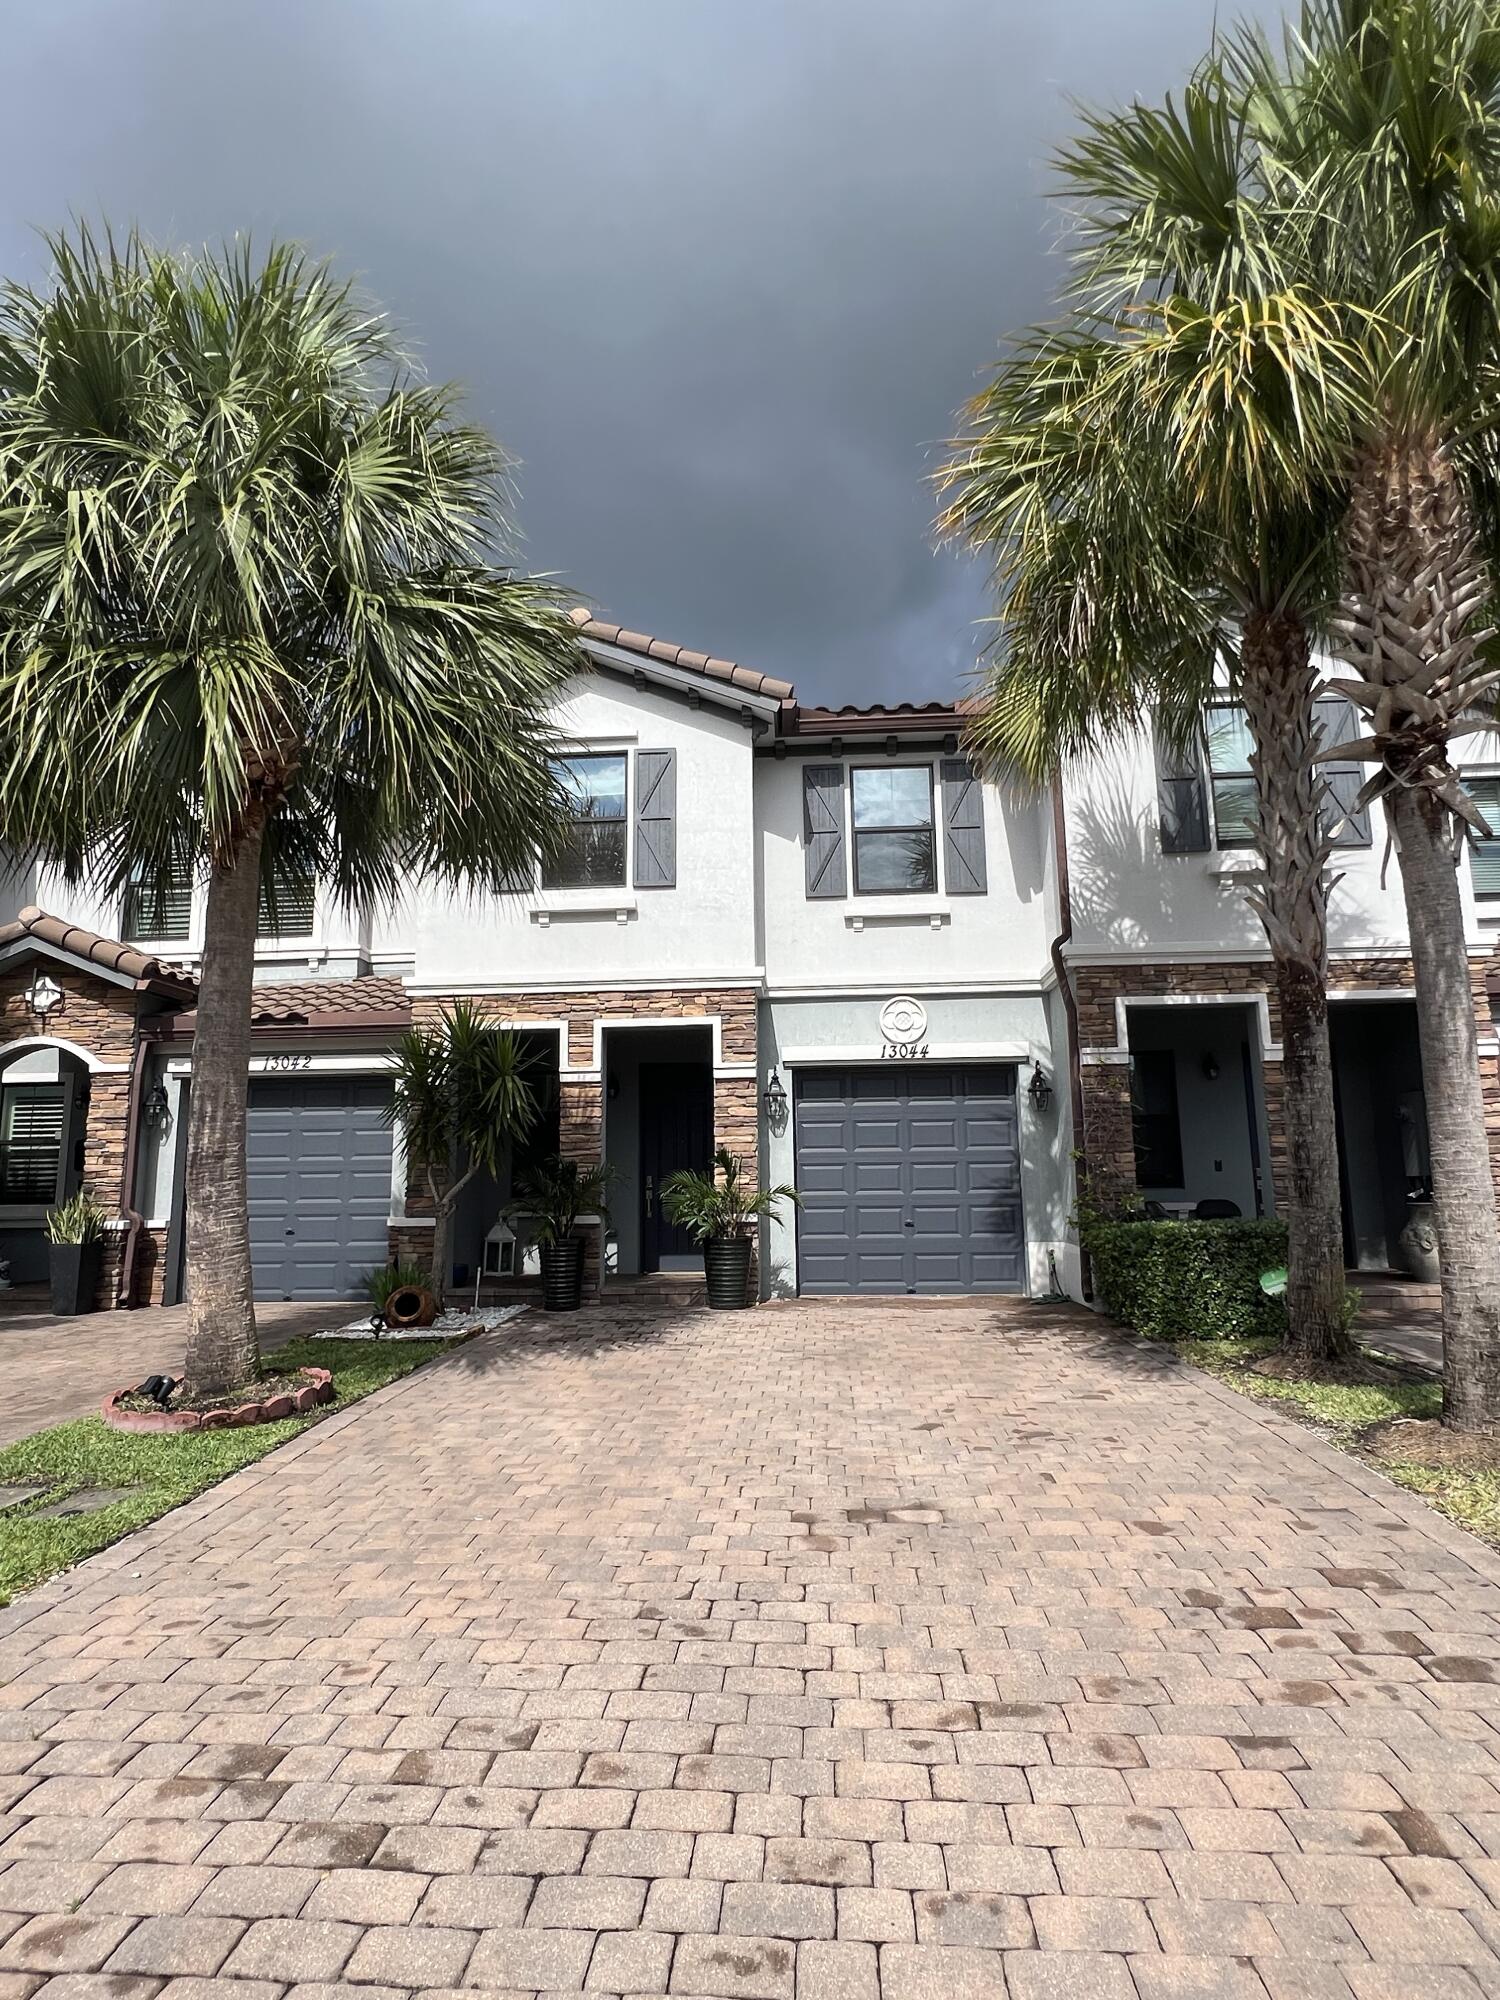
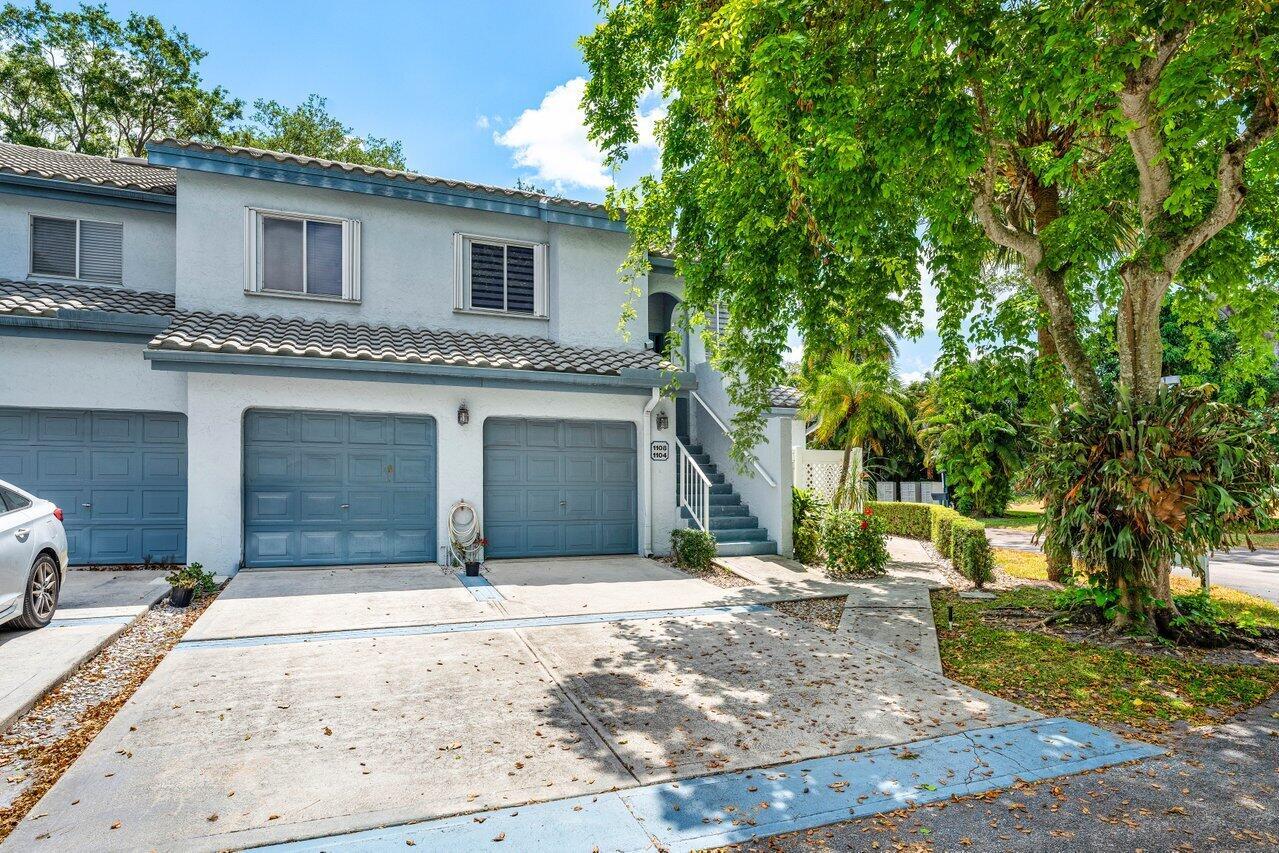
Active
$594,999
3
bds
|
3
ba
|
1,872
sqft
|
built
2018
13044 Anthorne Ln, Boynton Beach, FL 33436
$-957
Cash flow
-8.4%
Cash-on-Cash Return
4.4%
Cap rate
0.6%
Rent to Value Ratio
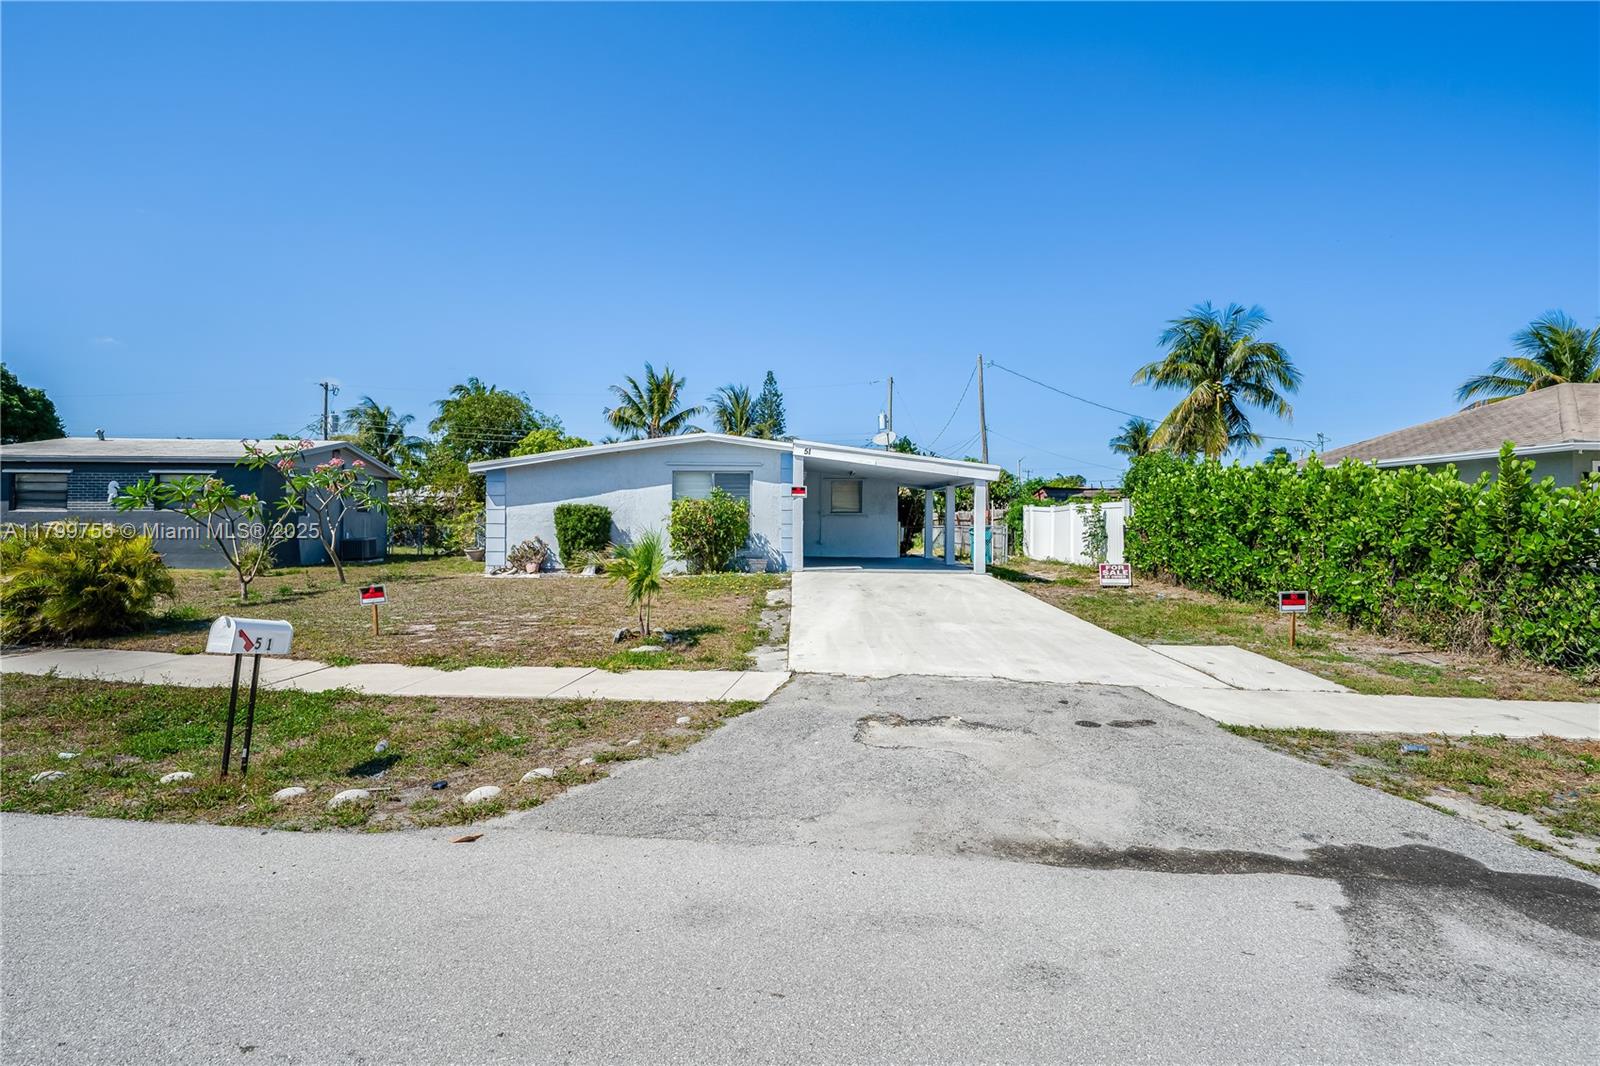
Active
$344,900
3
bds
|
1
ba
|
1,000
sqft
|
built
1959
51 NW 27th Ct, Boynton Beach, FL 33435
$-128
Cash flow
-1.9%
Cash-on-Cash Return
5.8%
Cap rate
0.7%
Rent to Value Ratio
Active
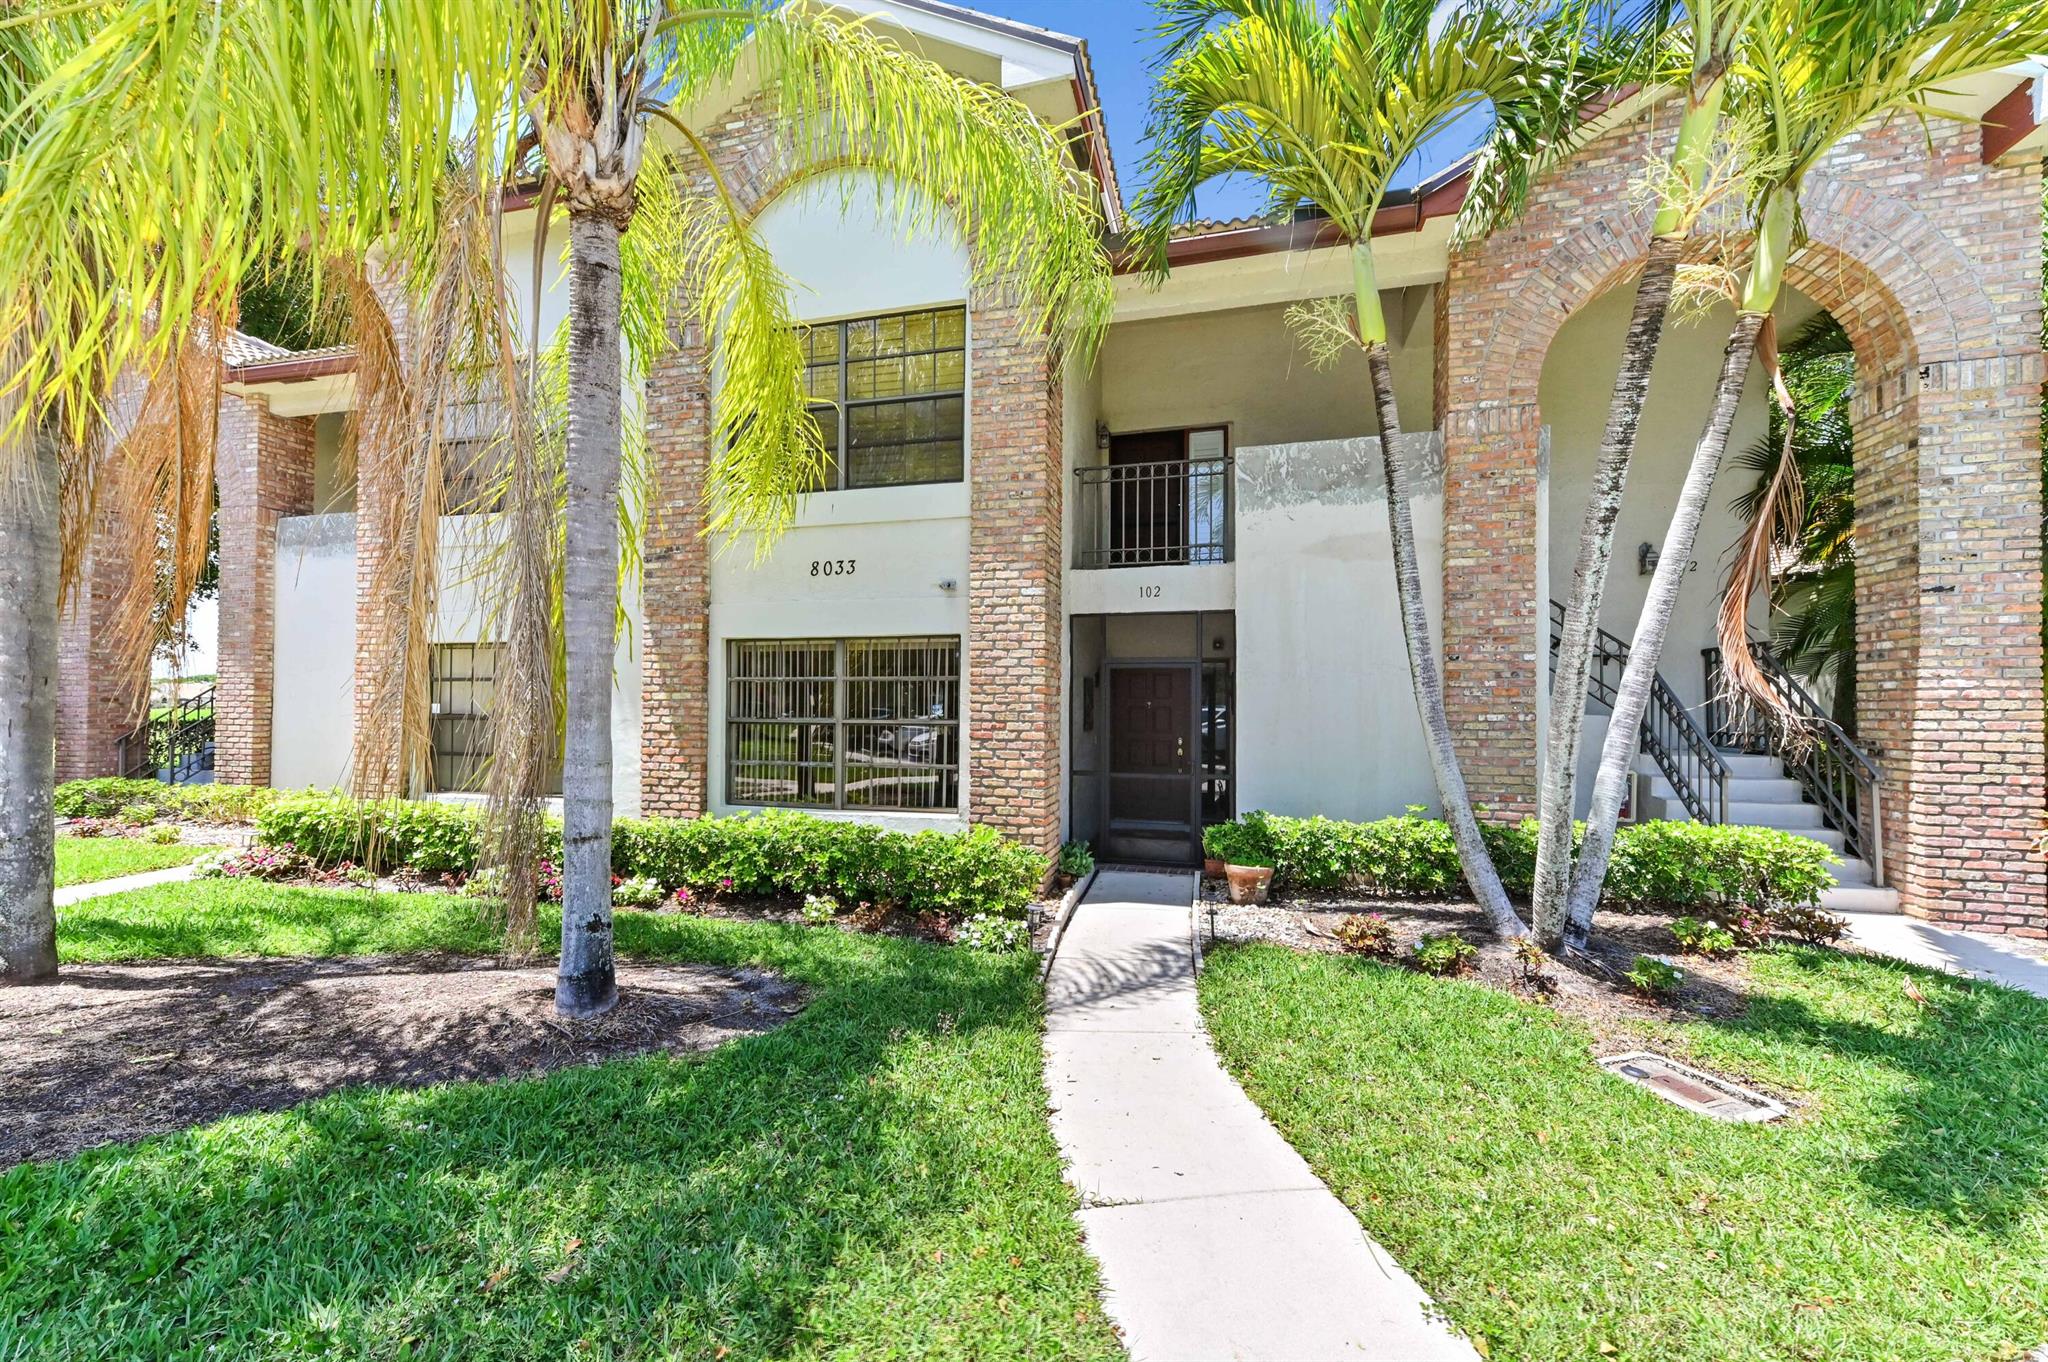
$230,000
2
bds
|
2
ba
|
1,054
sqft
|
built
1989
8033 Aberdeen Dr, Boynton Beach, FL 33472
$-412
Cash flow
-9.3%
Cash-on-Cash Return
4.1%
Cap rate
1.1%
Rent to Value Ratio
Active
$248,888
2
bds
|
2
ba
|
1,114
sqft
|
built
1980
1731 Palmland Dr, Boynton Beach, FL 33436
$-300
Cash flow
-6.3%
Cash-on-Cash Return
4.8%
Cap rate
0.9%
Rent to Value Ratio
Active
$1,199,000
6
bds
|
4
ba
|
4,147
sqft
|
built
2006
8679 Cobblestone Point Cir, Boynton Beach, FL 33472
$-2,370
Cash flow
-10.3%
Cash-on-Cash Return
3.9%
Cap rate
0.7%
Rent to Value Ratio
Active
$1,375,000
3
bds
|
3
ba
|
2,005
sqft
|
built
2021
2510 Lake Dr N, Boynton Beach, FL 33435
$-1,929
Cash flow
-7.3%
Cash-on-Cash Return
4.6%
Cap rate
0.6%
Rent to Value Ratio
Active
$1,275,000
3
bds
|
3
ba
|
2,142
sqft
|
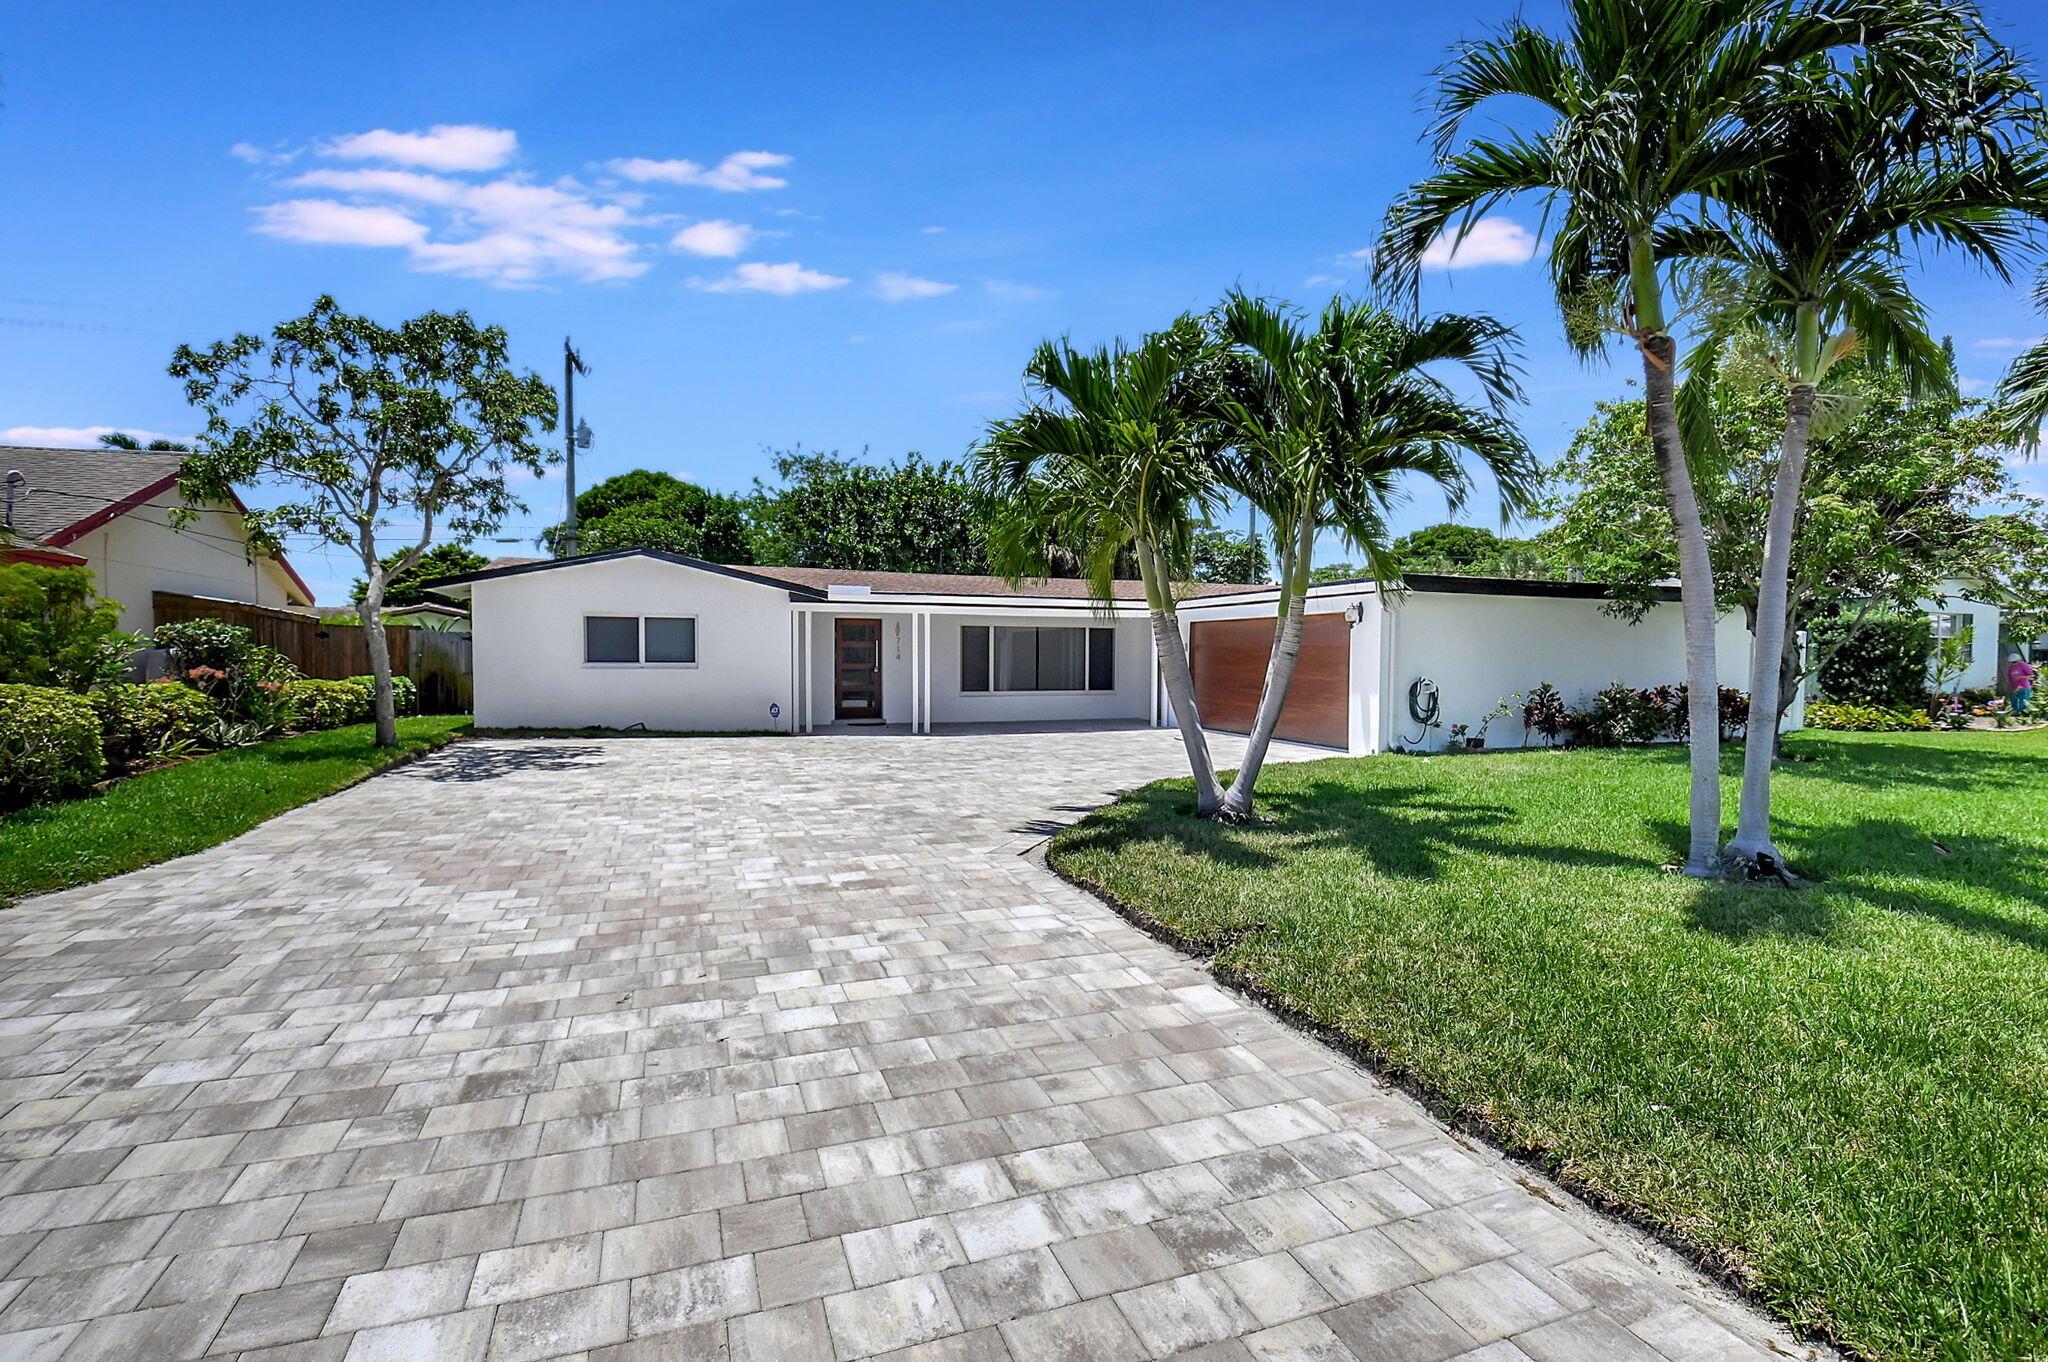
built
1958
714 SW 25th Ave, Boynton Beach, FL 33435
$-3,937
Cash flow
-16.1%
Cash-on-Cash Return
2.6%
Cap rate
0.4%
Rent to Value Ratio
Active under contract
$469,000
3
bds
|
2
ba
|
1,303
sqft
|
built
1986
8500 Mildred Dr W, Boynton Beach, FL 33472
$-532
Cash flow
-5.9%
Cash-on-Cash Return
4.9%
Cap rate
0.7%
Rent to Value Ratio
Active
$119,000
2
bds
|
2
ba
|
1,617
sqft
|
built
1982
4 Stratford Dr E, Boynton Beach, FL 33436
$-727
Cash flow
-31.9%
Cash-on-Cash Return
-1.0%
Cap rate
1.9%
Rent to Value Ratio
Active
$778,000
4
bds
|
4
ba
|
3,293
sqft
|
built
1998
8100 Muirhead Cir, Boynton Beach, FL 33472
$-949
Cash flow
-6.4%
Cash-on-Cash Return
4.8%
Cap rate
0.8%
Rent to Value Ratio
Active
$875,000
3
bds
|
3
ba
|
1,888
sqft
|
built
1957
2410 SW 1st St, Boynton Beach, FL 33435
$-2,559
Cash flow
-15.3%
Cash-on-Cash Return
2.8%
Cap rate
0.4%
Rent to Value Ratio
Active
$158,000
1
bds
|
1
ba
|
704
sqft
|
built
1986
1722 Meadows Cir W, Boynton Beach, FL 33436
$-298
Cash flow
-9.8%
Cash-on-Cash Return
4.0%
Cap rate
1.1%
Rent to Value Ratio
Active
$375,000
1
bds
|
1
ba
|
729
sqft
|
built
1954
232 SE 1st Ave, Boynton Beach, FL 33435
$-687
Cash flow
-9.6%
Cash-on-Cash Return
4.1%
Cap rate
0.6%
Rent to Value Ratio
Active under contract
$519,900
3
bds
|
2
ba
|
1,803
sqft
|
built
1993
30 Swallow Dr, Boynton Beach, FL 33436
$-822
Cash flow
-8.2%
Cash-on-Cash Return
4.4%
Cap rate
0.7%
Rent to Value Ratio
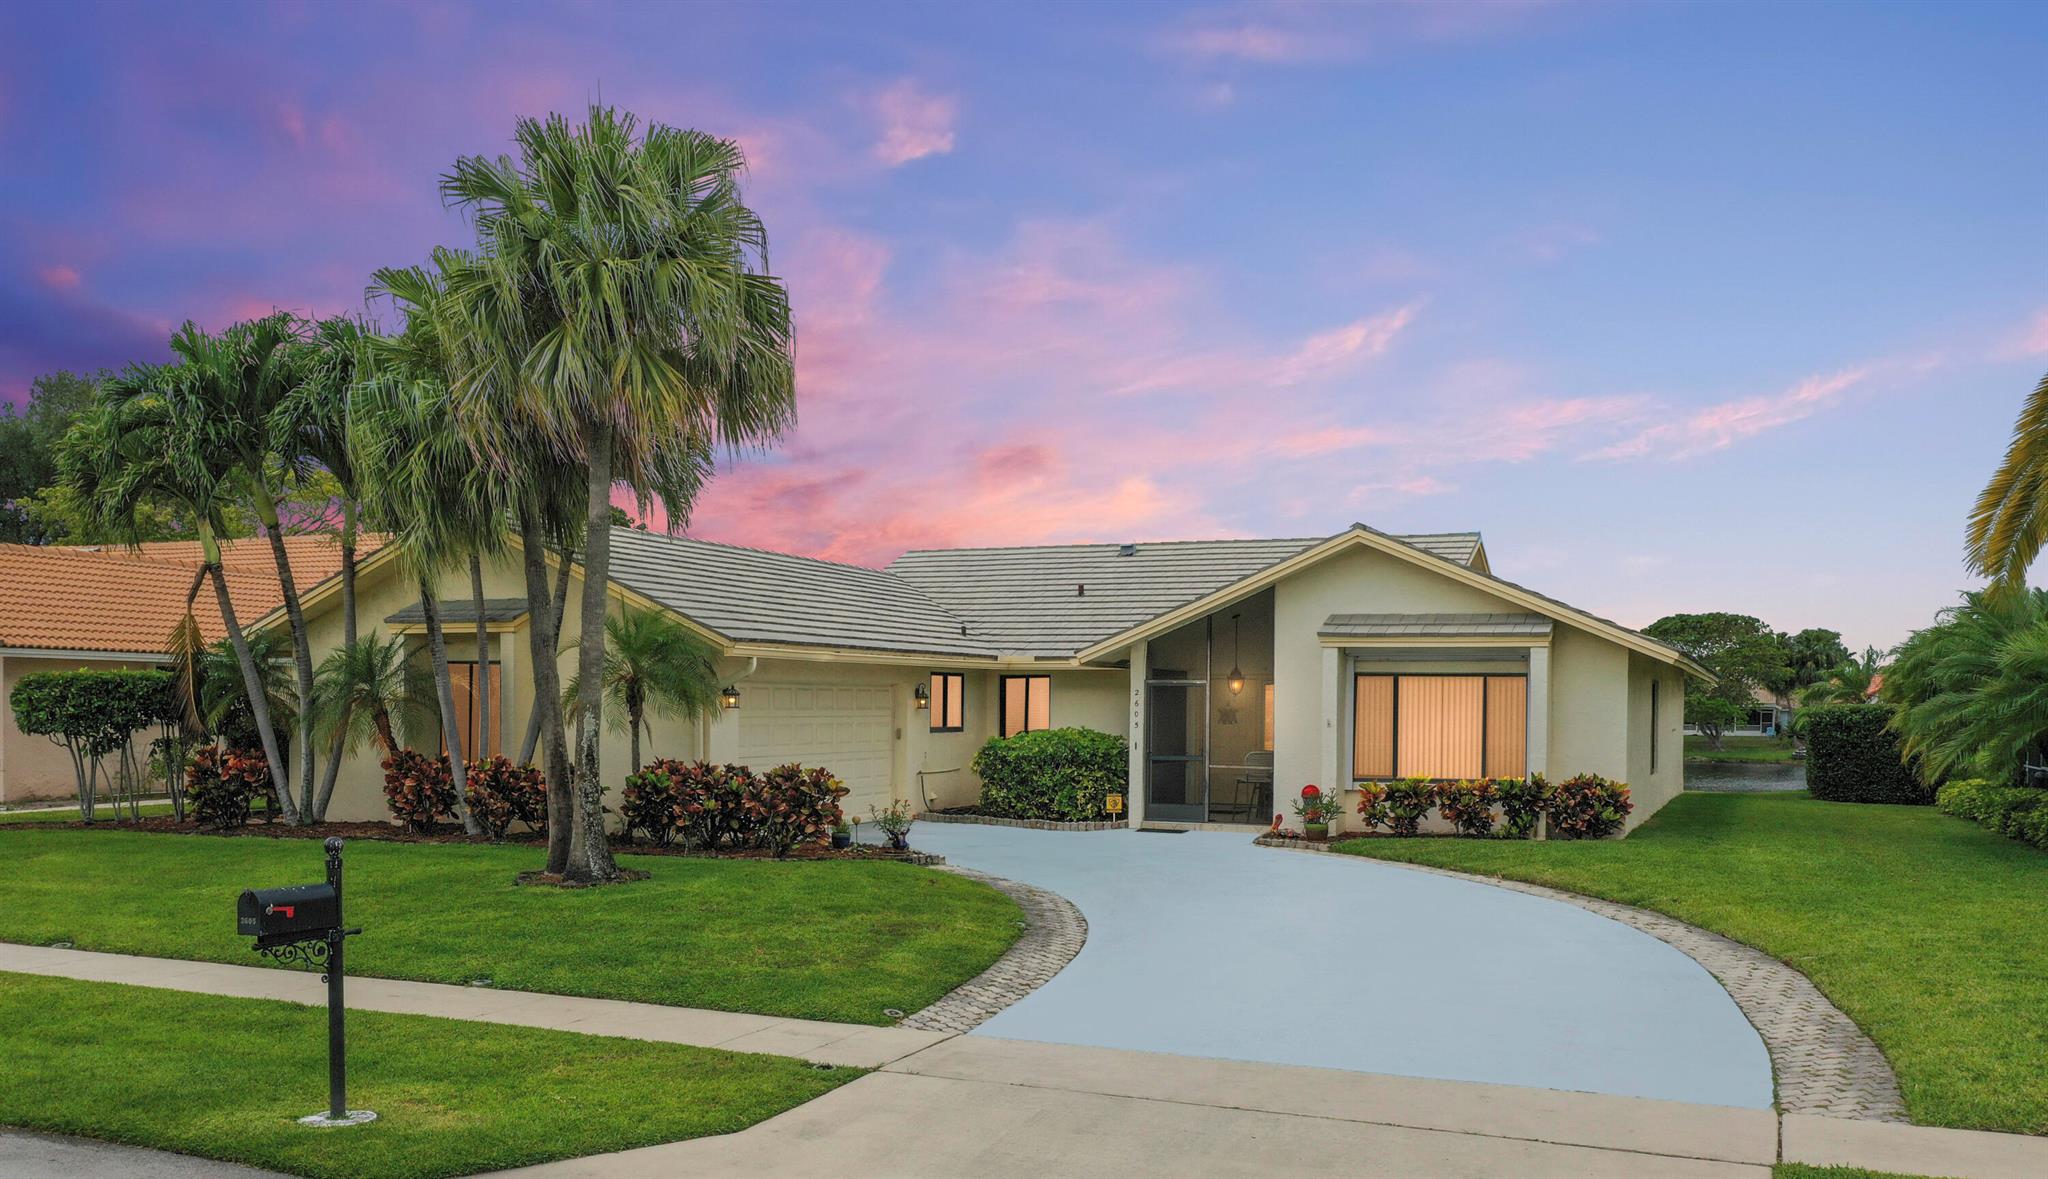
Active
$599,999
3
bds
|
3
ba
|
2,335
sqft
|
built
1987
2605 SW 23rd Cranbrook Dr, Boynton Beach, FL 33436
$-1,162
Cash flow
-10.1%
Cash-on-Cash Return
4.0%
Cap rate
0.7%
Rent to Value Ratio

Active
$545,000
1
bds
|
2
ba
|
1,080
sqft
|
built
1960
716 Rider Rd, Boynton Beach, FL 33435
$-1,270
Cash flow
-12.2%
Cash-on-Cash Return
3.5%
Cap rate
0.5%
Rent to Value Ratio
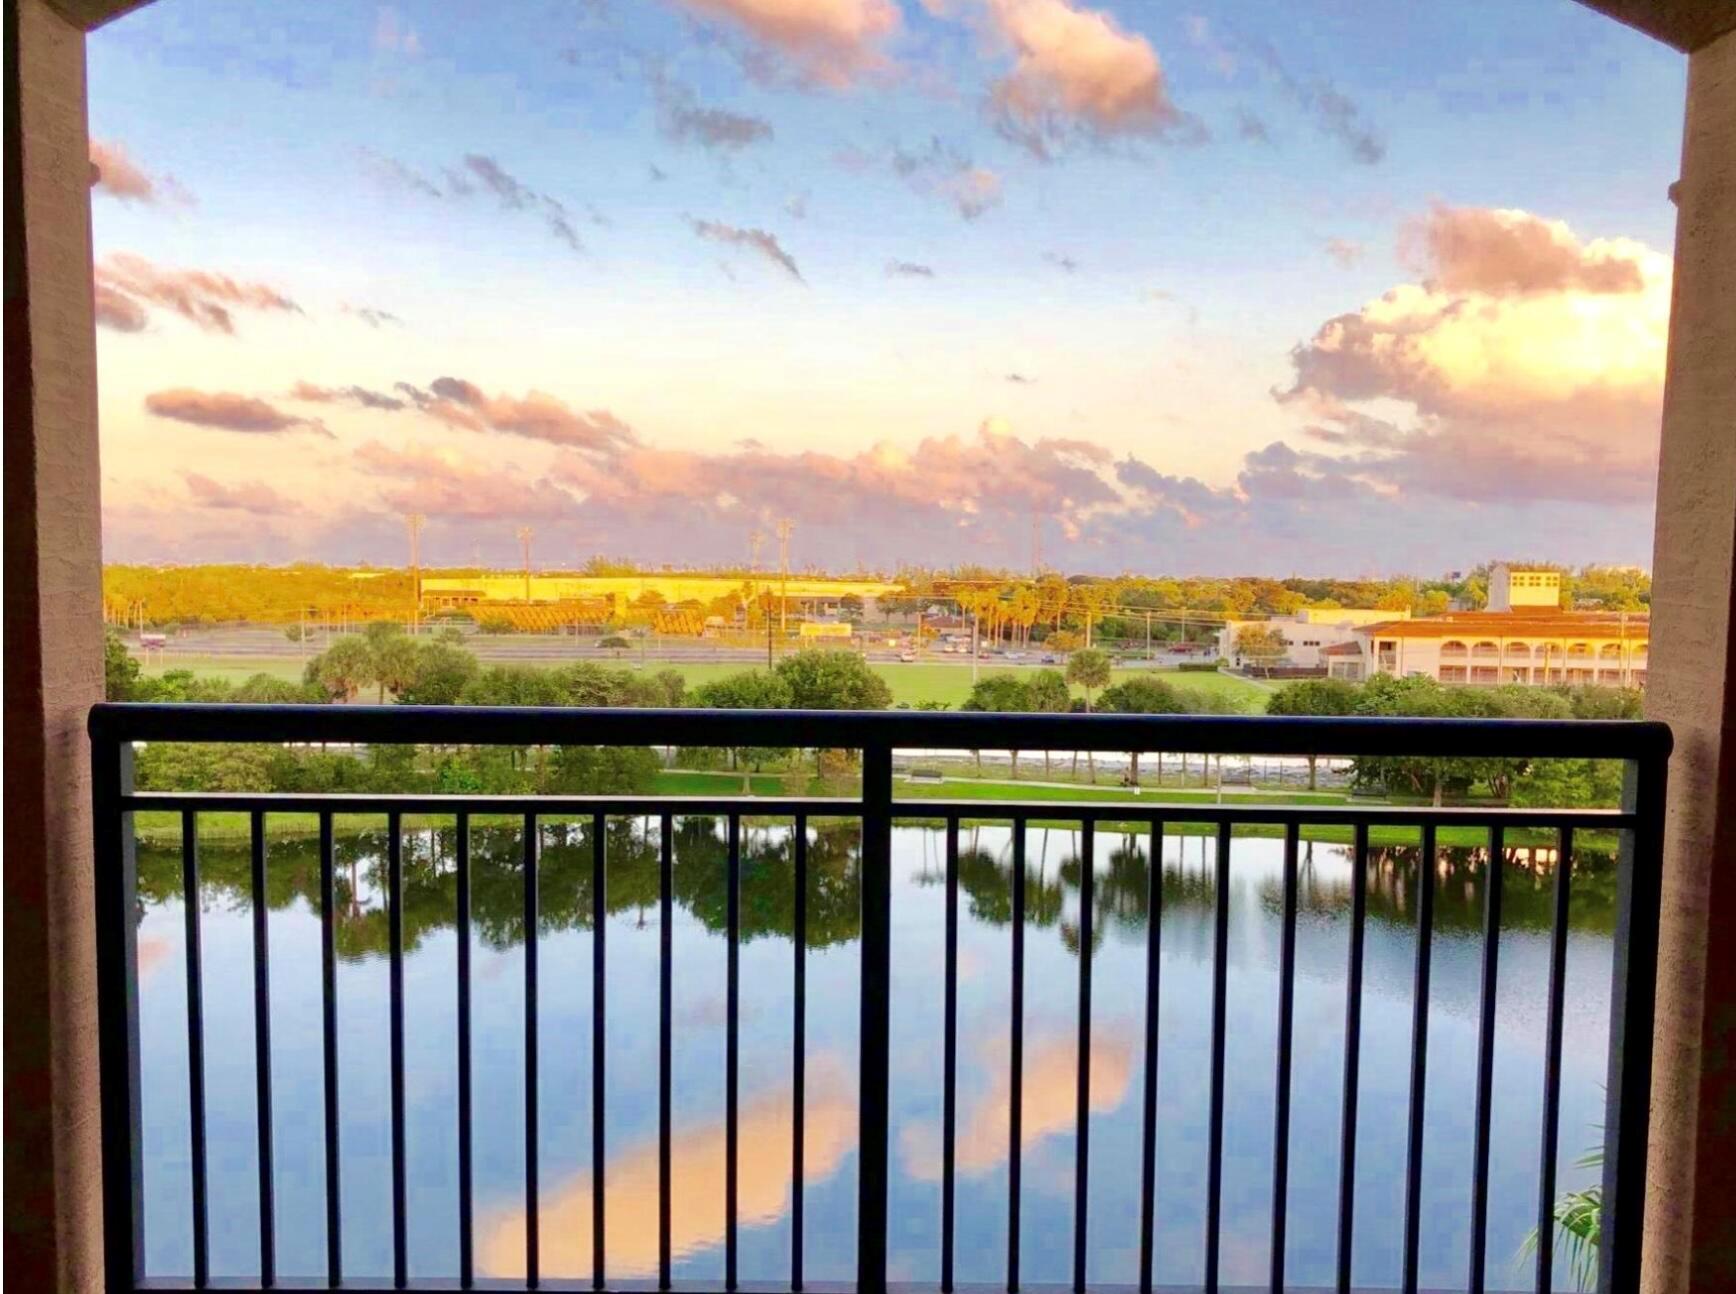
Active
$255,000
2
bds
|
2
ba
|
1,119
sqft
|
built
2007
1660 Renaissance Commons Blvd, Boynton Beach, FL 33426
$-926
Cash flow
-18.9%
Cash-on-Cash Return
1.9%
Cap rate
0.9%
Rent to Value Ratio
Active
$329,000
2
bds
|
2
ba
|
1,323
sqft
|
built
1992
9818 Nickels Blvd, Boynton Beach, FL 33436
$-863
Cash flow
-13.7%
Cash-on-Cash Return
3.1%
Cap rate
0.8%
Rent to Value Ratio
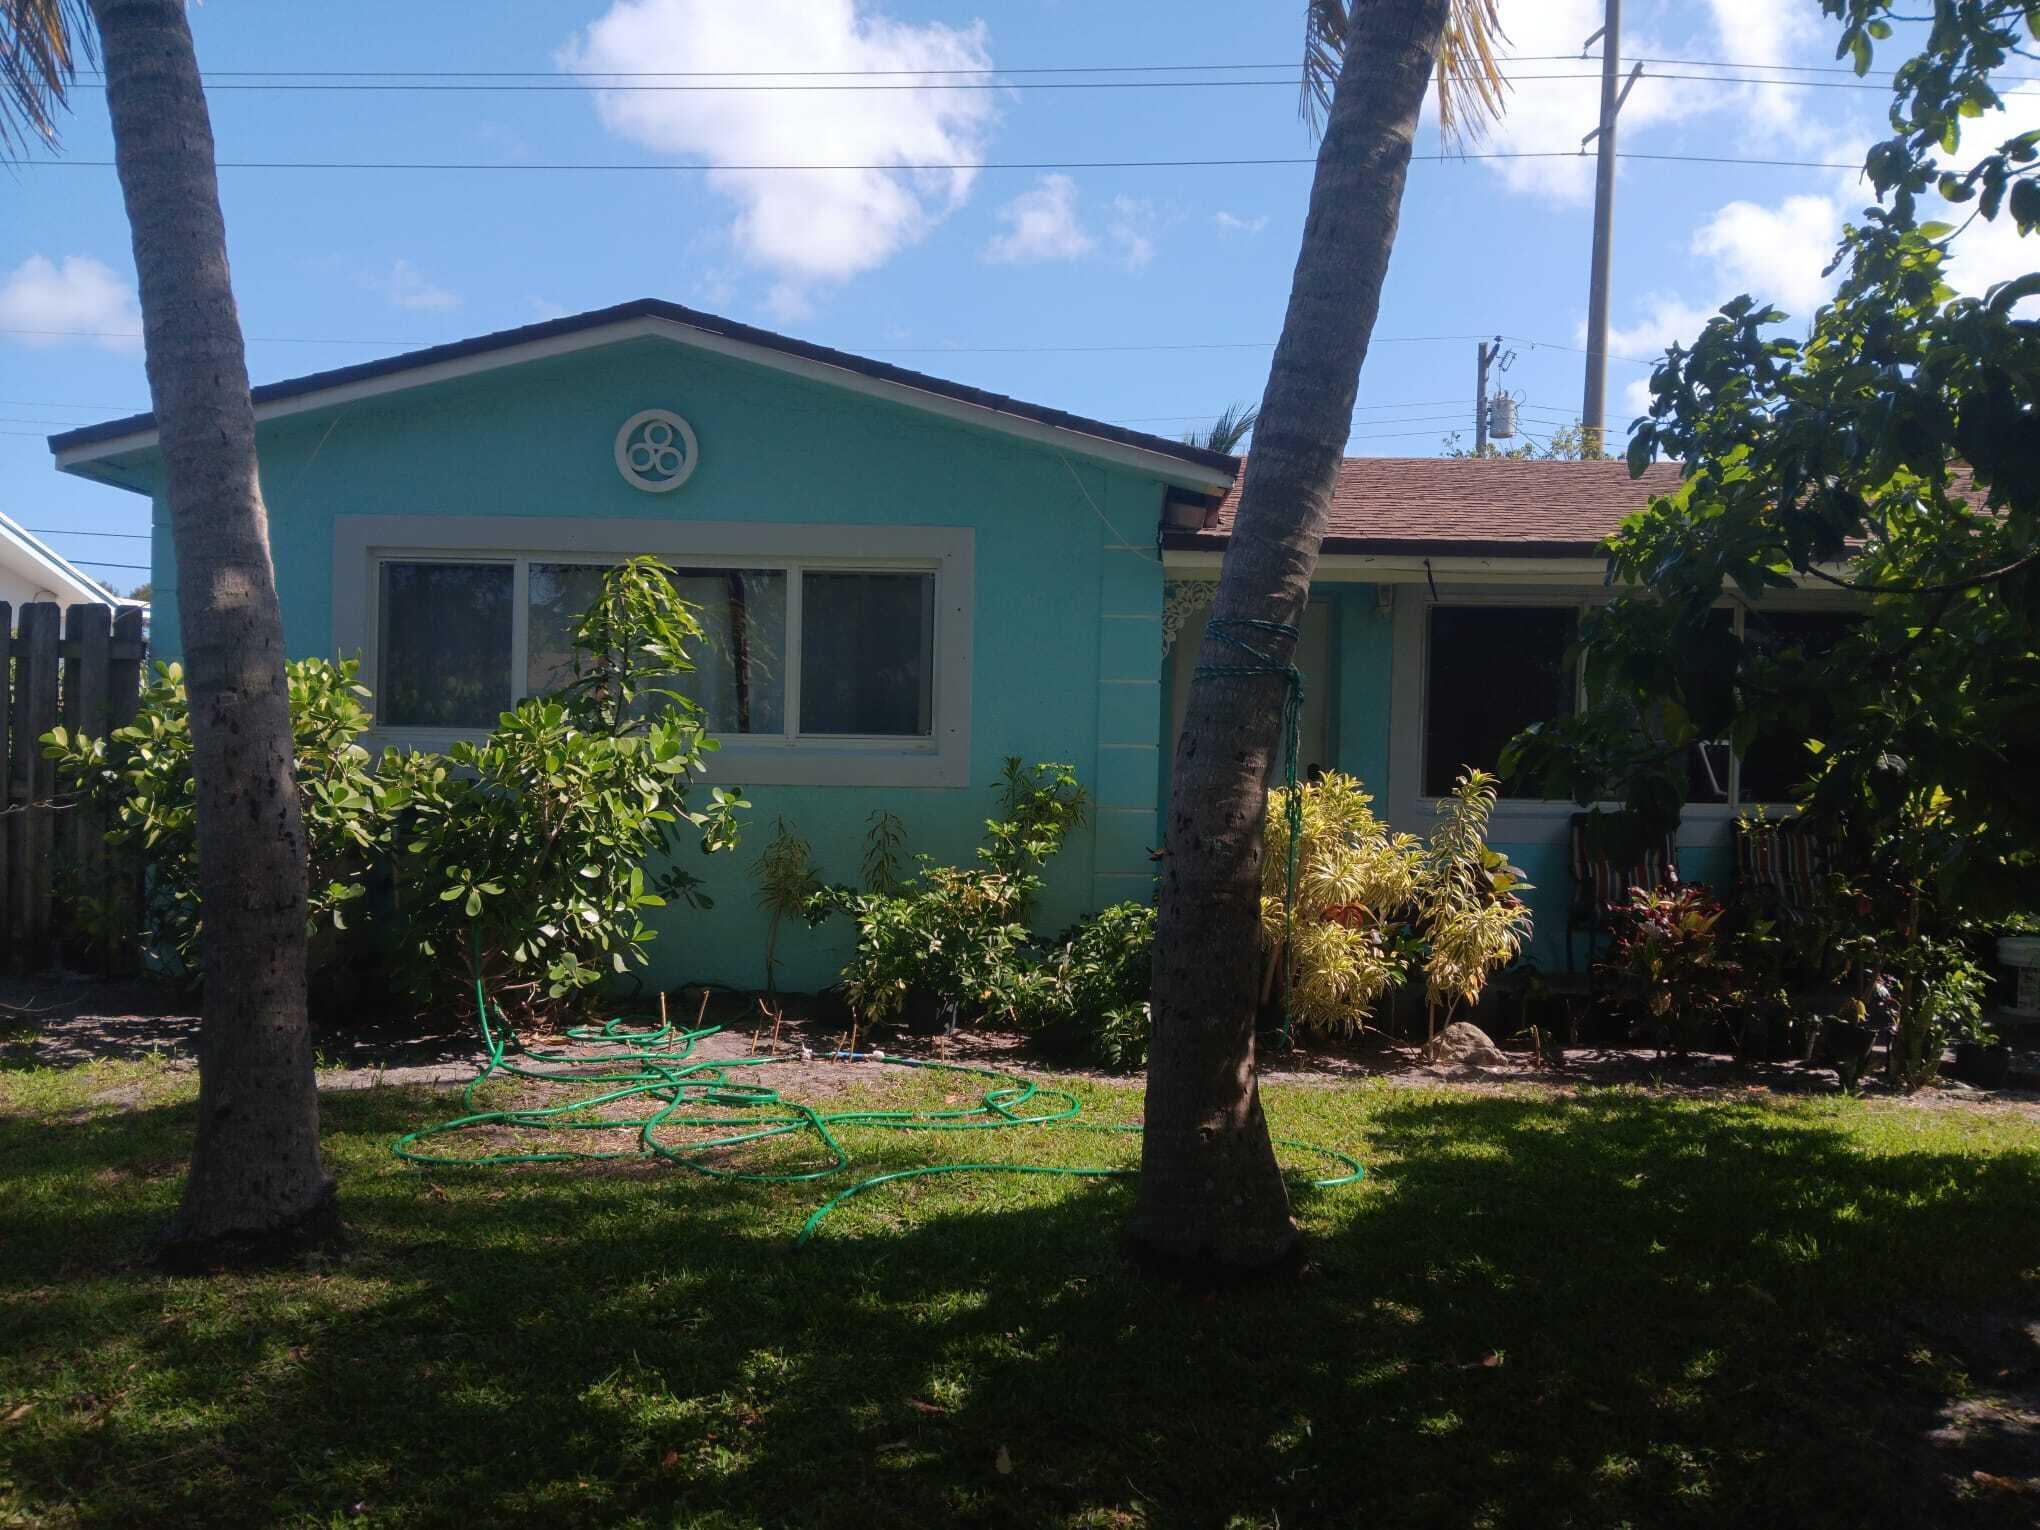
Active
$372,000
3
bds
|
2
ba
|
1,615
sqft
|
built
1963
120 S Atlantic Dr W, Boynton Beach, FL 33435
$-473
Cash flow
-6.6%
Cash-on-Cash Return
4.8%
Cap rate
0.8%
Rent to Value Ratio
Active
$740,000
4
bds
|
0
ba
|
2,503
sqft
|
built
1975
400 NE 2nd St, Boynton Beach, FL 33435
$-2,653
Cash flow
-18.7%
Cash-on-Cash Return
2.0%
Cap rate
0.4%
Rent to Value Ratio
Active
$529,000
2
bds
|
2
ba
|
1,130
sqft
|
built
2006
625 Casa Loma Blvd, Boynton Beach, FL 33435
$-2,495
Cash flow
-24.6%
Cash-on-Cash Return
0.6%
Cap rate
0.6%
Rent to Value Ratio