Boynton Beach, FL Investment Properties for Sale
Browse homes for sale and investment properties in Boynton Beach, FL. Refine your search by price, property type, or more.
Best cash flowing properties in Boynton Beach, FL
Active
$204,900
2
bds
|
2
ba
|
986
sqft
|
built
1979
2181 W Woolbright Rd, Boynton Beach, FL 33426
$-228
Cash flow
-5.8%
Cash-on-Cash Return
4.9%
Cap rate
1.0%
Rent to Value Ratio
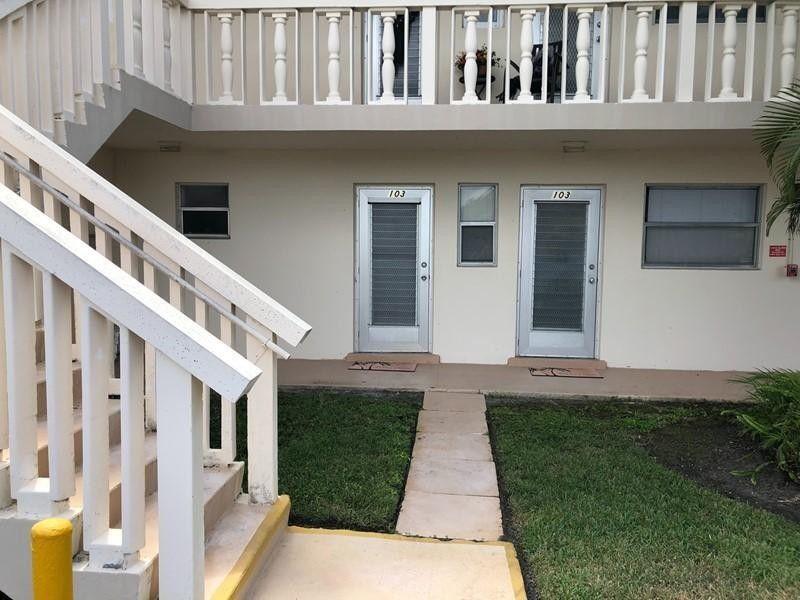
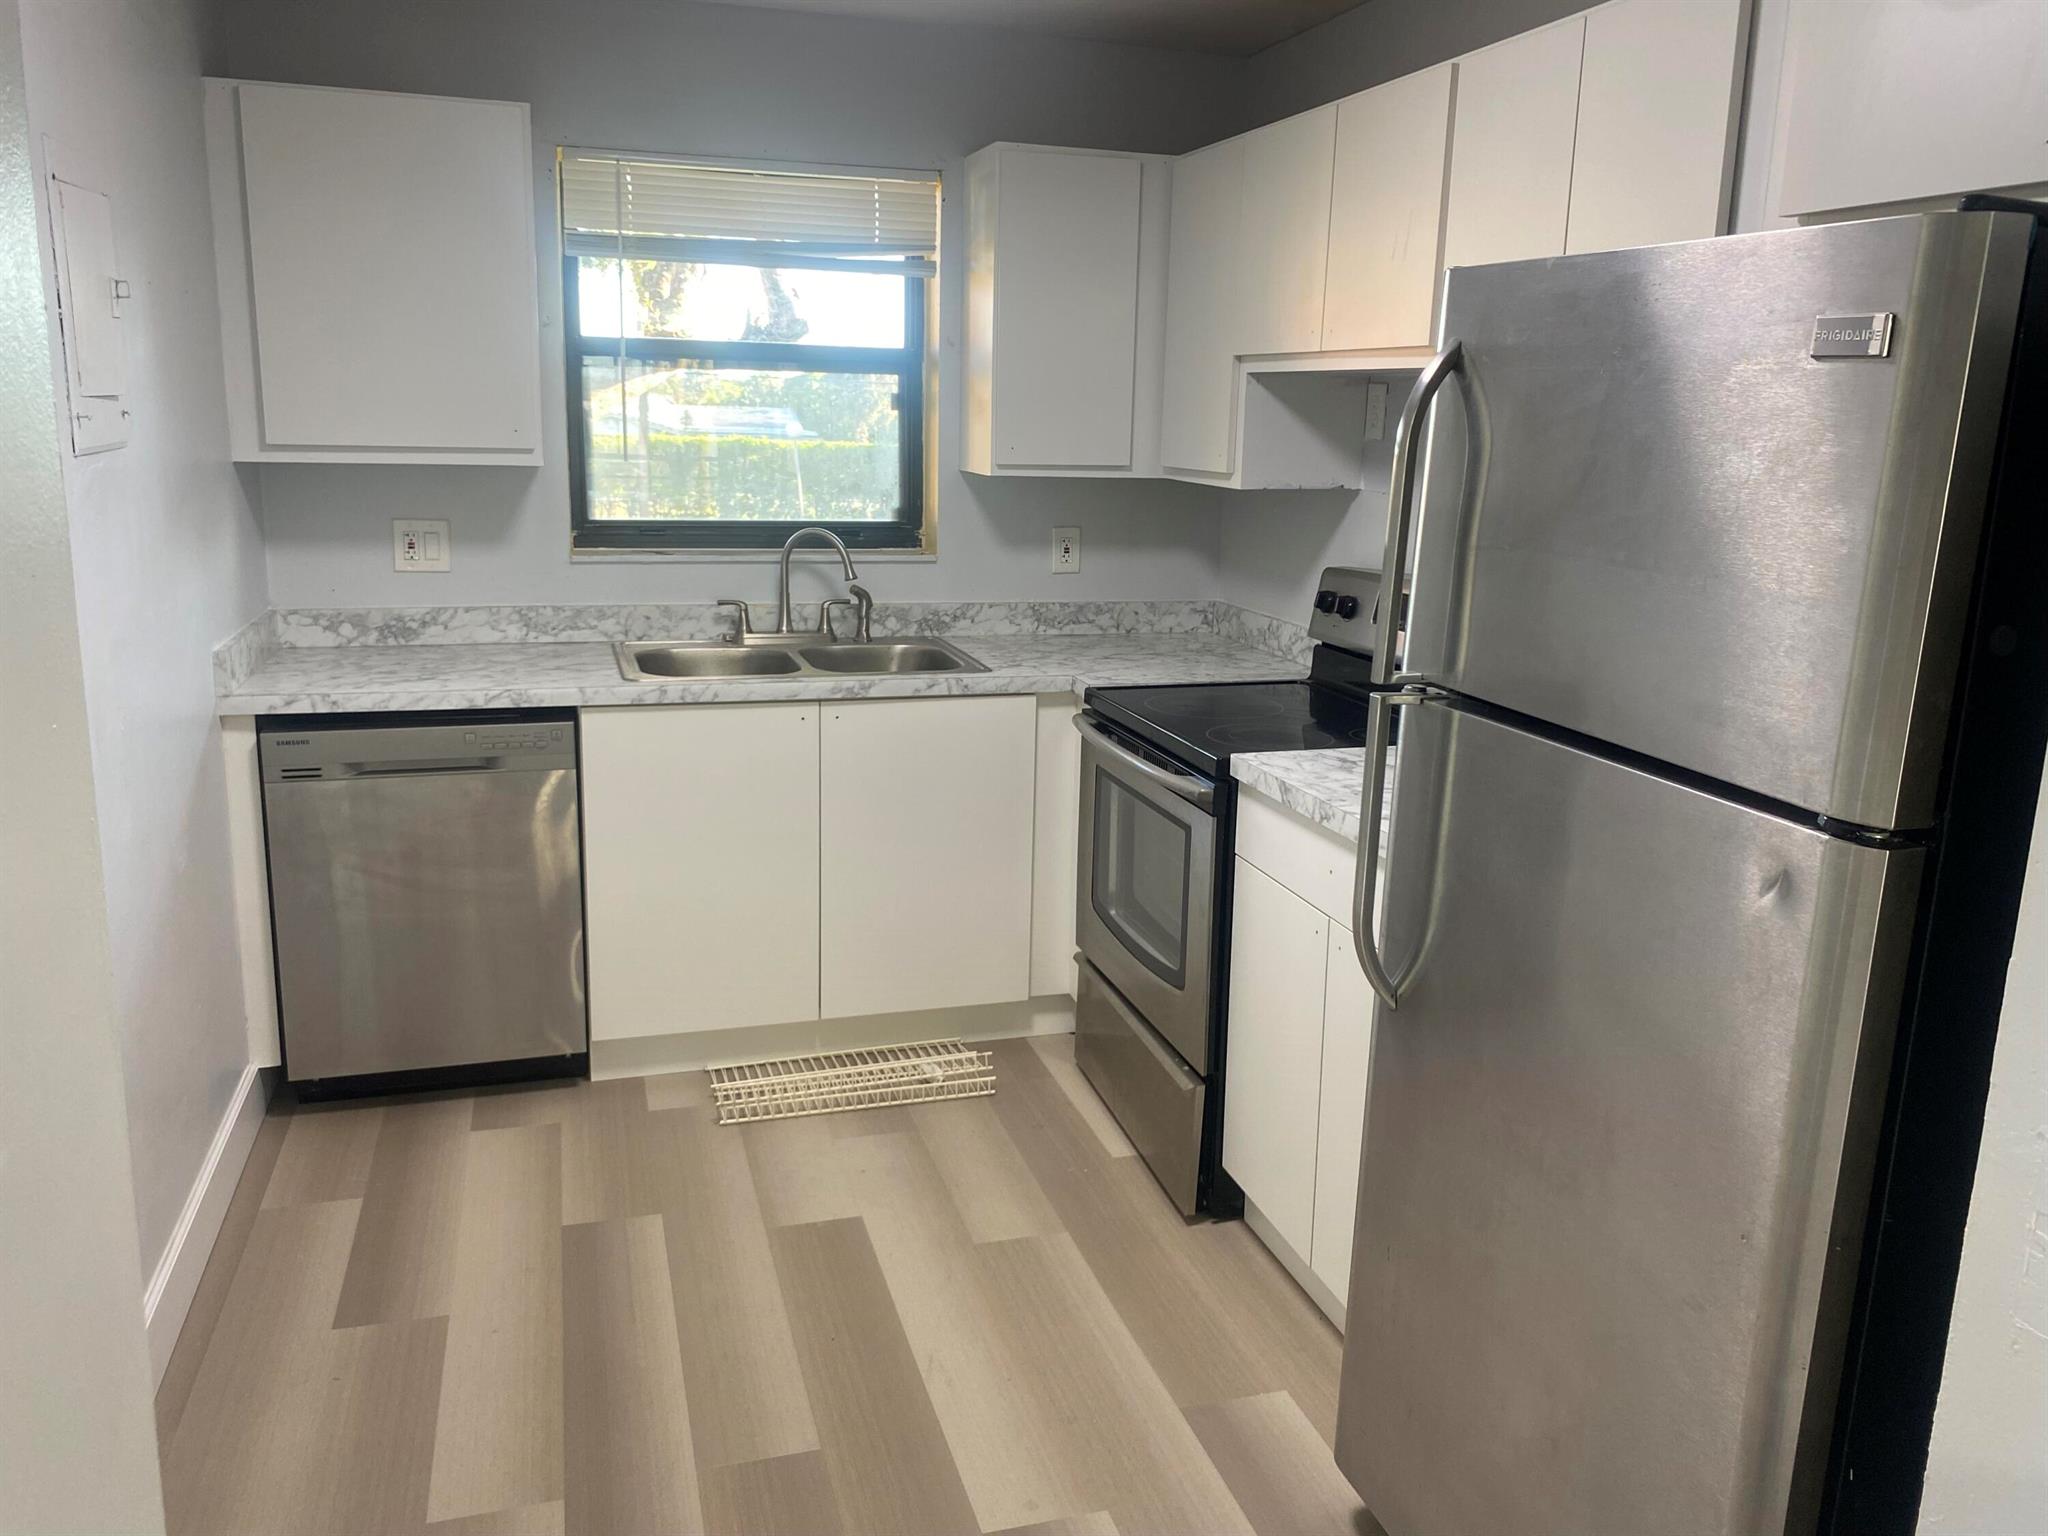
Active
$119,000
1
bds
|
2
ba
|
624
sqft
|
built
1970
2191 NE 1st Ct, Boynton Beach, FL 33435
$-229
Cash flow
-10.0%
Cash-on-Cash Return
4.0%
Cap rate
1.3%
Rent to Value Ratio
612 out of 707 properties for sale in Boynton Beach, FL
Limited Results Shown
Create a free account, or log in to reveal all property listings and enjoy the complete experience.
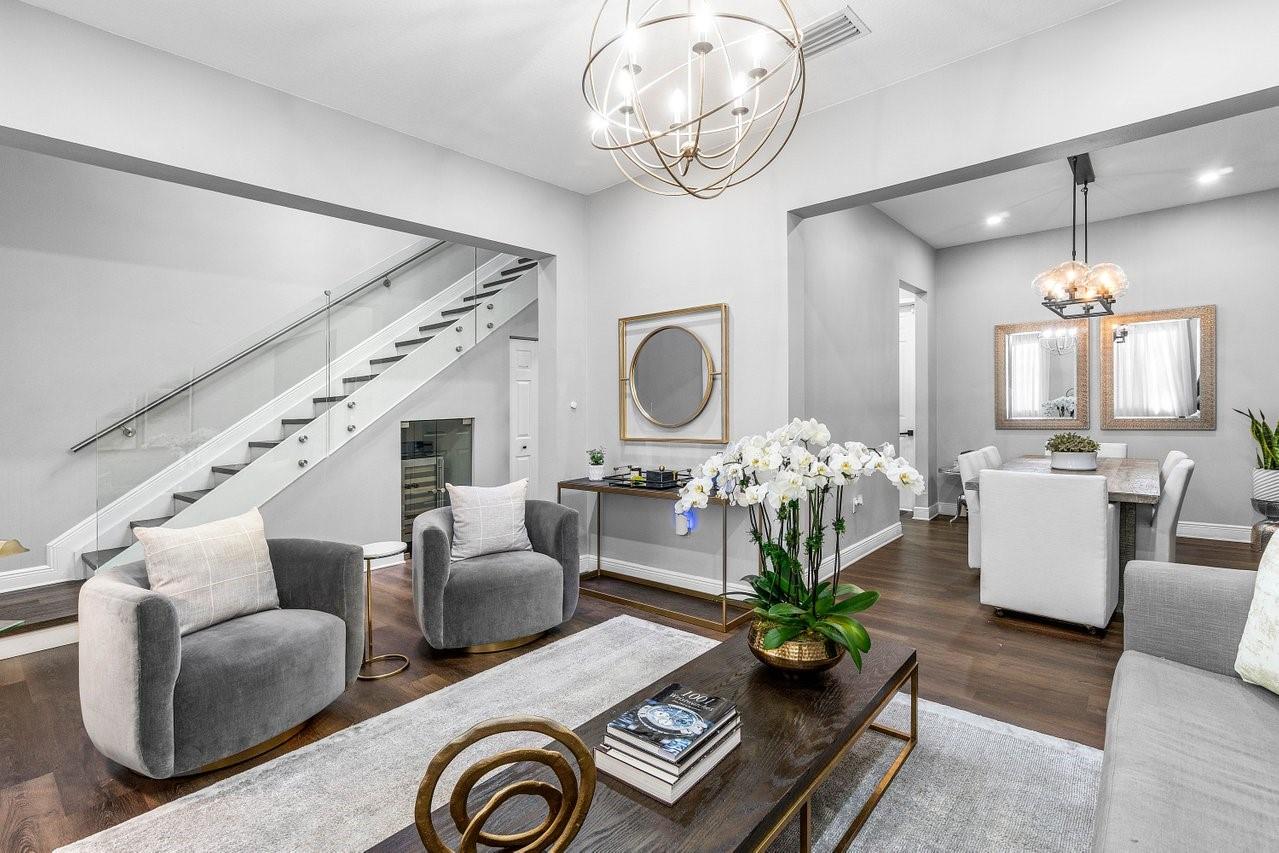
Active
$539,000
3
bds
|
3
ba
|
1,624
sqft
|
built
2006
2404 Venetian Way, Boynton Beach, FL 33426
$-1,737
Cash flow
-16.8%
Cash-on-Cash Return
2.4%
Cap rate
0.6%
Rent to Value Ratio
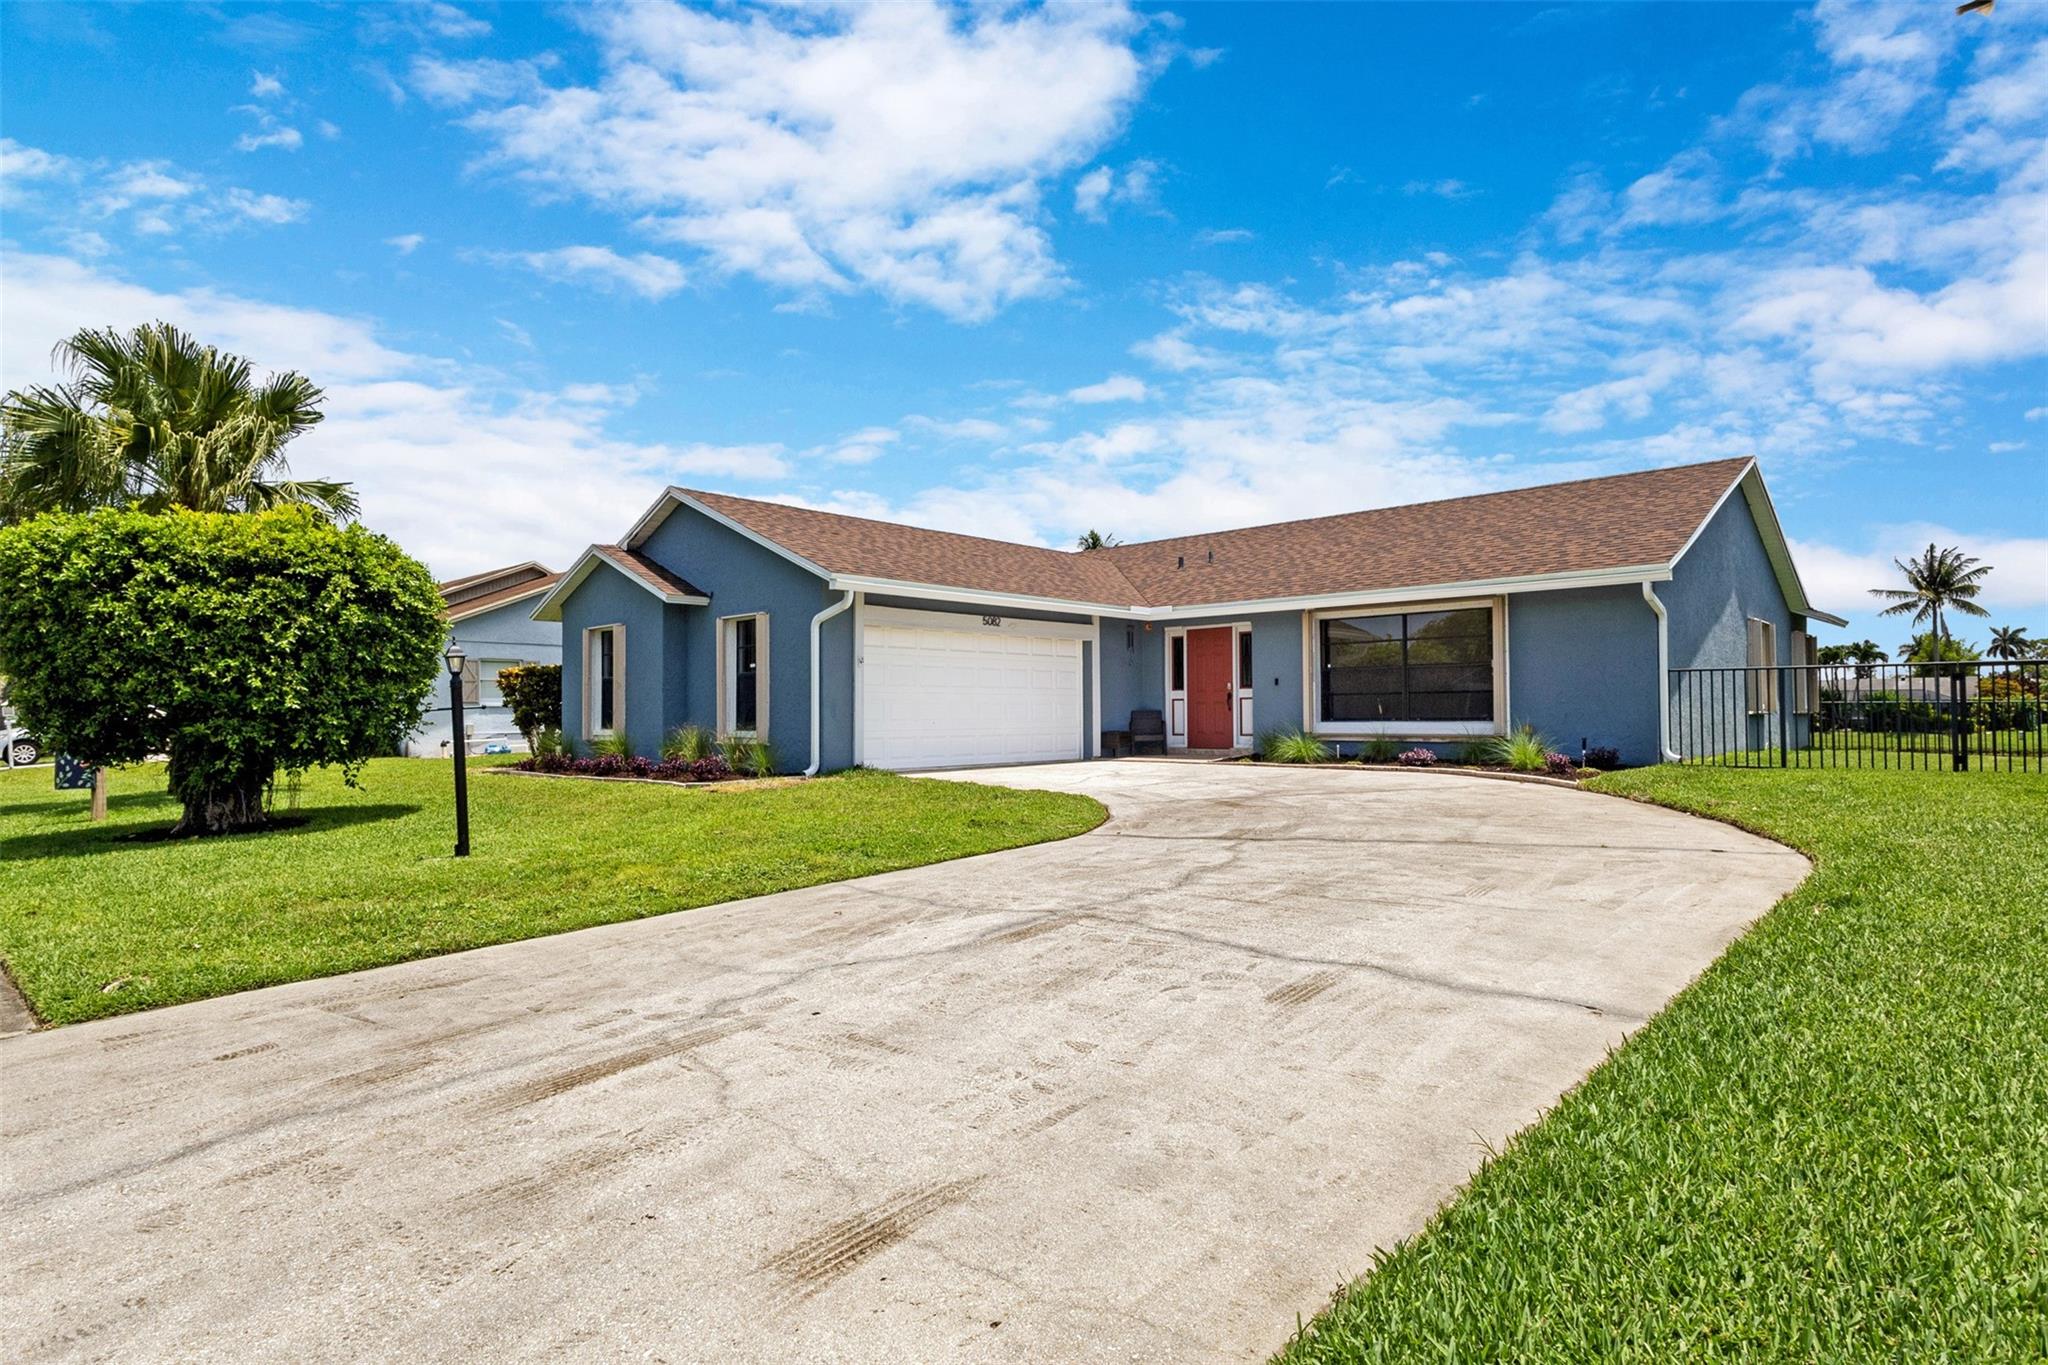
Pending
$525,000
3
bds
|
2
ba
|
1,550
sqft
|
built
1978
5082 Little Beth Dr N, Boynton Beach, FL 33472
$-1,149
Cash flow
-11.4%
Cash-on-Cash Return
3.7%
Cap rate
0.6%
Rent to Value Ratio
Active
$355,000
2
bds
|
2
ba
|
1,350
sqft
|
built
1989
8912 Thumbwood Cir, Boynton Beach, FL 33436
$-928
Cash flow
-13.6%
Cash-on-Cash Return
3.1%
Cap rate
0.7%
Rent to Value Ratio
Active
$204,900
2
bds
|
2
ba
|
986
sqft
|
built
1979
2181 W Woolbright Rd, Boynton Beach, FL 33426
$-228
Cash flow
-5.8%
Cash-on-Cash Return
4.9%
Cap rate
1.0%
Rent to Value Ratio
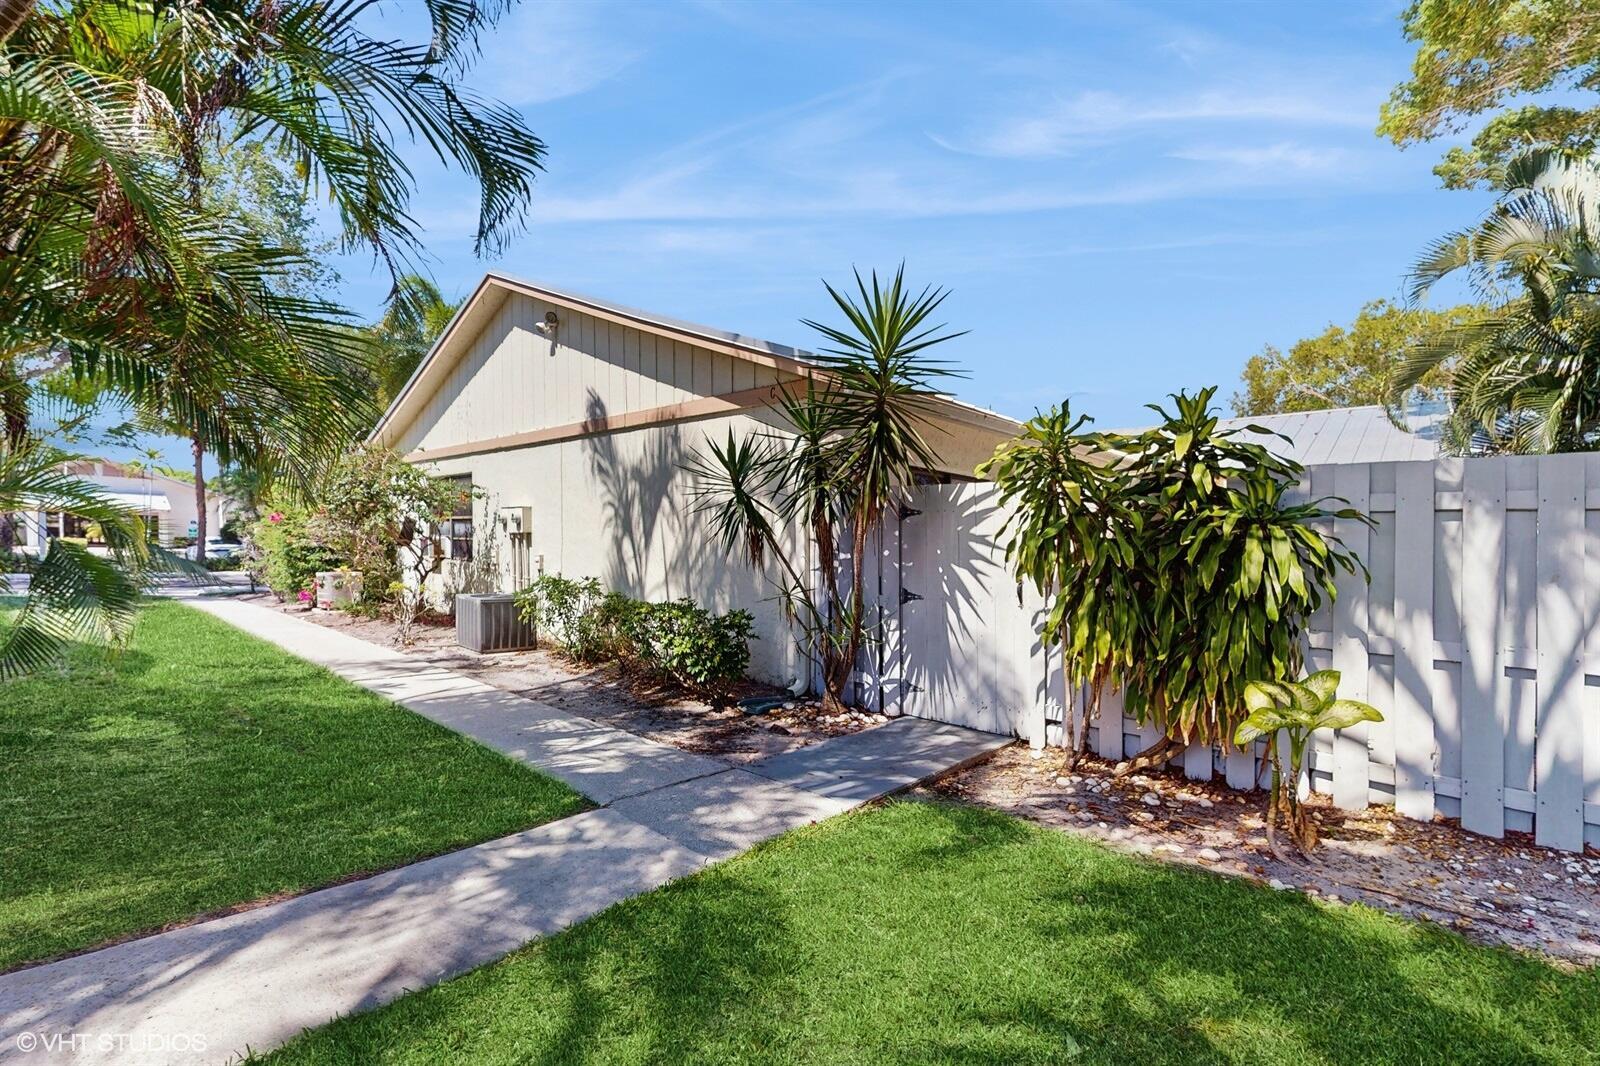
Active
$499,000
3
bds
|
3
ba
|
1,901
sqft
|
built
1956
1115 S Seacrest Blvd, Boynton Beach, FL 33435
$-557
Cash flow
-5.8%
Cash-on-Cash Return
4.9%
Cap rate
0.6%
Rent to Value Ratio
Active
$545,000
3
bds
|
3
ba
|
2,157
sqft
|
built
1989
8500 Tourmaline Blvd, Boynton Beach, FL 33472
$-742
Cash flow
-7.1%
Cash-on-Cash Return
4.7%
Cap rate
0.6%
Rent to Value Ratio
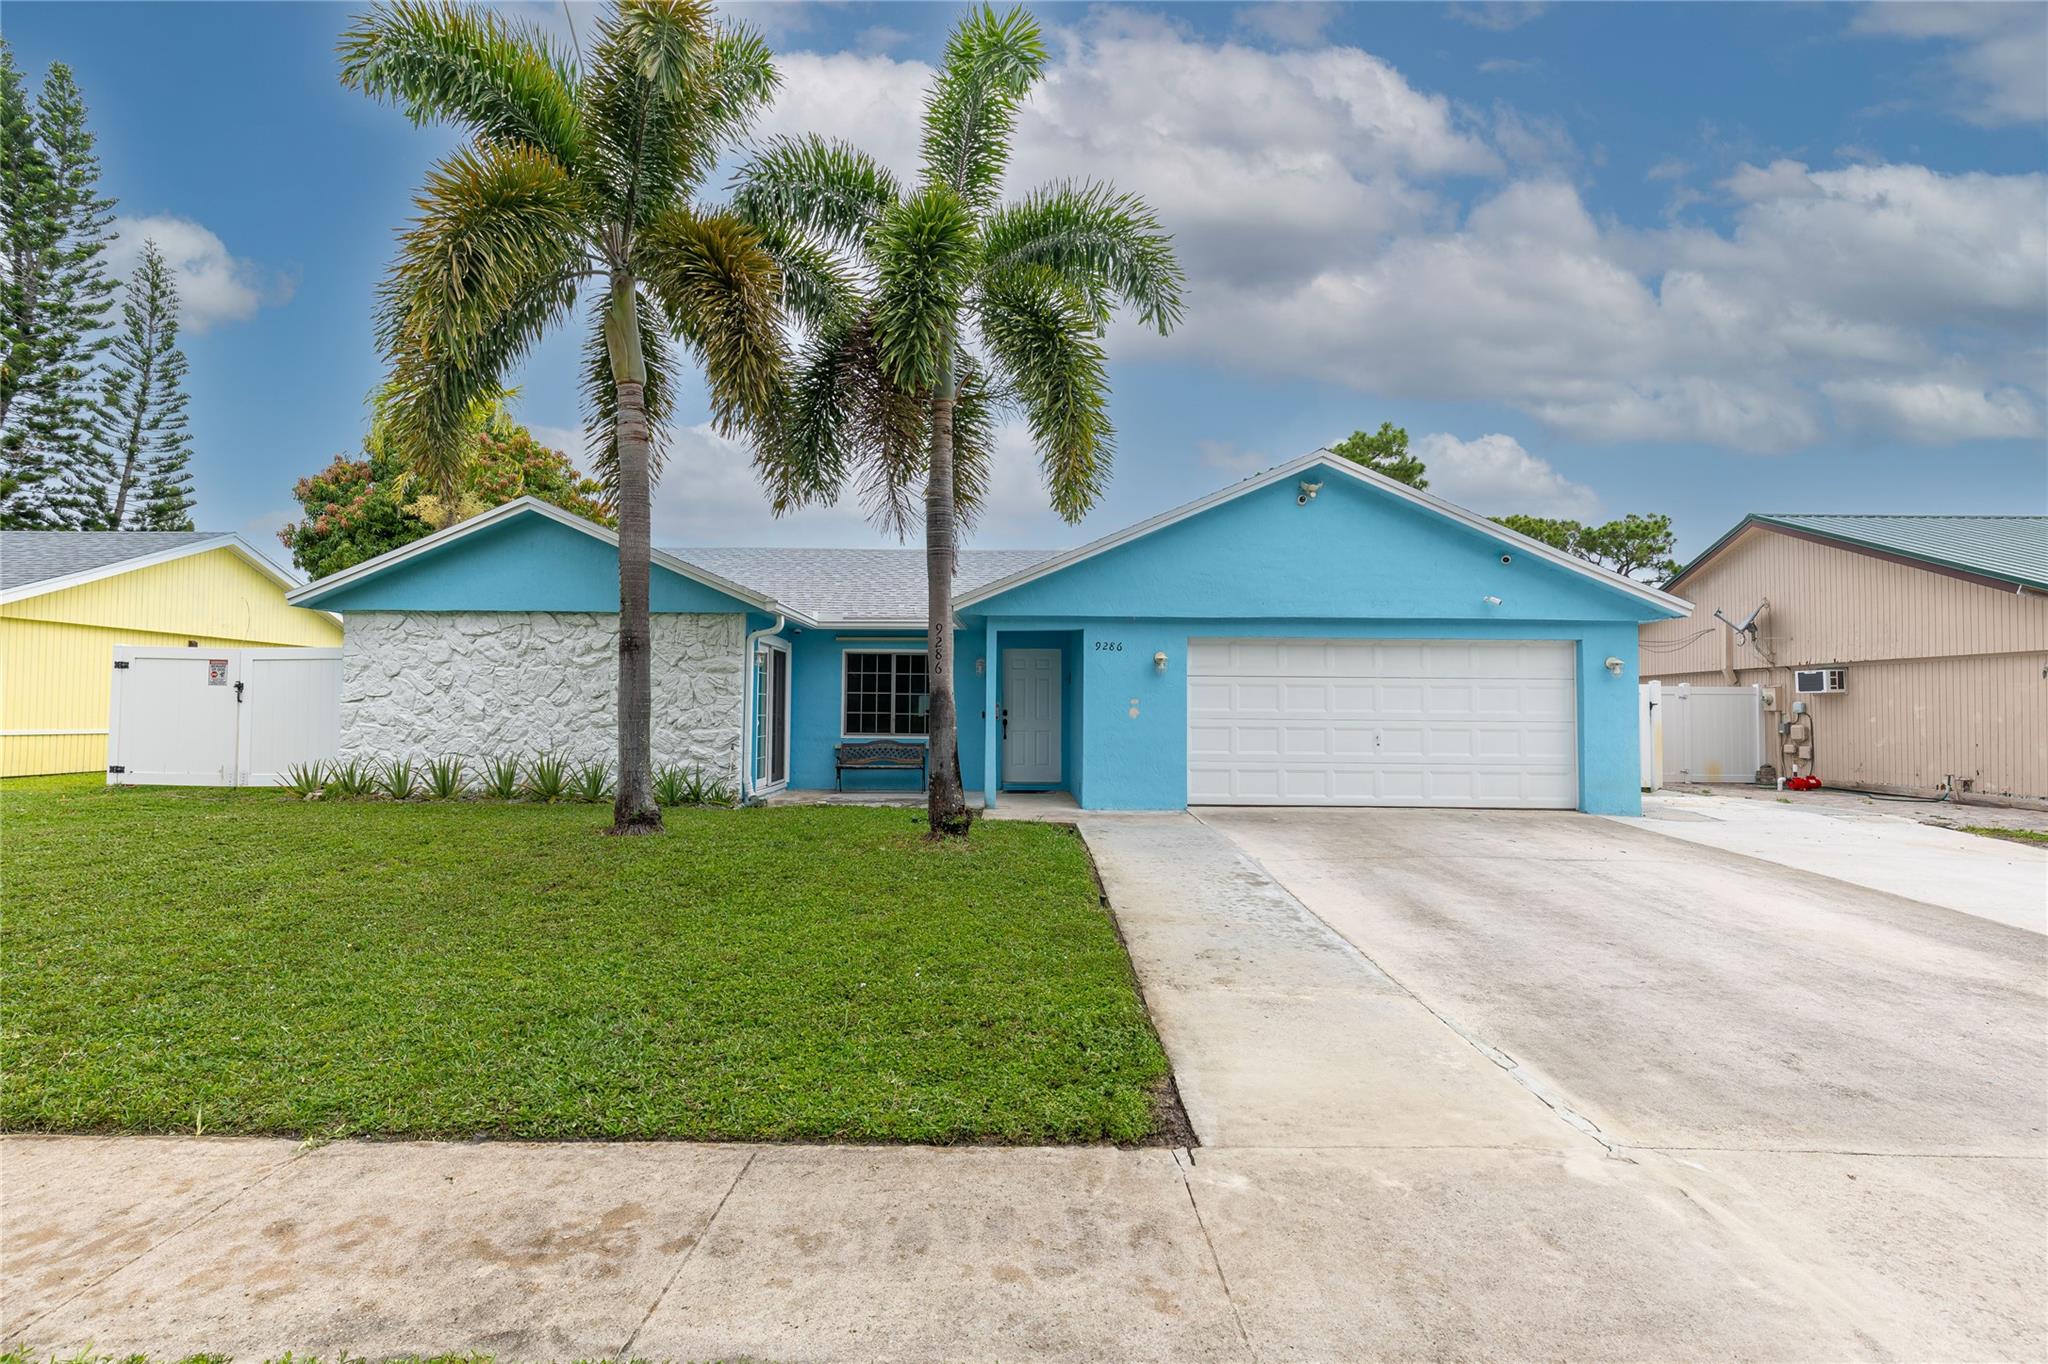
Active
$515,000
3
bds
|
2
ba
|
1,216
sqft
|
built
1980
9286 Longmeadow Cir, Boynton Beach, FL 33436
$-825
Cash flow
-8.4%
Cash-on-Cash Return
4.4%
Cap rate
0.6%
Rent to Value Ratio
Active
$549,000
3
bds
|
2
ba
|
1,600
sqft
|
built
1962
1083 SW 25th Pl, Boynton Beach, FL 33426
$-856
Cash flow
-8.1%
Cash-on-Cash Return
4.4%
Cap rate
0.6%
Rent to Value Ratio
Active
$325,000
3
bds
|
2
ba
|
1,580
sqft
|
built
1990
9770 Nickels Blvd, Boynton Beach, FL 33436
$-847
Cash flow
-13.6%
Cash-on-Cash Return
3.2%
Cap rate
0.9%
Rent to Value Ratio
Active
$639,900
3
bds
|
2
ba
|
1,619
sqft
|
built
1971
1056 SW 27th Ave, Boynton Beach, FL 33426
$-1,604
Cash flow
-13.1%
Cash-on-Cash Return
3.3%
Cap rate
0.5%
Rent to Value Ratio
Active
$860,000
4
bds
|
3
ba
|
2,910
sqft
|
built
2005
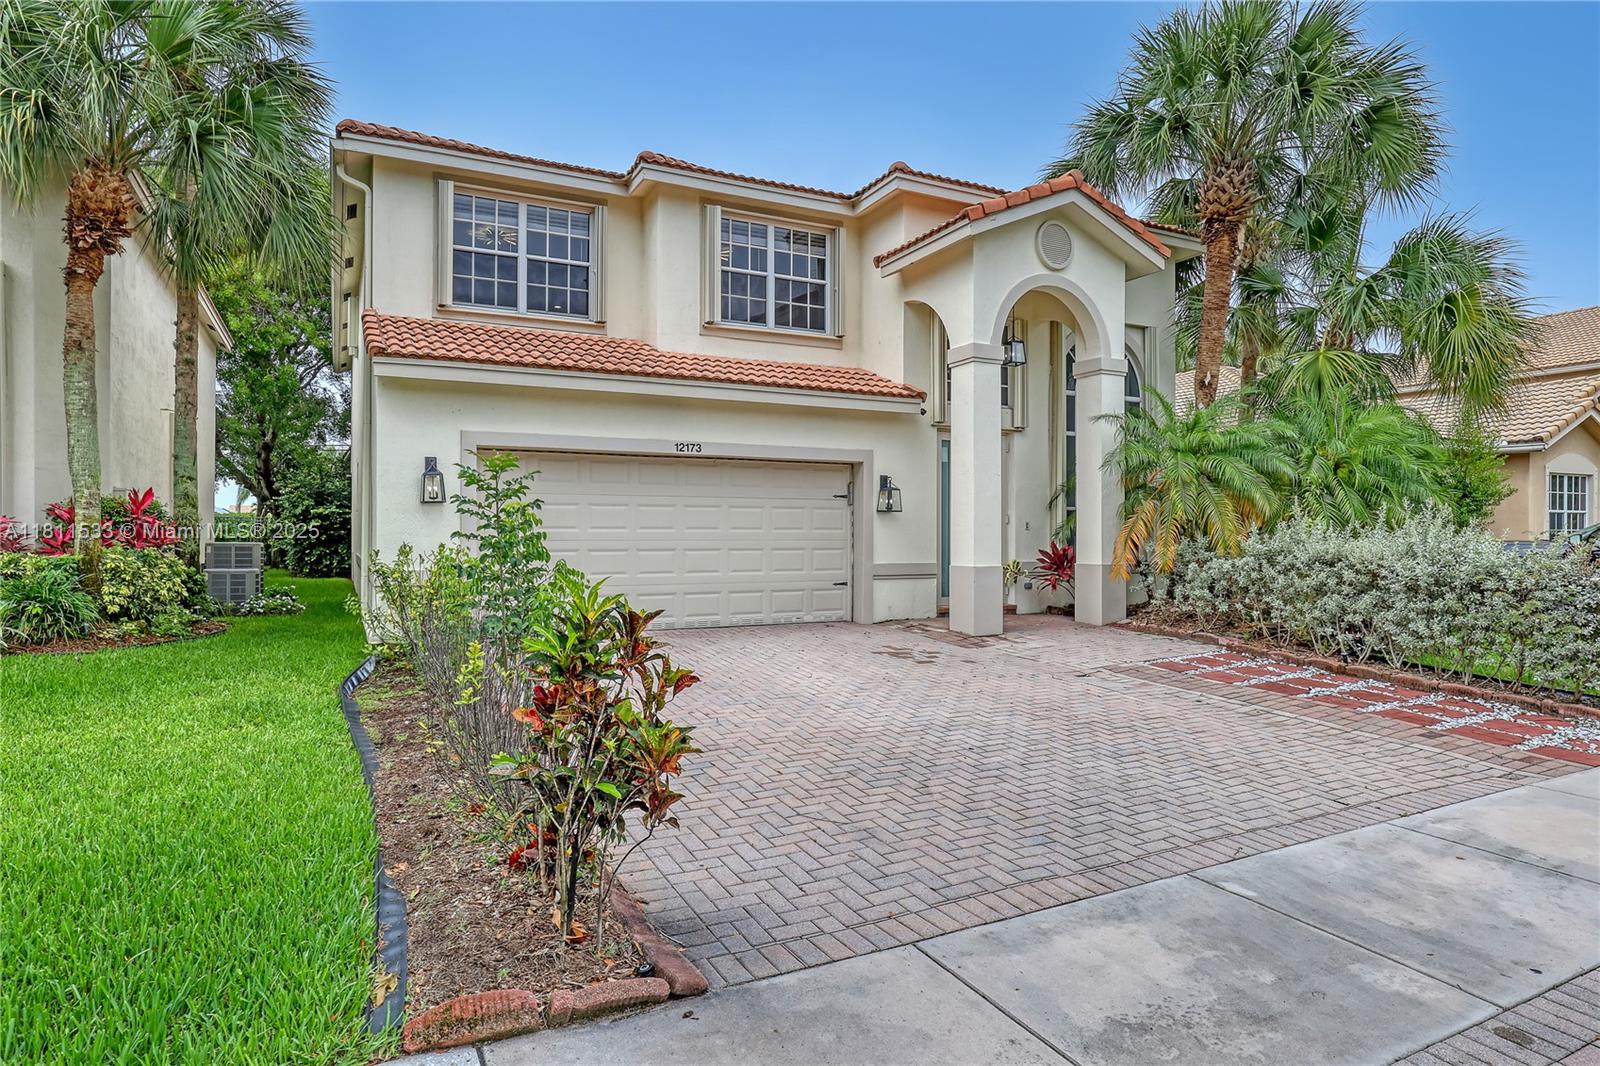
12173 Colony Preserve Dr, Boynton Beach, FL 33436
$-2,871
Cash flow
-17.4%
Cash-on-Cash Return
2.3%
Cap rate
0.5%
Rent to Value Ratio
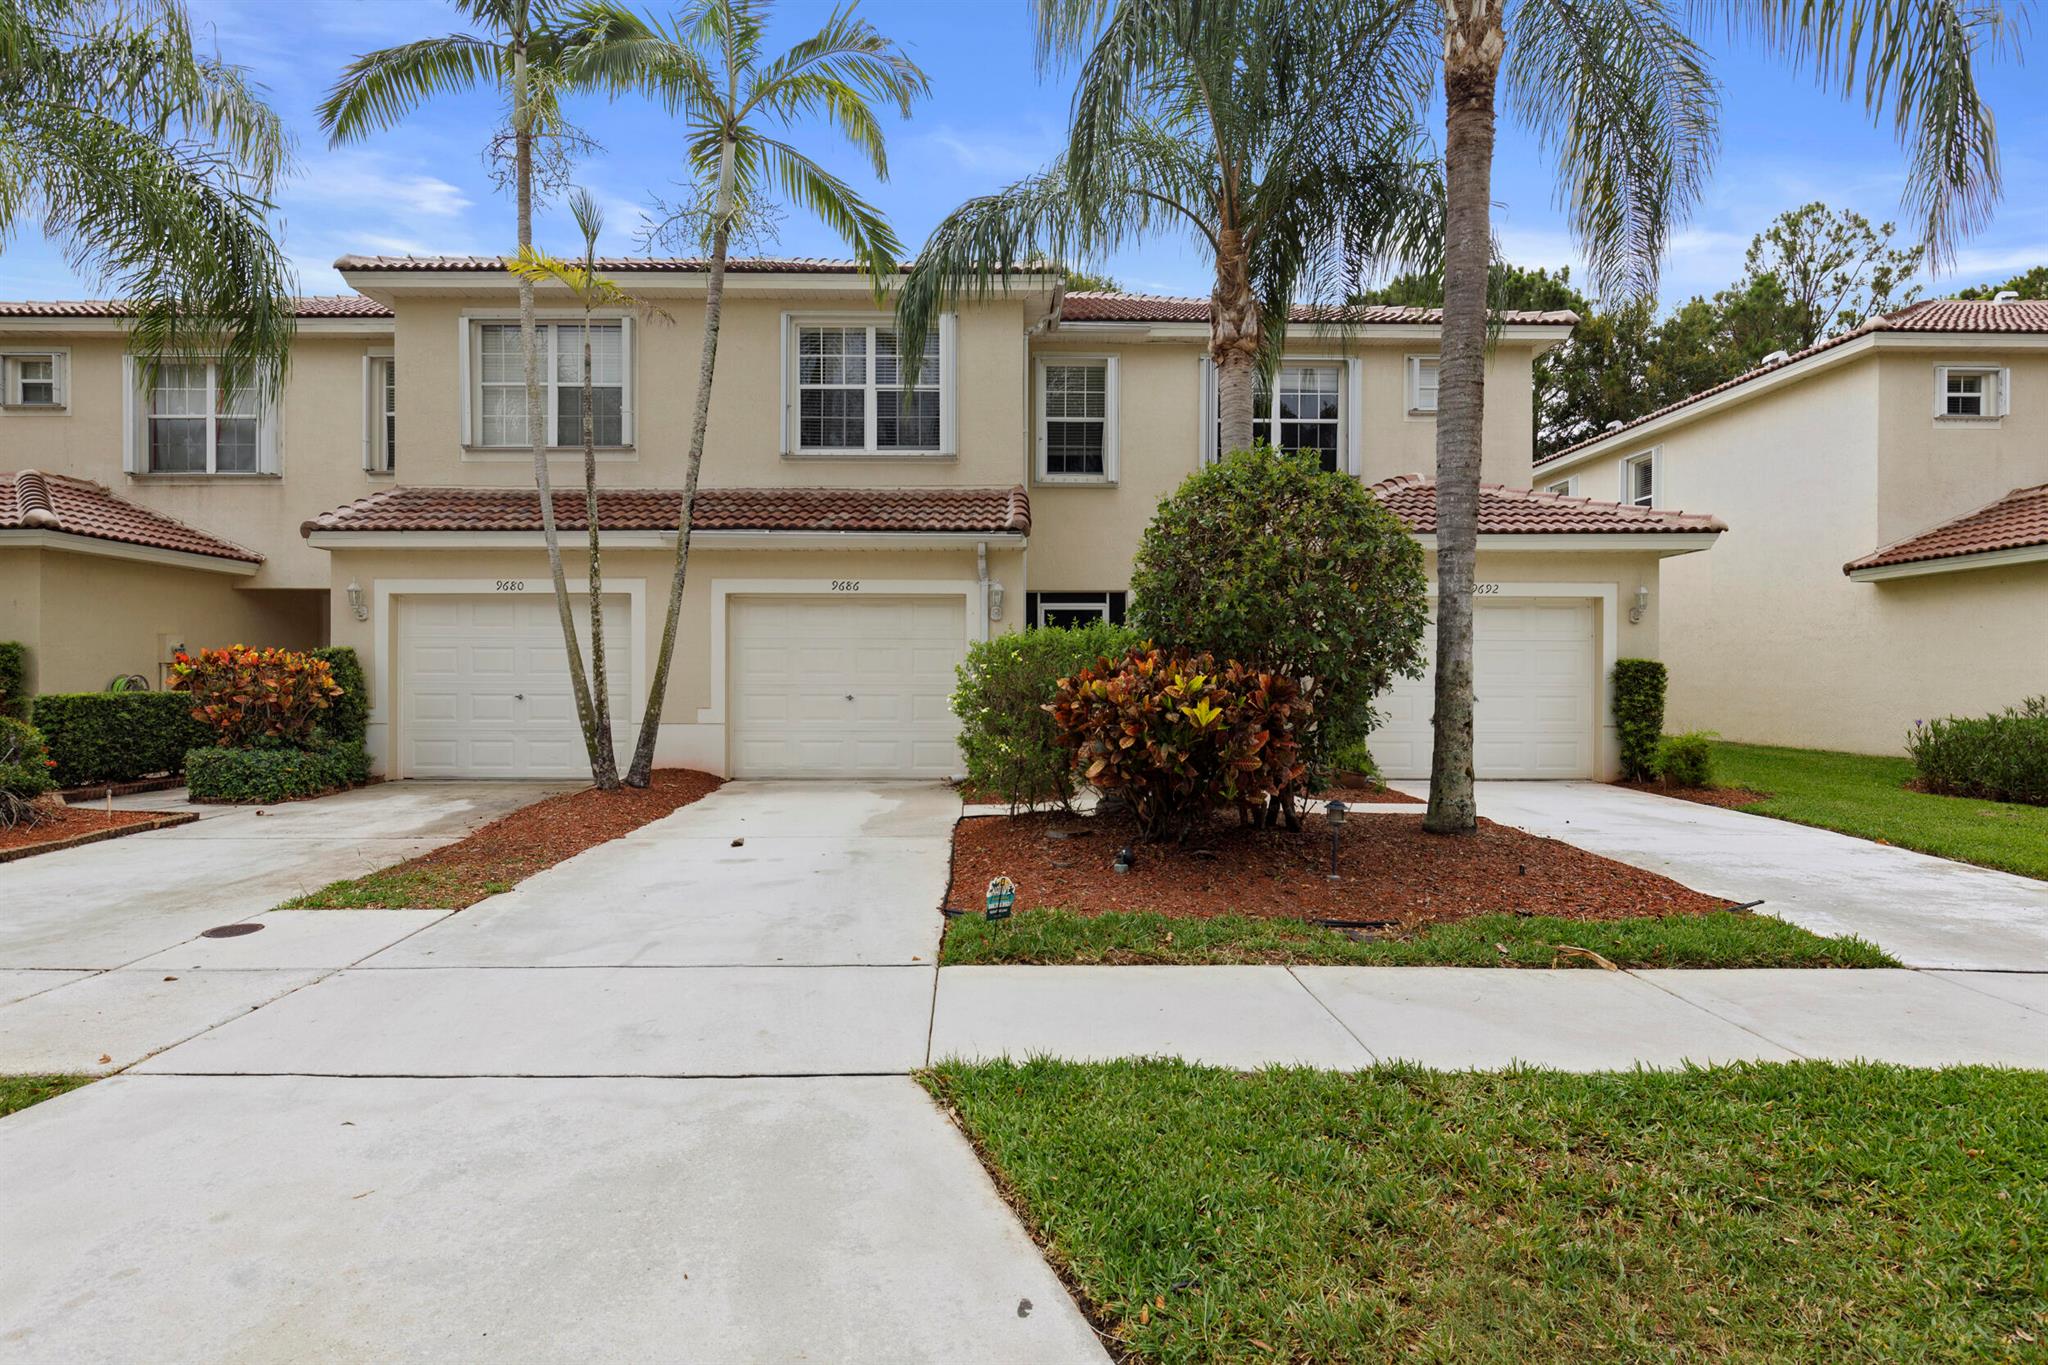
Active
$450,000
3
bds
|
3
ba
|
1,570
sqft
|
built
2001
9686 Lago Dr, Boynton Beach, FL 33472
$-802
Cash flow
-9.3%
Cash-on-Cash Return
4.1%
Cap rate
0.7%
Rent to Value Ratio
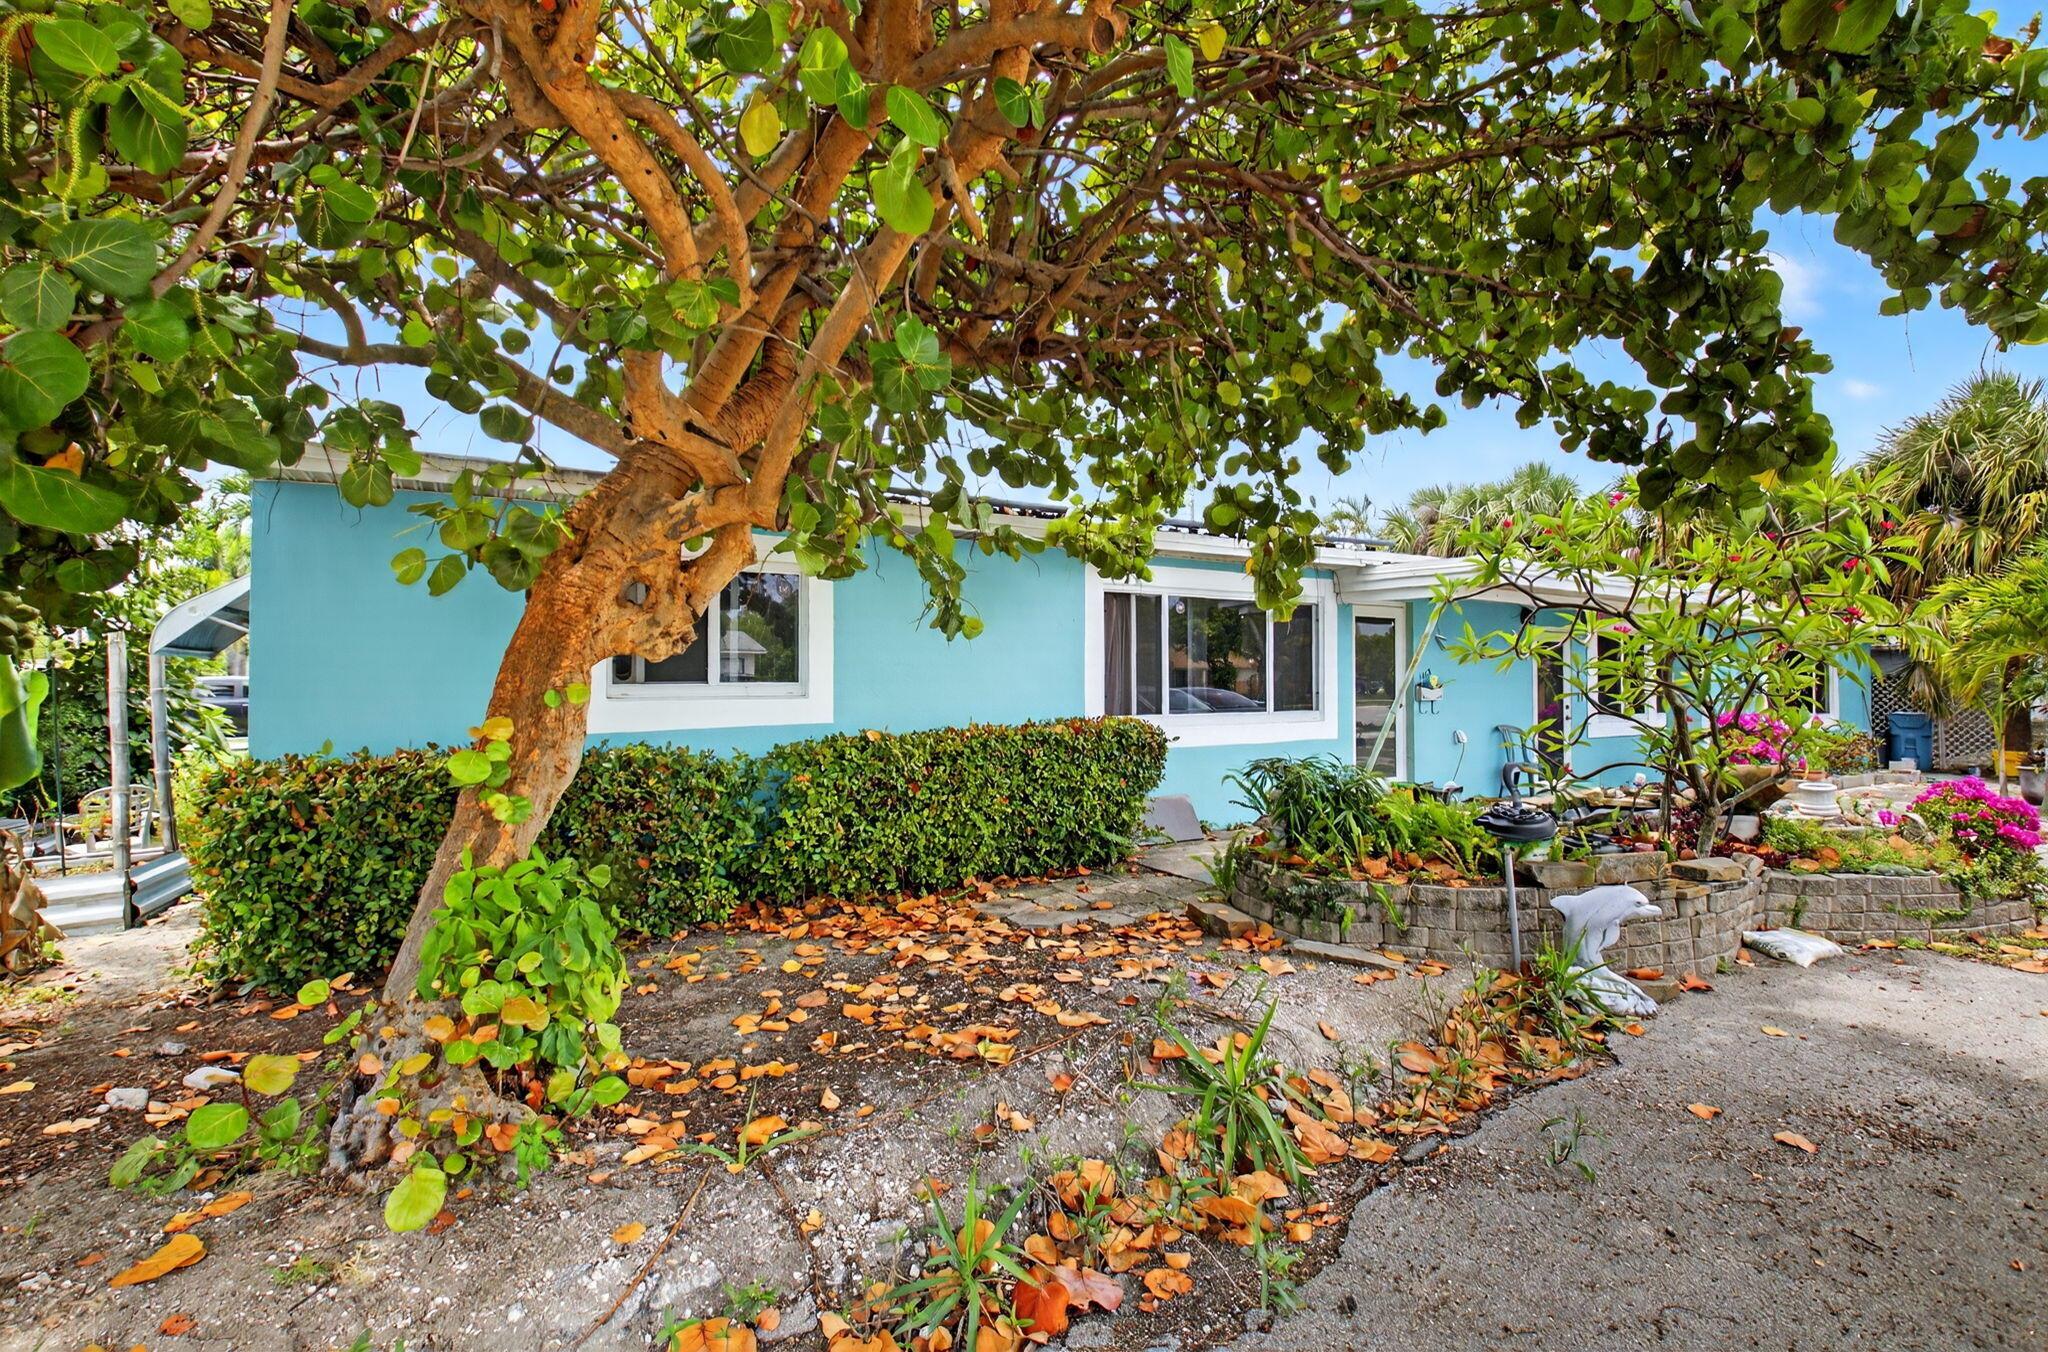
Active
$355,000
2
bds
|
2
ba
|
899
sqft
|
built
1978
689 NE 6th Ct, Boynton Beach, FL 33435
$-1,440
Cash flow
-21.2%
Cash-on-Cash Return
1.4%
Cap rate
0.8%
Rent to Value Ratio
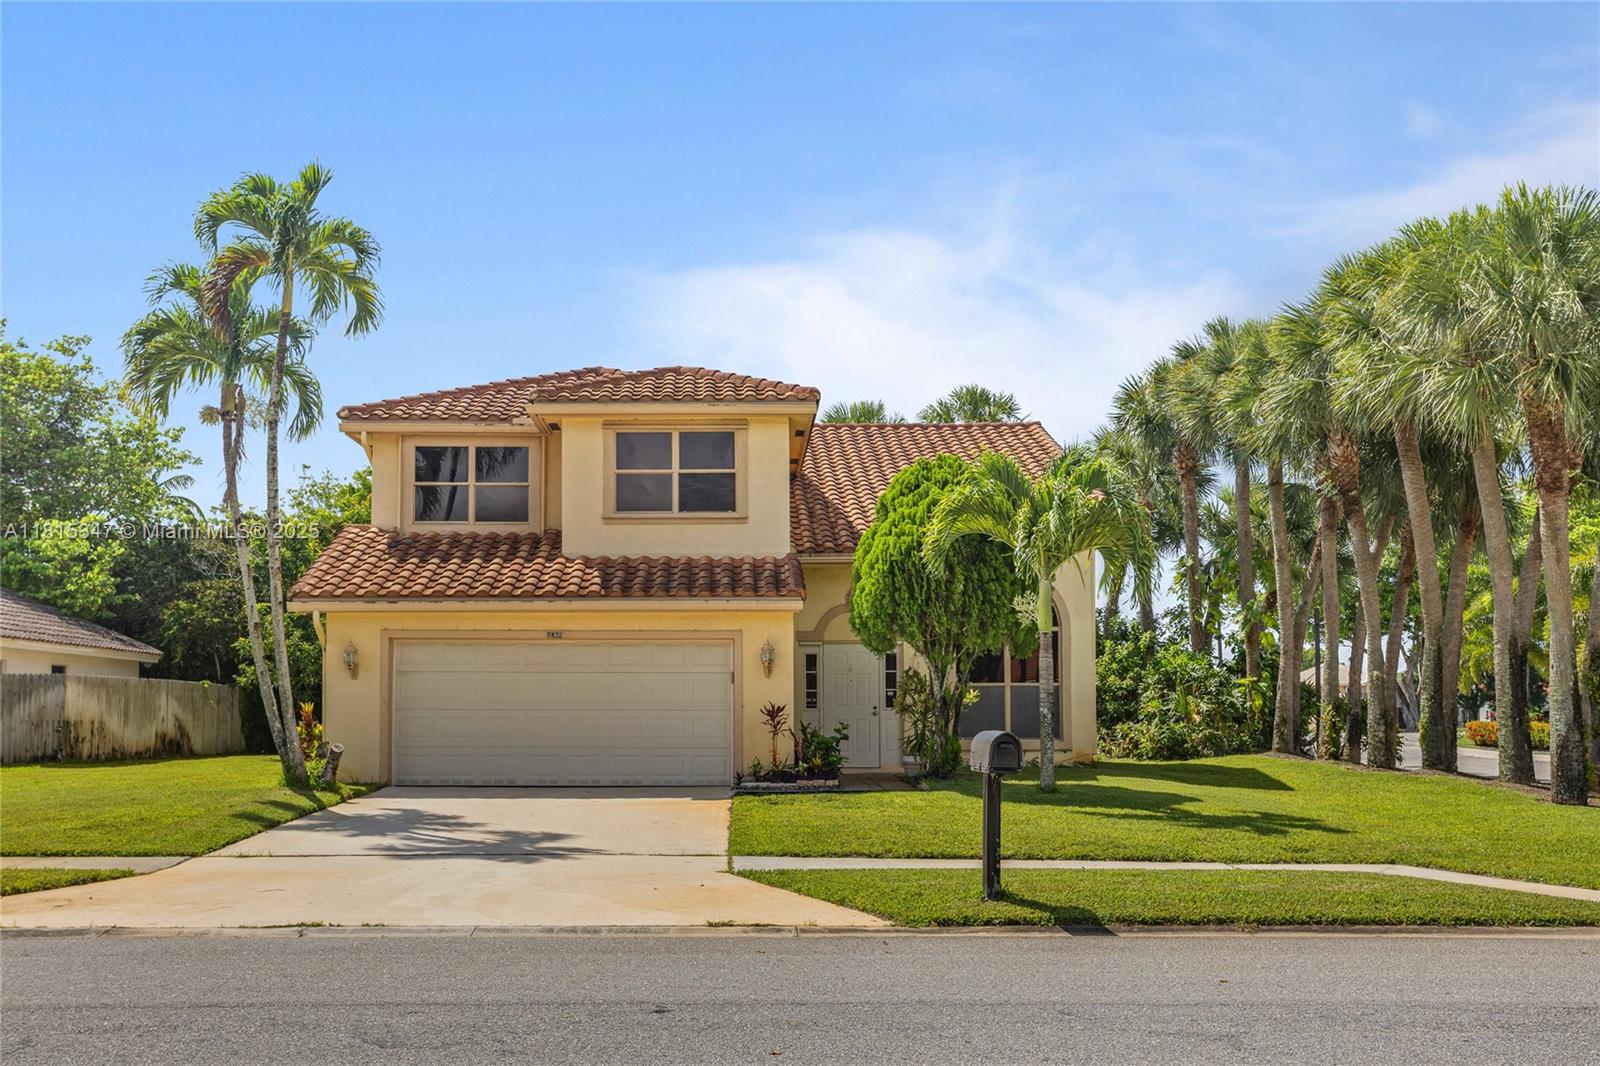
Active
$599,000
3
bds
|
2
ba
|
1,611
sqft
|
built
2001
816 SW 1st Ct, Boynton Beach, FL 33426
$-1,452
Cash flow
-12.6%
Cash-on-Cash Return
3.4%
Cap rate
0.6%
Rent to Value Ratio

Active
$214,900
2
bds
|
2
ba
|
1,008
sqft
|
built
1981
9965 Pineapple Tree Dr, Boynton Beach, FL 33436
$-395
Cash flow
-9.6%
Cash-on-Cash Return
4.1%
Cap rate
1.0%
Rent to Value Ratio
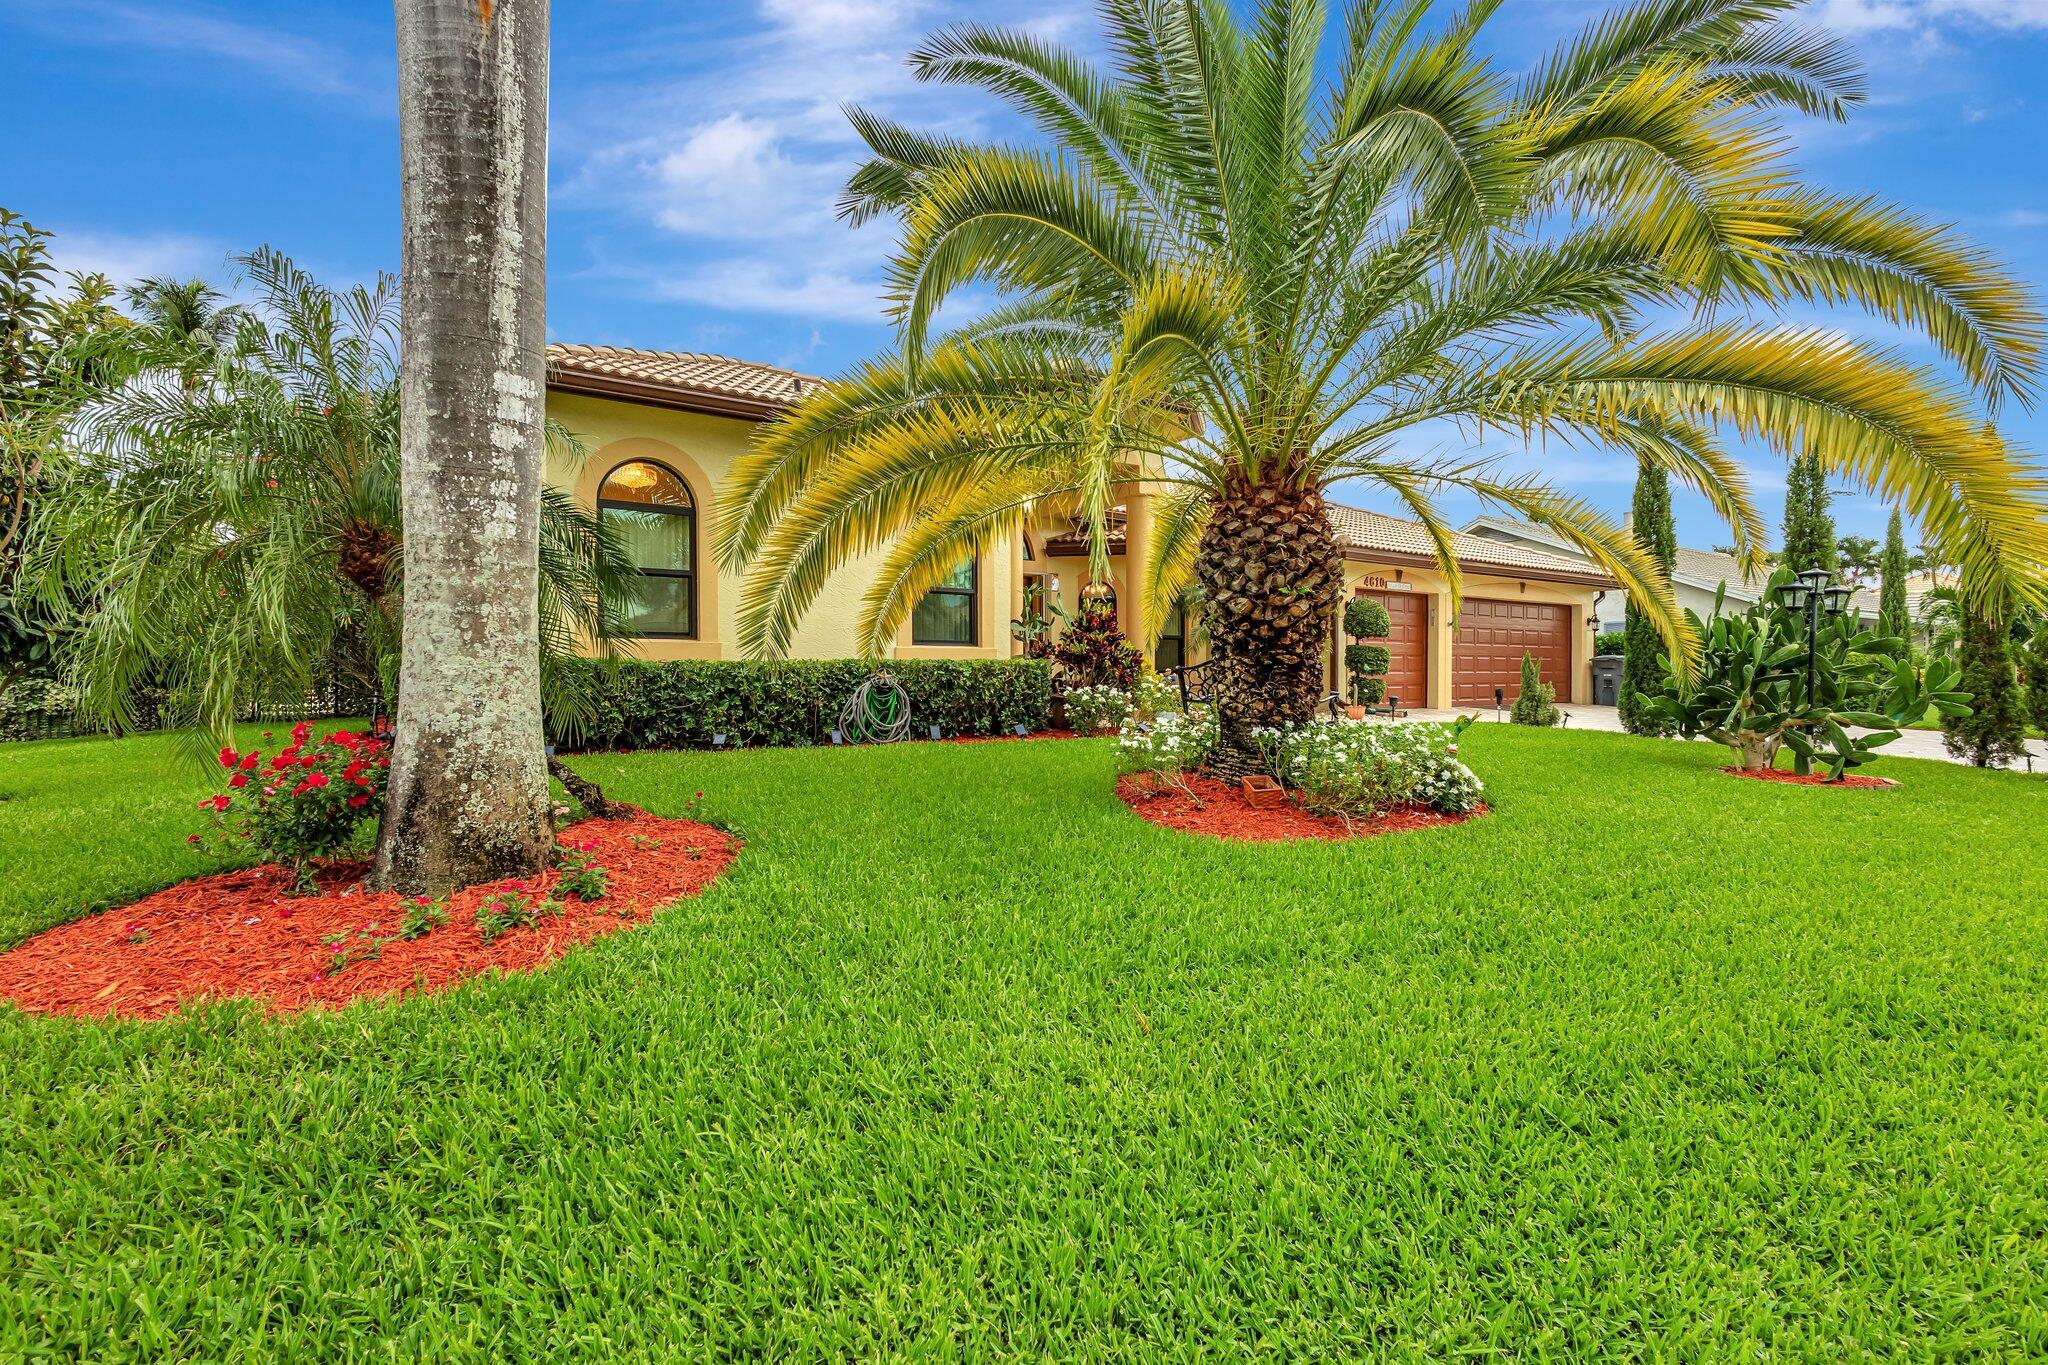
Active
$868,000
4
bds
|
3
ba
|
2,801
sqft
|
built
1999
4610 Bucida Rd, Boynton Beach, FL 33436
$-2,135
Cash flow
-12.8%
Cash-on-Cash Return
3.3%
Cap rate
0.6%
Rent to Value Ratio
Active
$2,100,000
6
bds
|
5
ba
|
5,200
sqft
|
built
2008
8680 Daystar Ridge Pt, Boynton Beach, FL 33473
$-6,773
Cash flow
-16.8%
Cash-on-Cash Return
2.4%
Cap rate
0.4%
Rent to Value Ratio
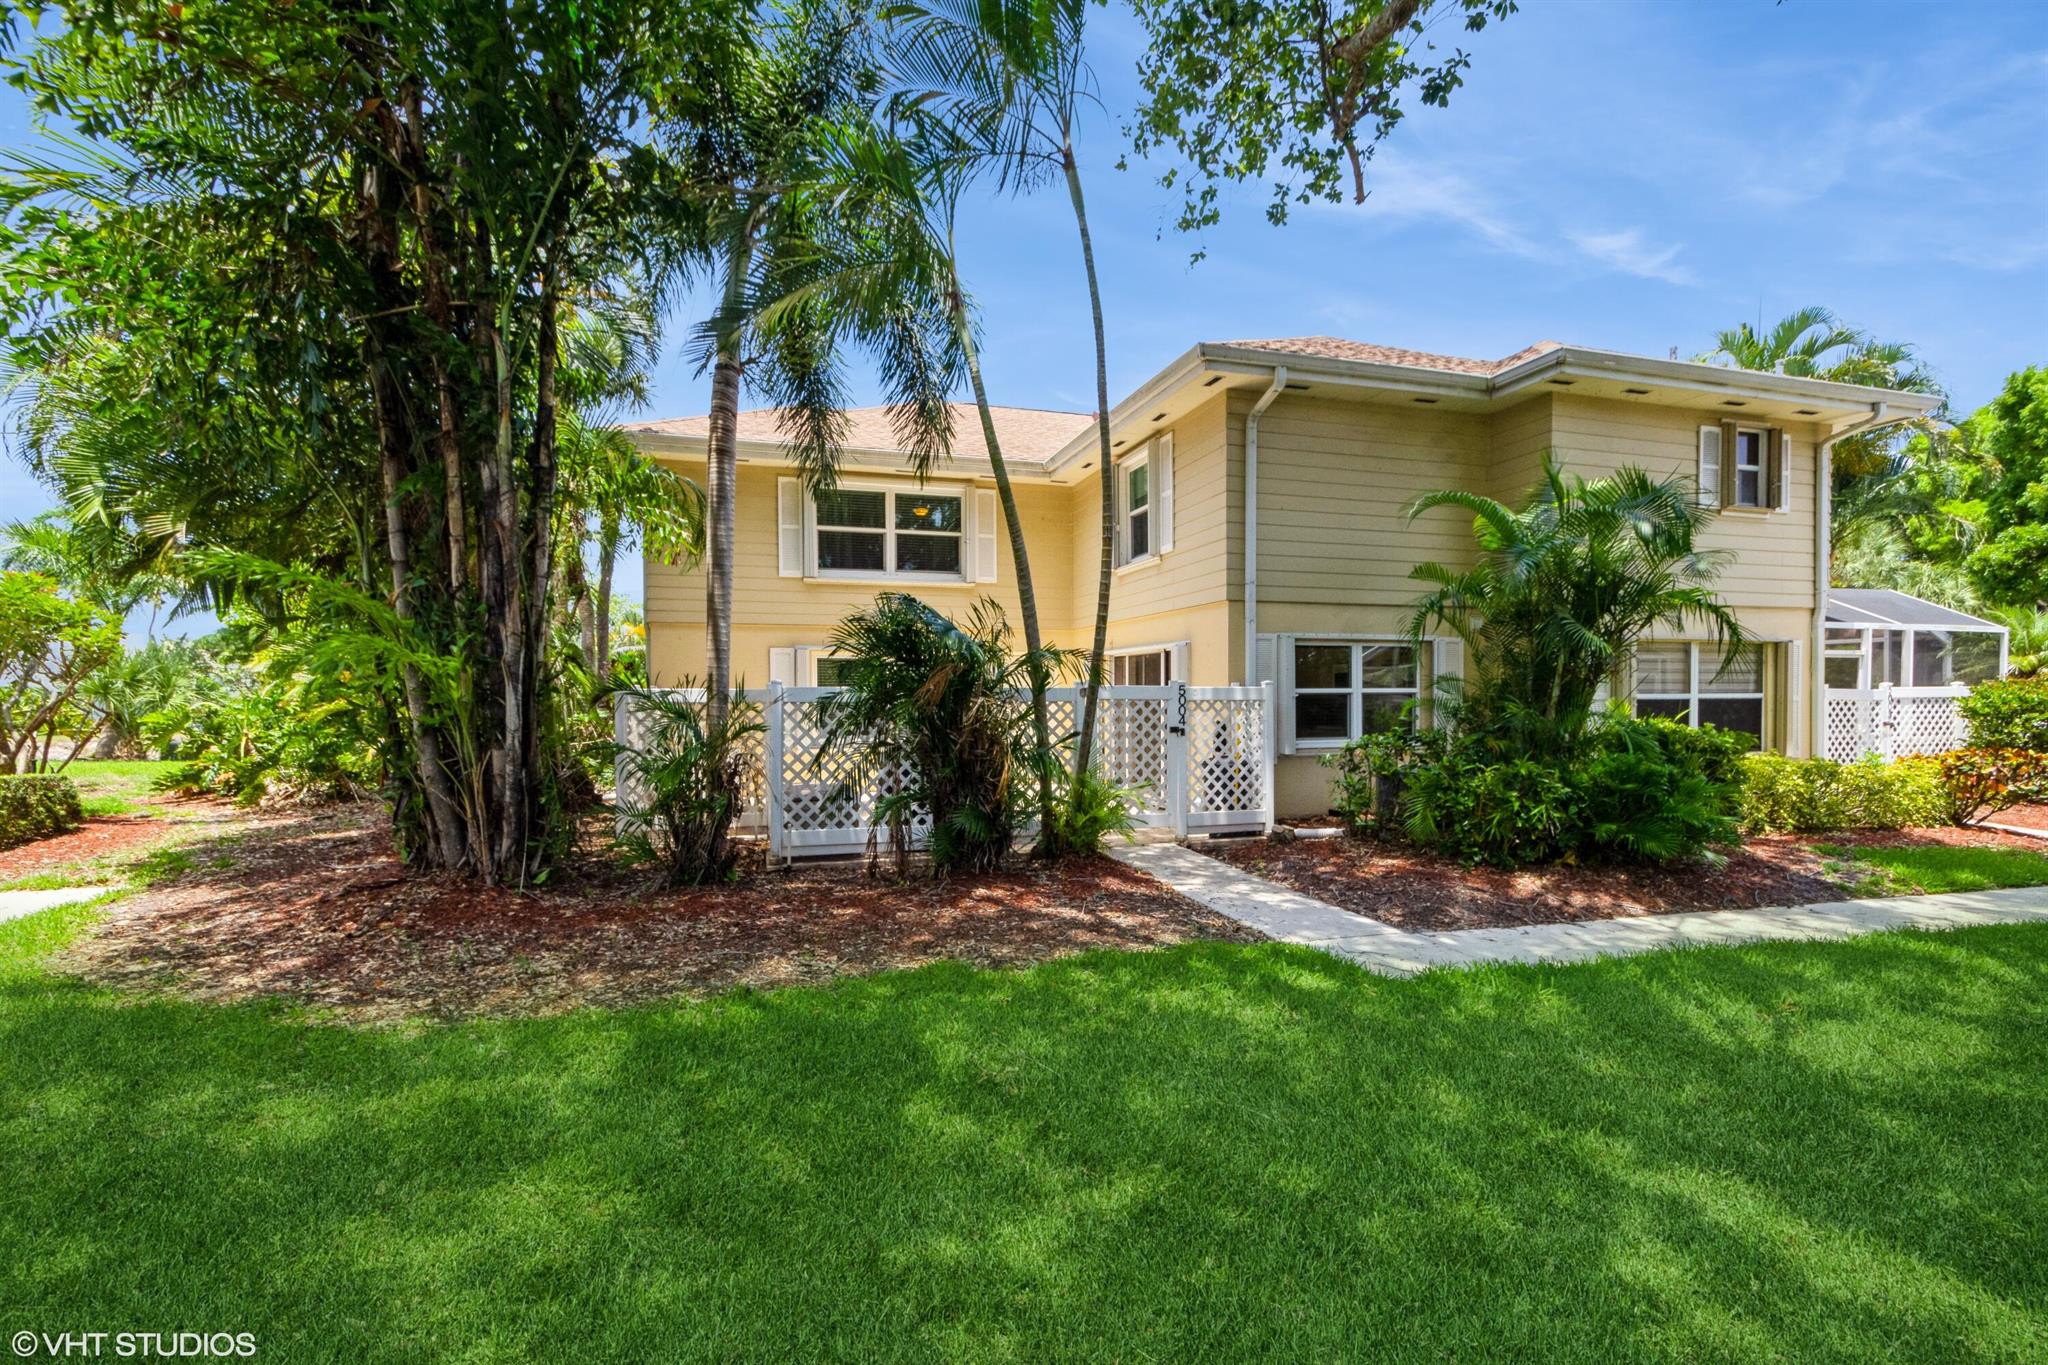
Active
$360,000
2
bds
|
3
ba
|
1,374
sqft
|
built
1988
5004 Wheatley Ct, Boynton Beach, FL 33436
$-1,151
Cash flow
-16.7%
Cash-on-Cash Return
2.4%
Cap rate
0.7%
Rent to Value Ratio
Active under contract
$374,997
3
bds
|
2
ba
|
1,361
sqft
|
built
2007
6736 Old Farm Trl, Boynton Beach, FL 33437
$-1,027
Cash flow
-14.3%
Cash-on-Cash Return
3.0%
Cap rate
0.7%
Rent to Value Ratio
Active
$550,000
3
bds
|
2
ba
|
1,988
sqft
|
built
1999
4911 Tropical Garden Dr, Boynton Beach, FL 33436
$-790
Cash flow
-7.5%
Cash-on-Cash Return
4.6%
Cap rate
0.6%
Rent to Value Ratio
Active
$329,000
3
bds
|
2
ba
|
1,846
sqft
|
built
1991
5419 Firenze Dr, Boynton Beach, FL 33437
$-894
Cash flow
-14.2%
Cash-on-Cash Return
3.0%
Cap rate
1.0%
Rent to Value Ratio
Active
$229,900
2
bds
|
2
ba
|
1,139
sqft
|
built
1990
5450 Verona Dr, Boynton Beach, FL 33437
$-830
Cash flow
-18.8%
Cash-on-Cash Return
2.0%
Cap rate
1.0%
Rent to Value Ratio
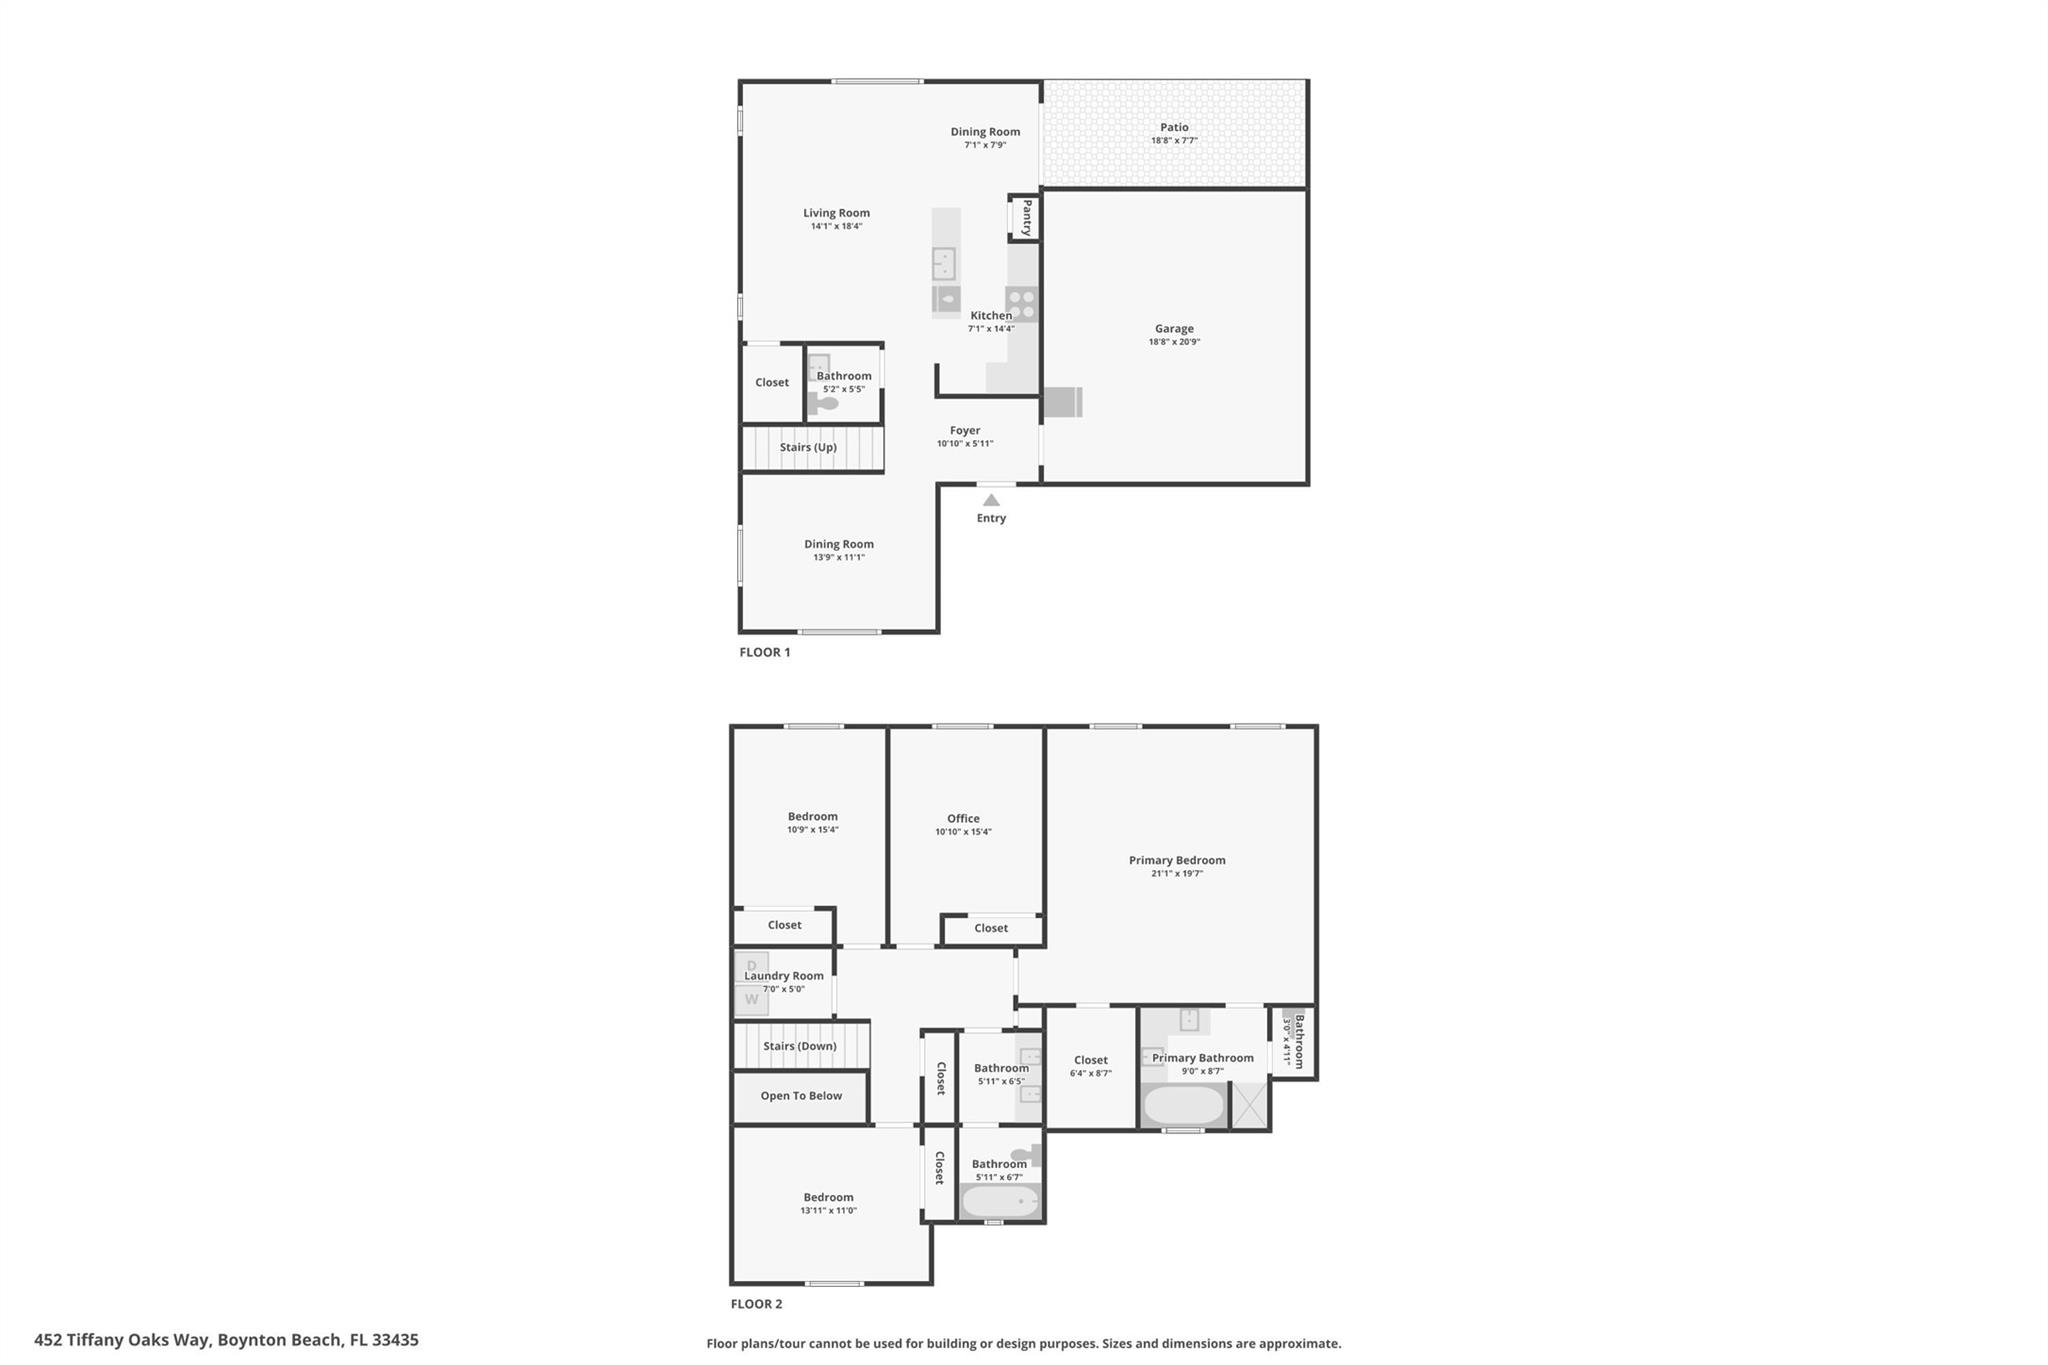
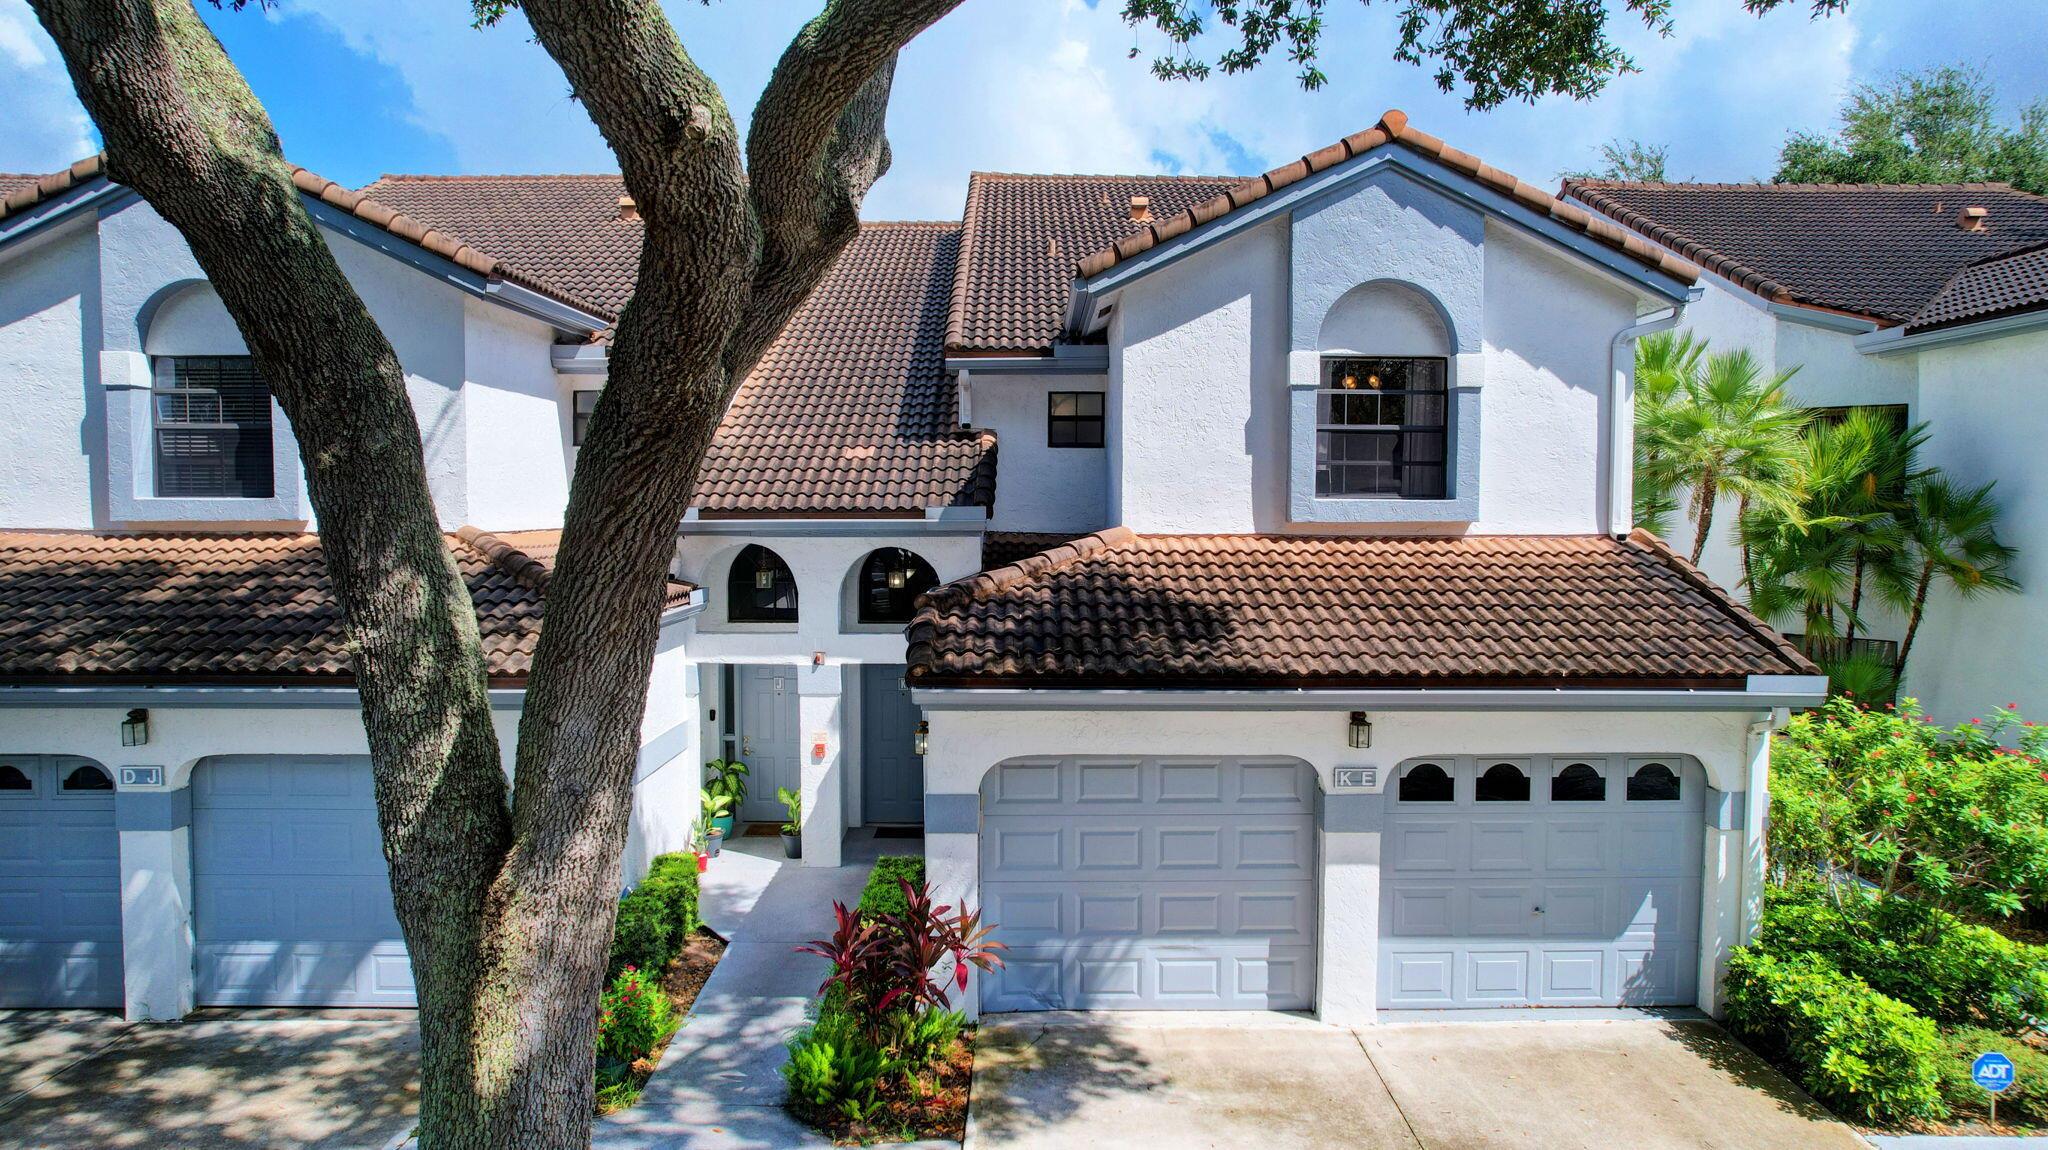
Active
$789,000
4
bds
|
3
ba
|
2,235
sqft
|
built
2013
452 Tiffany Oaks Way, Boynton Beach, FL 33435
$-2,200
Cash flow
-14.5%
Cash-on-Cash Return
2.9%
Cap rate
0.5%
Rent to Value Ratio
Active
$1,900,000
3
bds
|
2
ba
|
2,031
sqft
|
built
1957
952 Brookdale Dr, Boynton Beach, FL 33435
$-7,865
Cash flow
-21.6%
Cash-on-Cash Return
1.3%
Cap rate
0.3%
Rent to Value Ratio
Active
$549,900
3
bds
|
2
ba
|
1,432
sqft
|
built
1989
8586 Brian Blvd, Boynton Beach, FL 33472
$-1,038
Cash flow
-9.8%
Cash-on-Cash Return
4.0%
Cap rate
0.6%
Rent to Value Ratio
Active
$1,274,000
4
bds
|
4
ba
|
3,024
sqft
|
built
1989
9085 Talway Cir, Boynton Beach, FL 33472
$-4,105
Cash flow
-16.8%
Cash-on-Cash Return
2.4%
Cap rate
0.4%
Rent to Value Ratio
Active
$1,799,000
6
bds
|
8
ba
|
5,597
sqft
|
built
2007
8979 Three Rail Dr, Boynton Beach, FL 33472
$-6,195
Cash flow
-18.0%
Cash-on-Cash Return
2.2%
Cap rate
0.4%
Rent to Value Ratio
Active
$599,900
3
bds
|
2
ba
|
2,302
sqft
|
built
1988
9496 Majestic Way, Boynton Beach, FL 33437
$-1,200
Cash flow
-10.4%
Cash-on-Cash Return
3.9%
Cap rate
0.7%
Rent to Value Ratio
Active
$629,900
3
bds
|
3
ba
|
2,569
sqft
|
built
1994
6078 Slice Ct, Boynton Beach, FL 33437
$-1,387
Cash flow
-11.5%
Cash-on-Cash Return
3.6%
Cap rate
0.7%
Rent to Value Ratio
Active
$119,000
1
bds
|
2
ba
|
624
sqft
|
built
1970
2191 NE 1st Ct, Boynton Beach, FL 33435
$-229
Cash flow
-10.0%
Cash-on-Cash Return
4.0%
Cap rate
1.3%
Rent to Value Ratio
Active
$379,000
2
bds
|
3
ba
|
1,374
sqft
|
built
1988
3004 Hayden Ct, Boynton Beach, FL 33436
$-822
Cash flow
-11.3%
Cash-on-Cash Return
3.7%
Cap rate
0.8%
Rent to Value Ratio
Active under contract
$625,000
4
bds
|
3
ba
|
2,390
sqft
|
built
1993
6321 Lansdowne Cir, Boynton Beach, FL 33472
$-941
Cash flow
-7.9%
Cash-on-Cash Return
4.5%
Cap rate
0.6%
Rent to Value Ratio
Active
$220,000
2
bds
|
2
ba
|
953
sqft
|
built
1985
27 Crossings Cir, Boynton Beach, FL 33435
$-491
Cash flow
-11.6%
Cash-on-Cash Return
3.6%
Cap rate
0.8%
Rent to Value Ratio
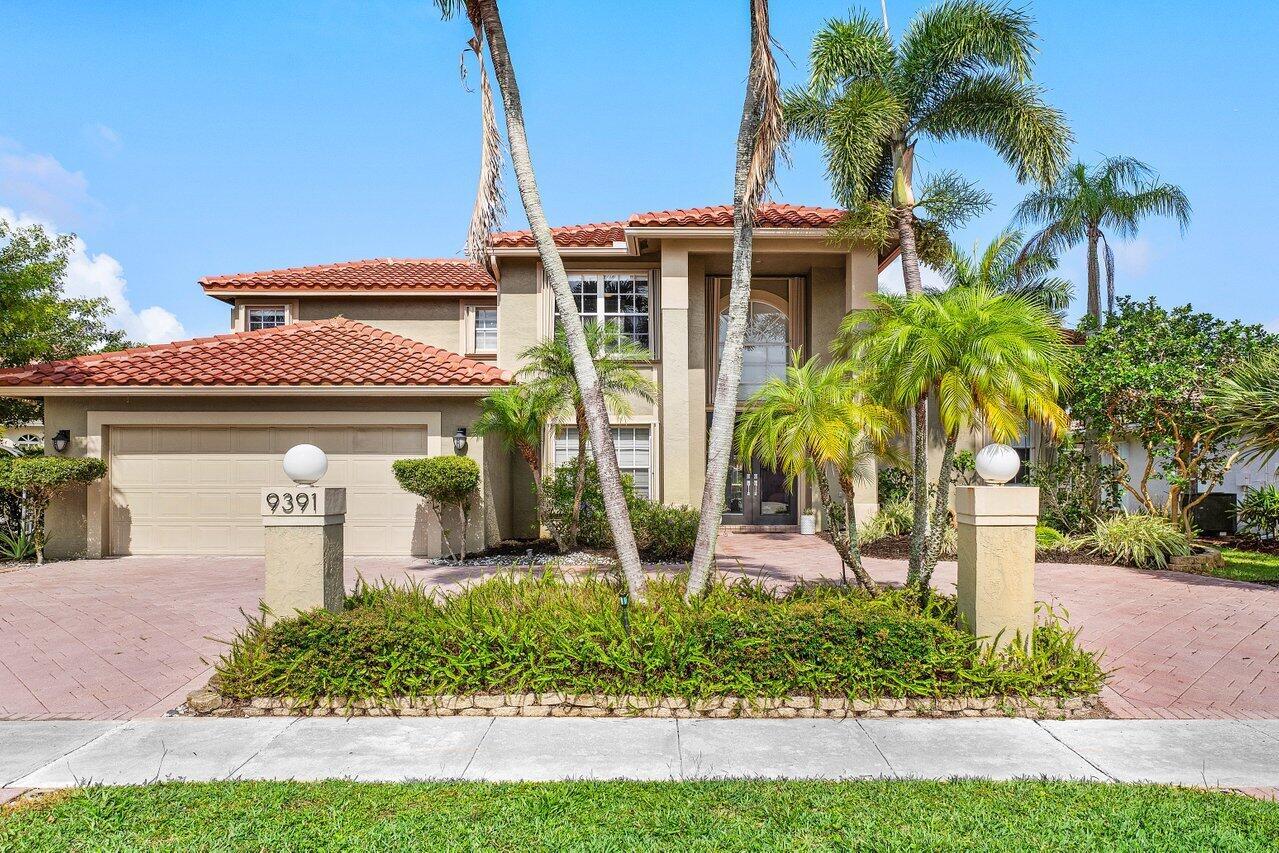
Active
$795,000
4
bds
|
3
ba
|
2,491
sqft
|
built
1992
9391 Aqua Vista Blvd, Boynton Beach, FL 33437
$-2,076
Cash flow
-13.6%
Cash-on-Cash Return
3.2%
Cap rate
0.6%
Rent to Value Ratio
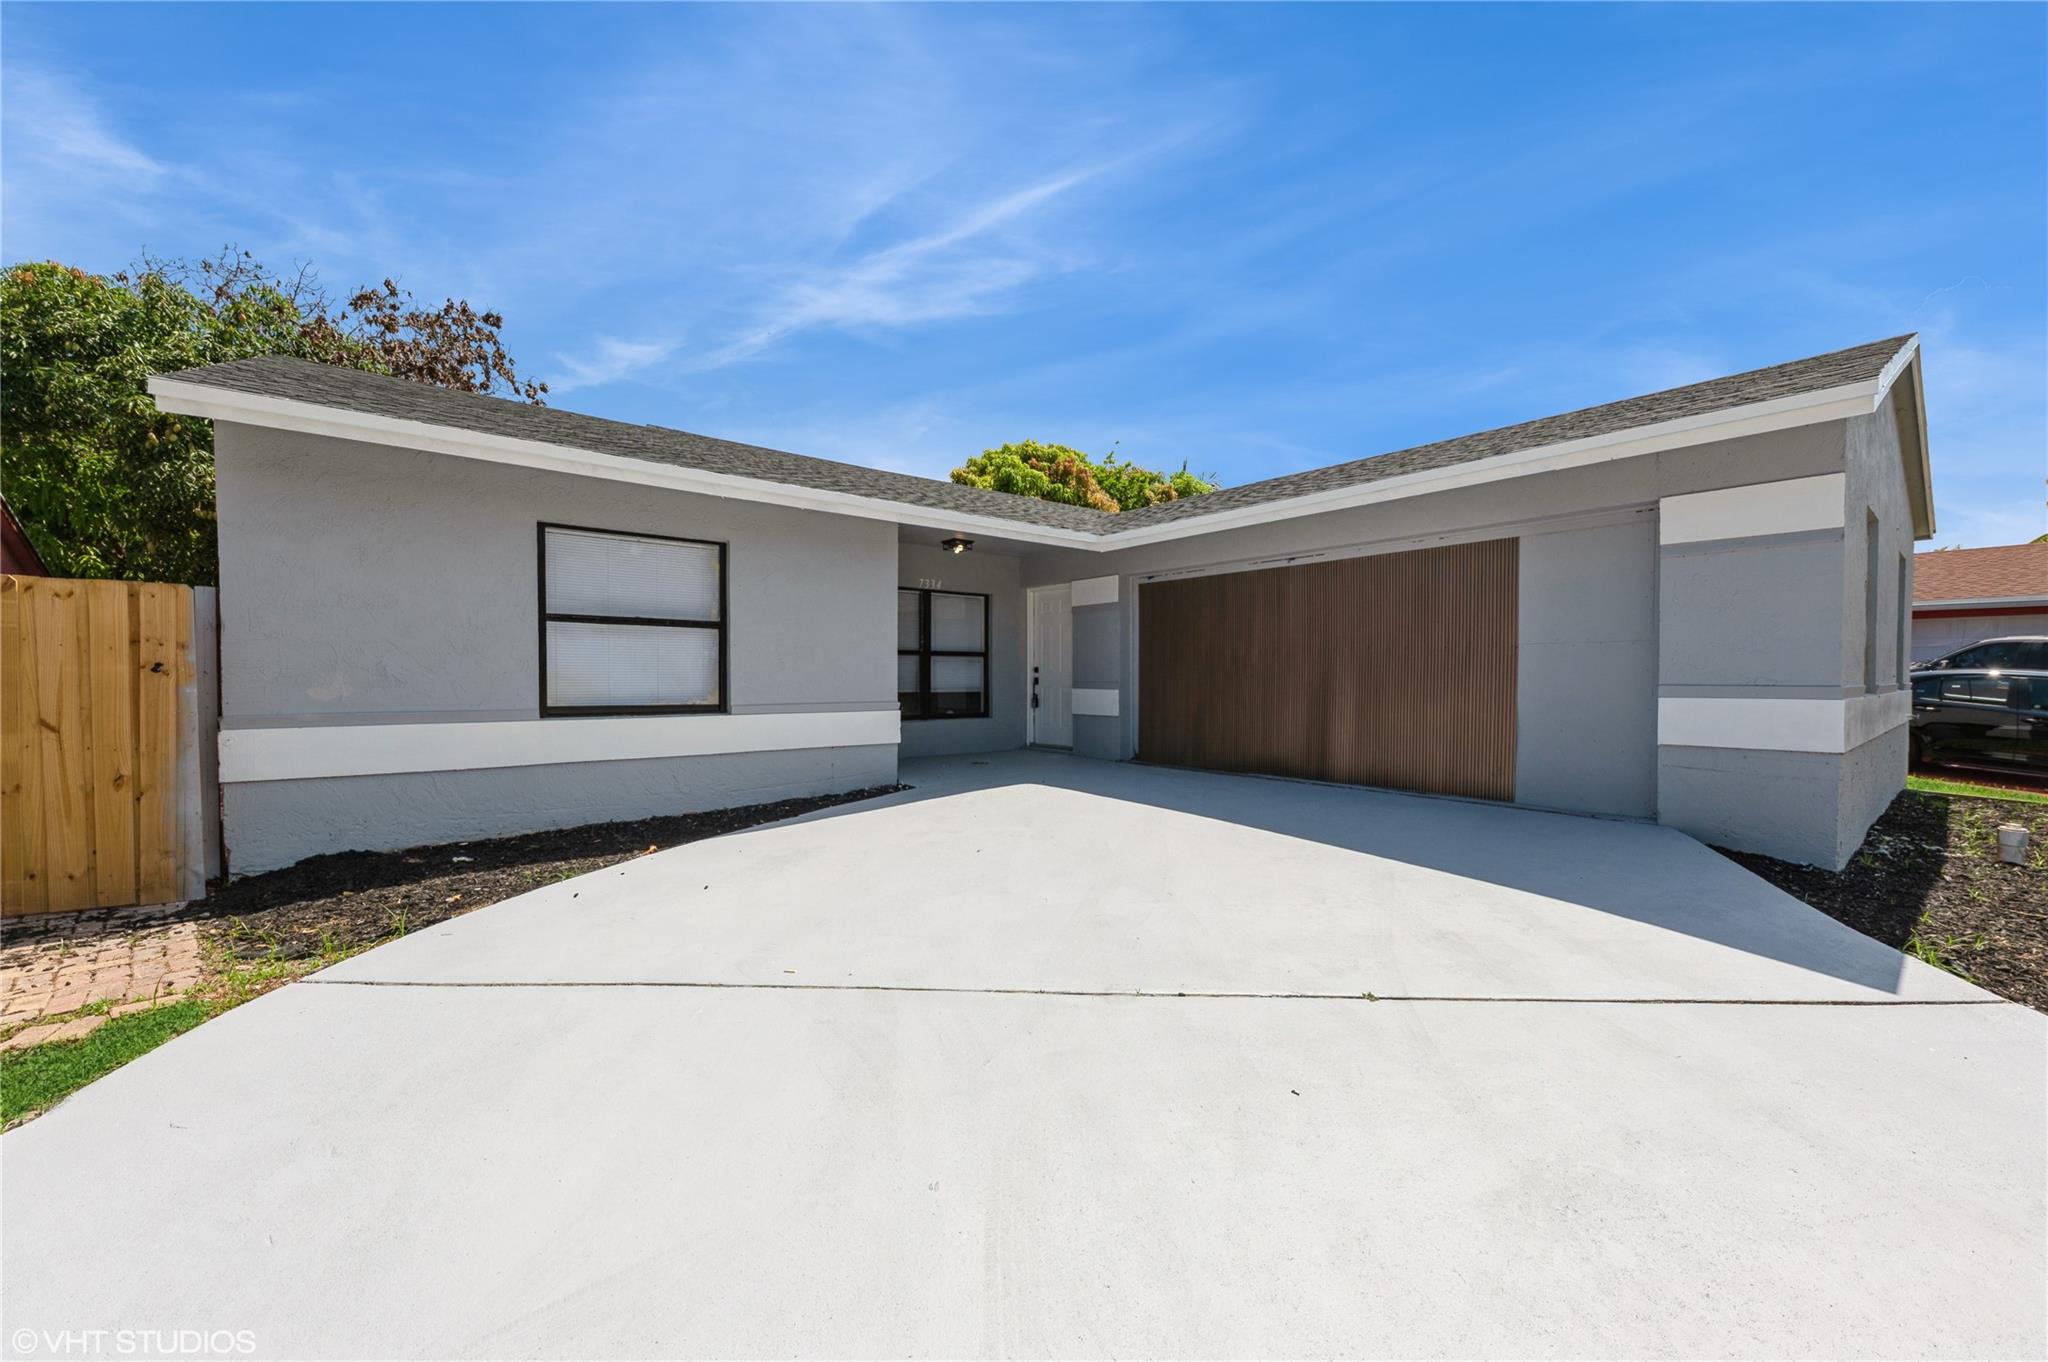
Active
$465,000
4
bds
|
3
ba
|
1,886
sqft
|
built
1993
7334 Willow Springs Cir S, Boynton Beach, FL 33436
$-784
Cash flow
-8.8%
Cash-on-Cash Return
4.3%
Cap rate
0.7%
Rent to Value Ratio
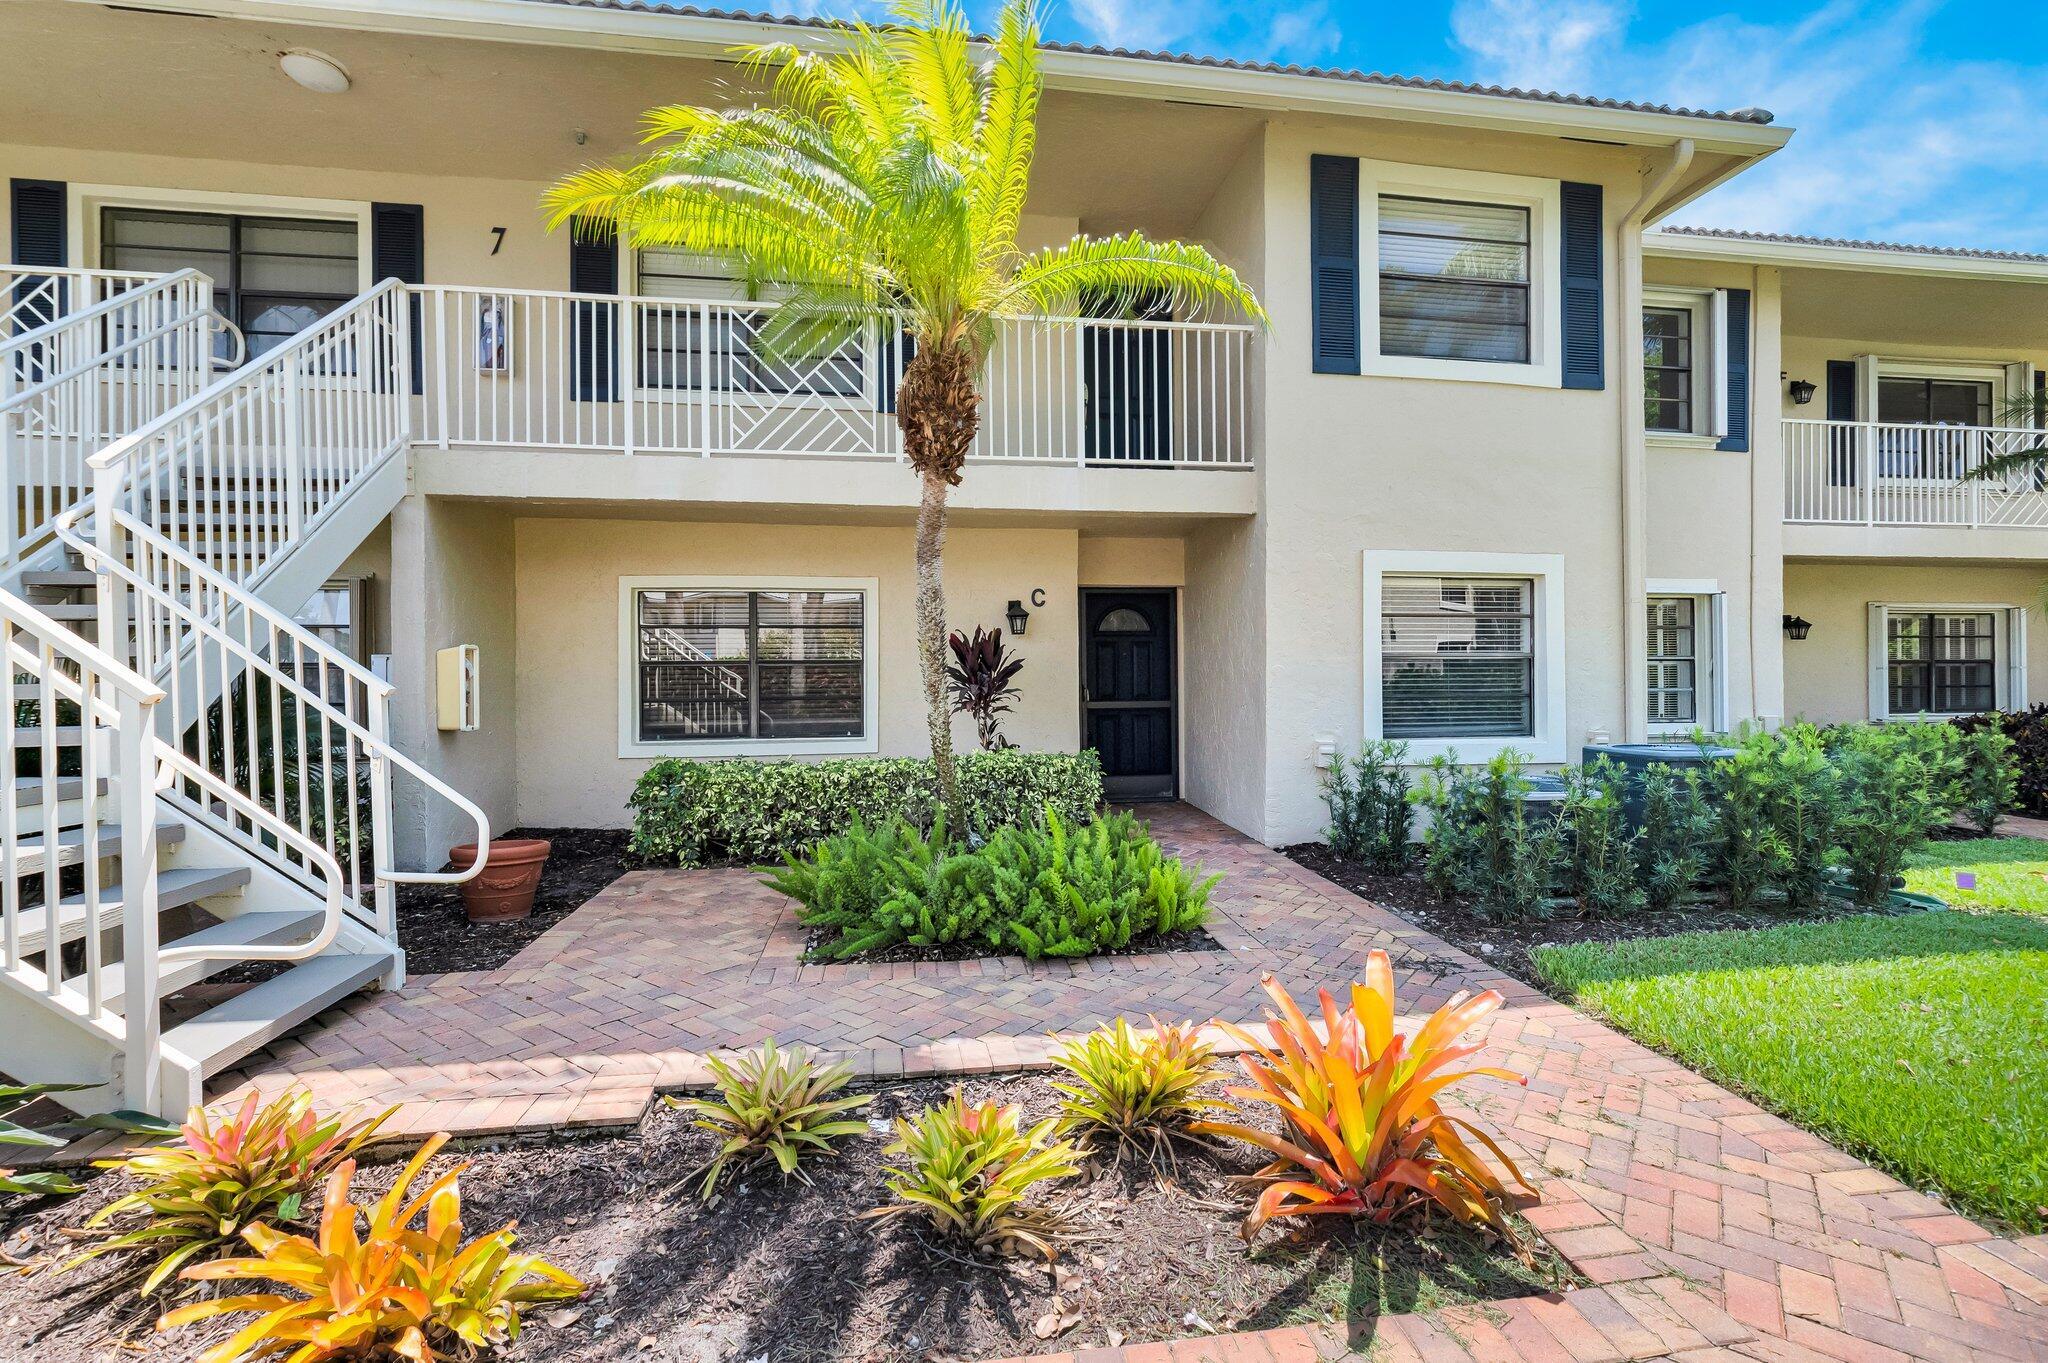
Active
$1,000
2
bds
|
2
ba
|
1,388
sqft
|
built
1980
7 Stratford Dr E, Boynton Beach, FL 33436
$-235
Cash flow
-273.8%
Cash-on-Cash Return
-282.0%
Cap rate
200.0%
Rent to Value Ratio
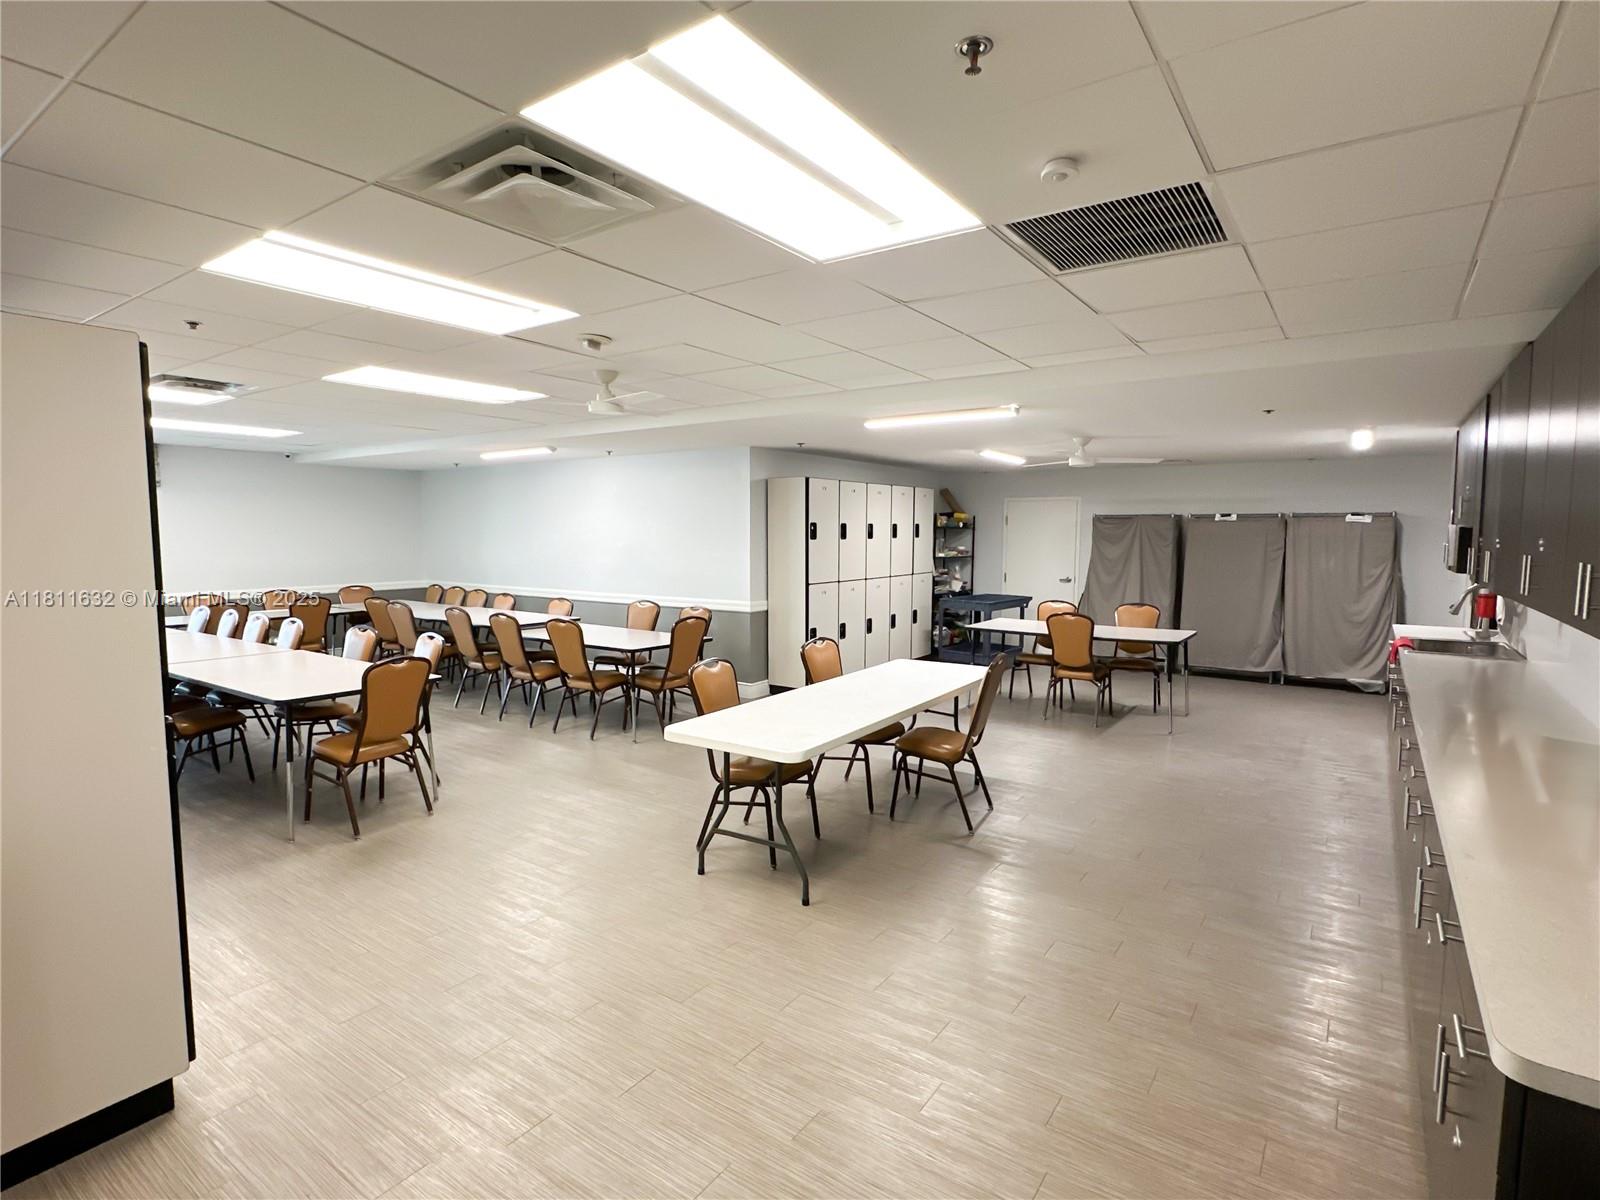
Active
$269,900
3
bds
|
2
ba
|
1,495
sqft
|
built
1995
5154 Floria Dr, Boynton Beach, FL 33437
$-532
Cash flow
-10.3%
Cash-on-Cash Return
3.9%
Cap rate
1.0%
Rent to Value Ratio
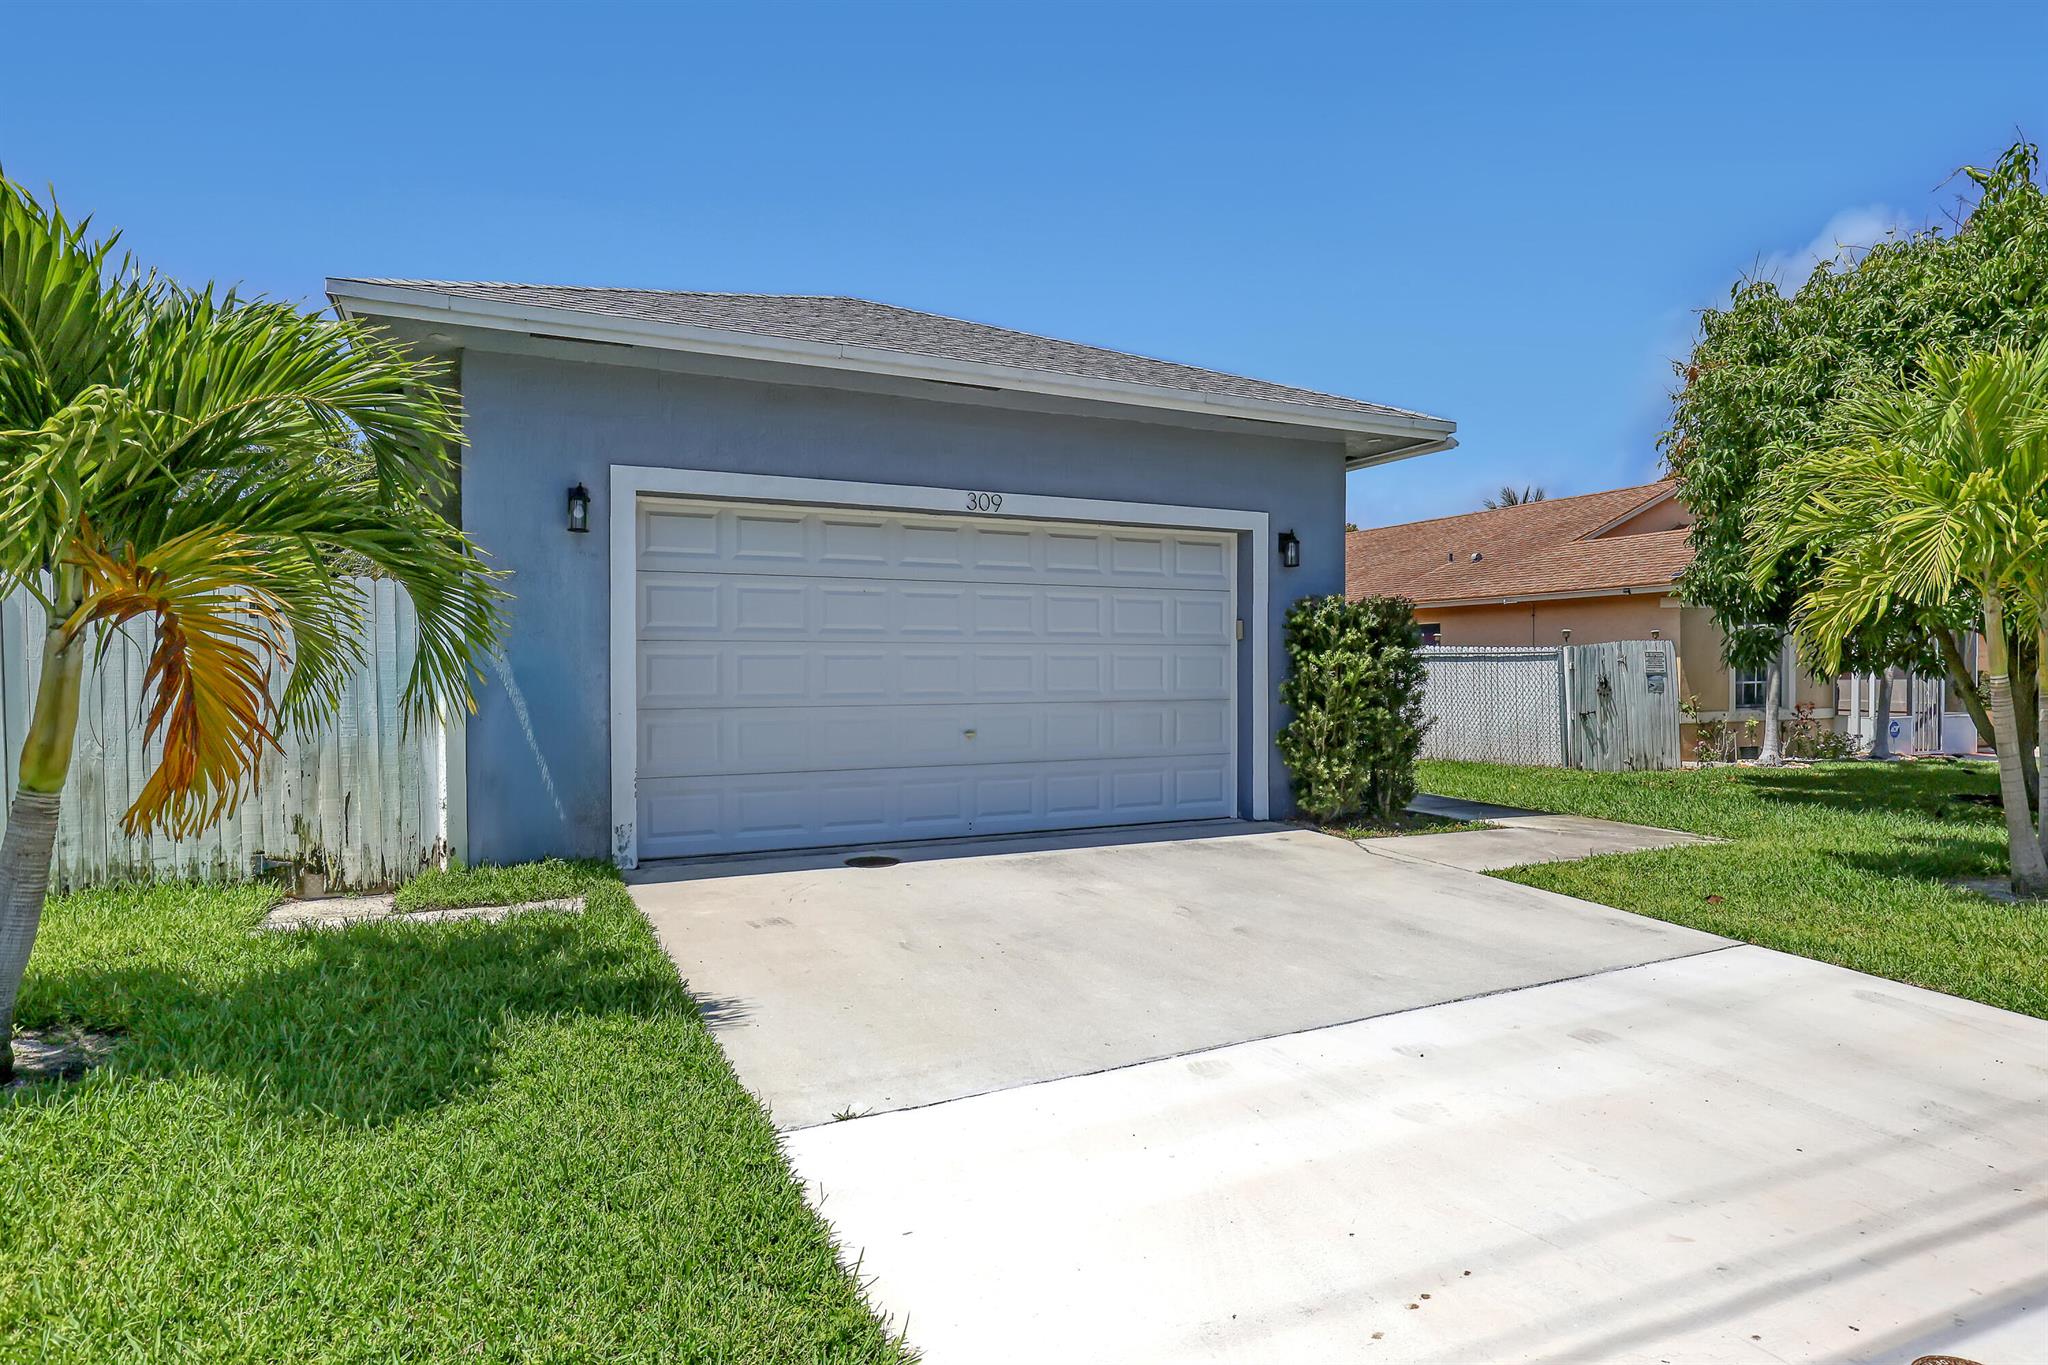
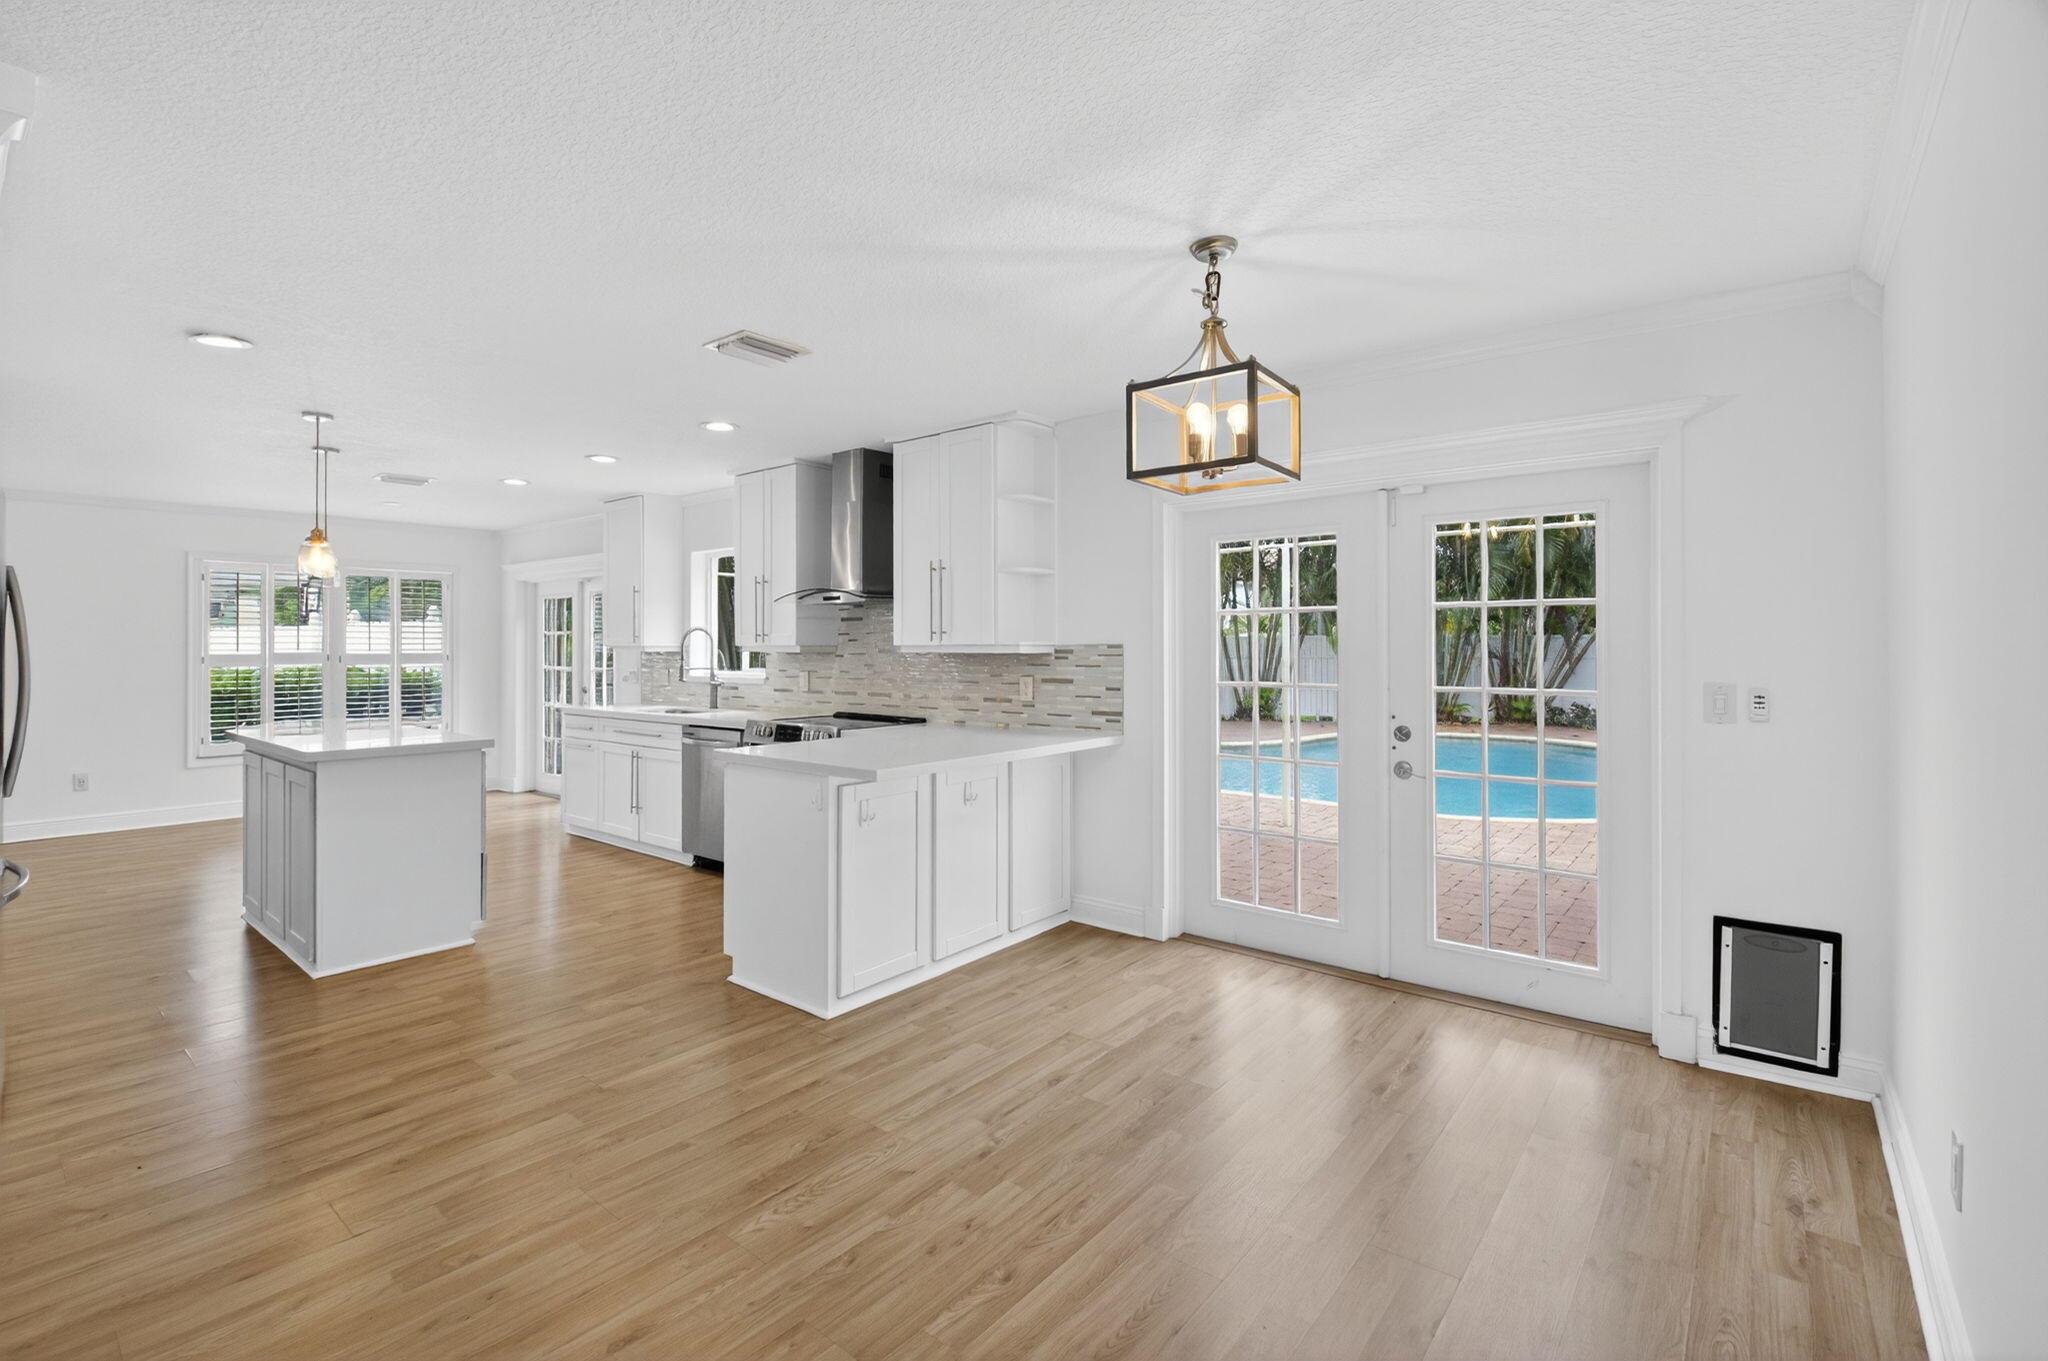
Active
$525,000
3
bds
|
2
ba
|
2,019
sqft
|
built
2019
309 NE 11th Ave, Boynton Beach, FL 33435
$-1,028
Cash flow
-10.2%
Cash-on-Cash Return
3.9%
Cap rate
0.6%
Rent to Value Ratio
Active
$699,000
3
bds
|
3
ba
|
2,028
sqft
|
built
1992
6903 Beacon Hollow Turn, Boynton Beach, FL 33437
$-1,199
Cash flow
-8.9%
Cash-on-Cash Return
4.2%
Cap rate
0.7%
Rent to Value Ratio
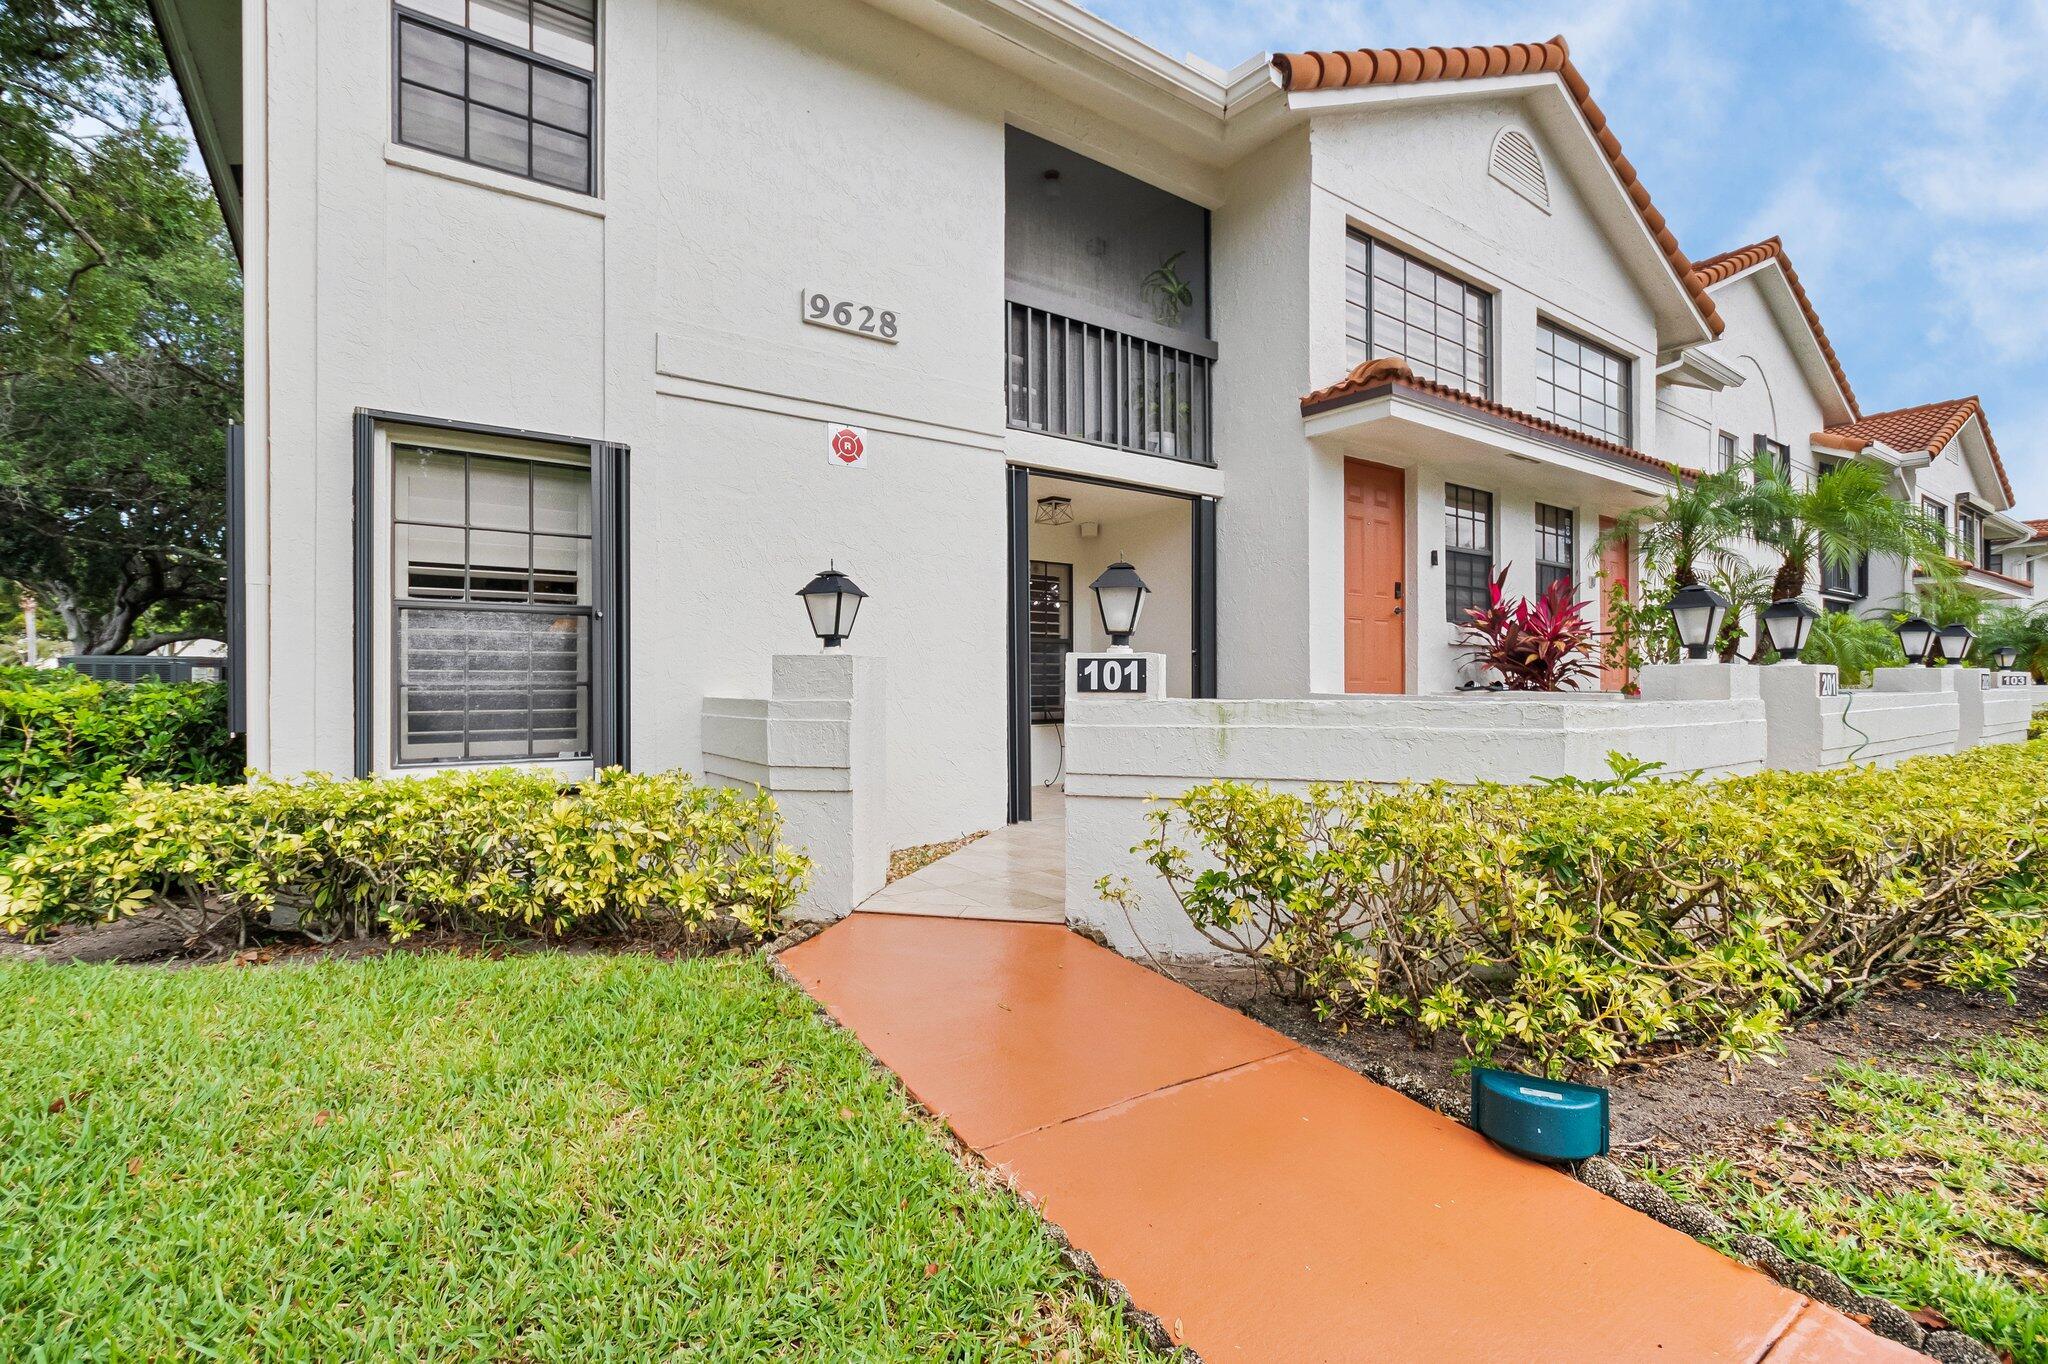
Active
$319,900
2
bds
|
2
ba
|
1,498
sqft
|
built
1990
9628 Pavarotti Ter, Boynton Beach, FL 33437
$-393
Cash flow
-6.4%
Cash-on-Cash Return
4.8%
Cap rate
1.0%
Rent to Value Ratio