Brandon, FL Investment Properties for Sale
Browse homes for sale and investment properties in Brandon, FL. Refine your search by price, property type, or more.
Best cash flowing properties in Brandon, FL
Active
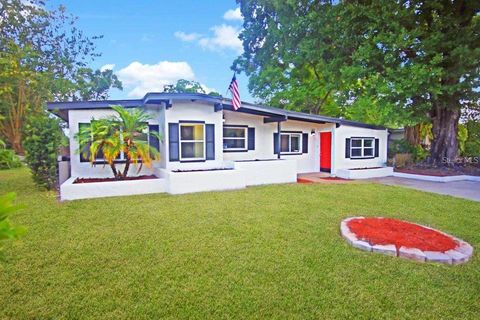
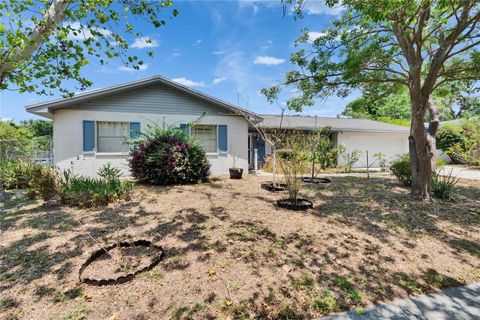
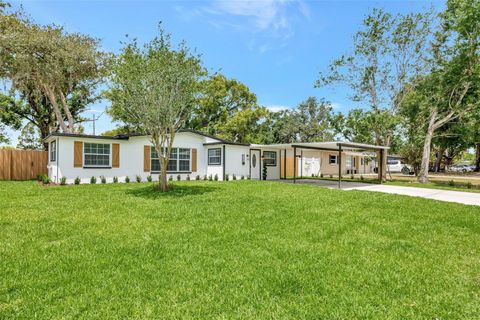
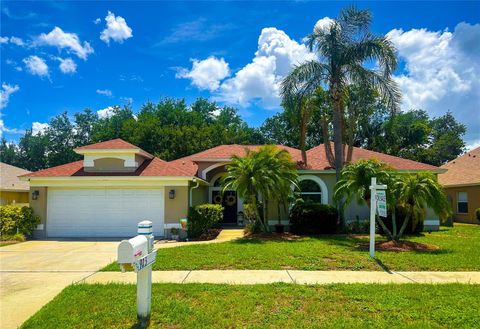
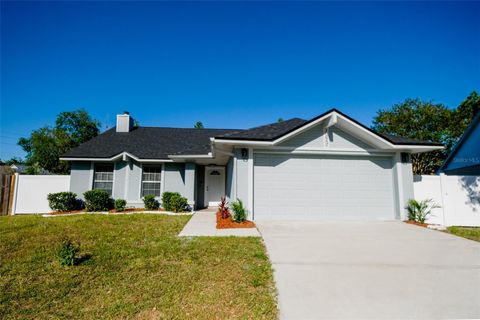
$299,900
3
bds
|
2
ba
|
1,644
sqft
|
built
1959
1111 Briarwood Rd, Brandon, FL 33511
$-110
Cash flow
-1.9%
Cash-on-Cash Return
5.7%
Cap rate
0.8%
Rent to Value Ratio

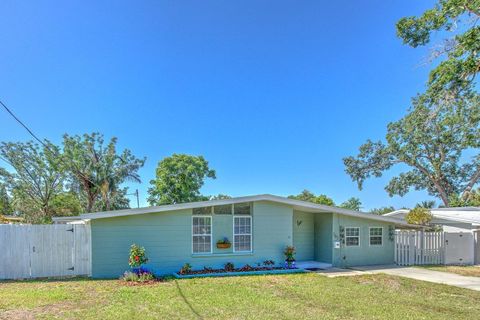
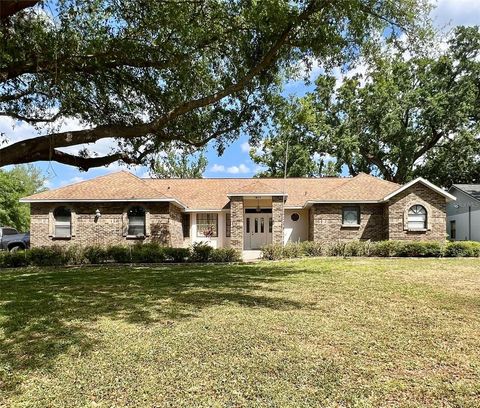
Active
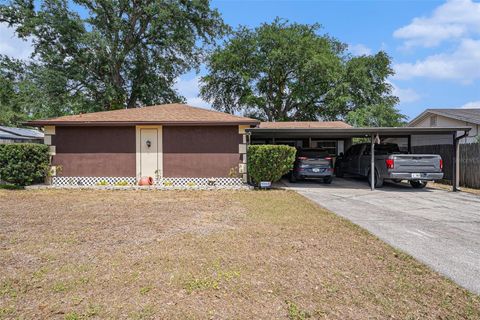
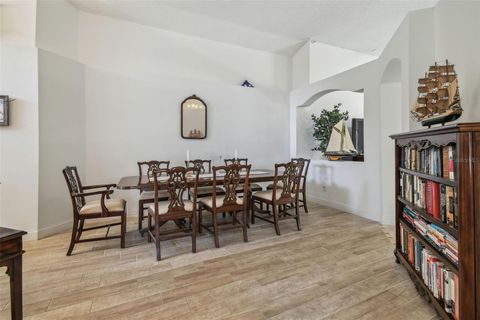
$230,000
3
bds
|
2
ba
|
1,256
sqft
|
built
1975
3203 Doe Ct, Brandon, FL 33511
$-283
Cash flow
-6.4%
Cash-on-Cash Return
4.7%
Cap rate
0.8%
Rent to Value Ratio
202 out of 213 properties for sale in Brandon, FL
Limited Results Shown
Create a free account, or log in to reveal all property listings and enjoy the complete experience.
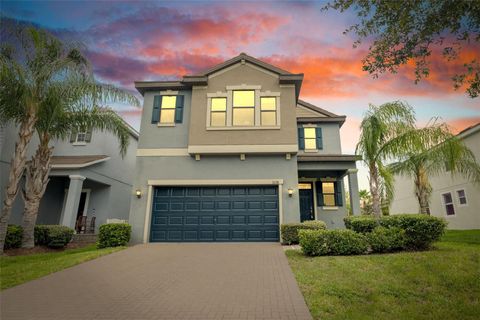
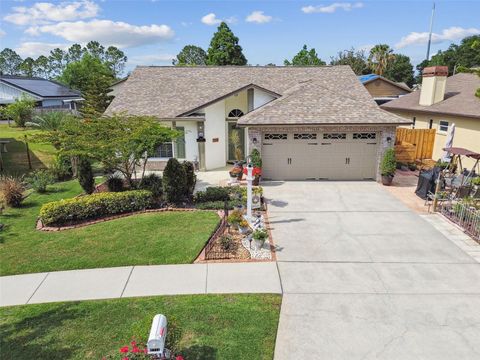
Active
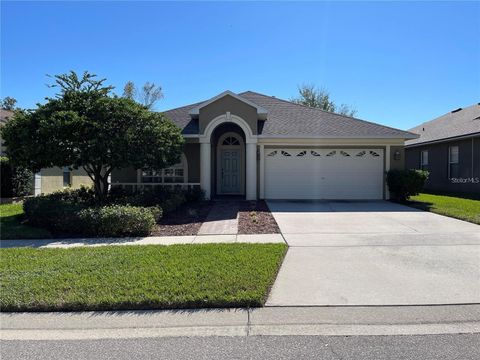
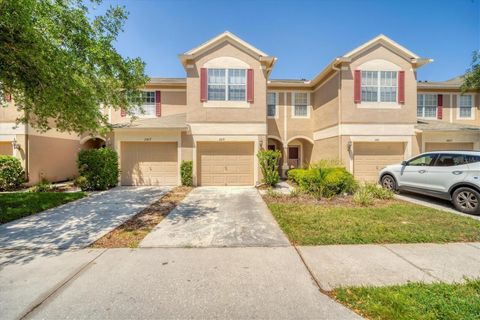
$445,000
4
bds
|
3
ba
|
2,375
sqft
|
built
2016
1028 Oliveto Verdi Ct, Brandon, FL 33511
$-1,188
Cash flow
-13.9%
Cash-on-Cash Return
2.9%
Cap rate
0.6%
Rent to Value Ratio

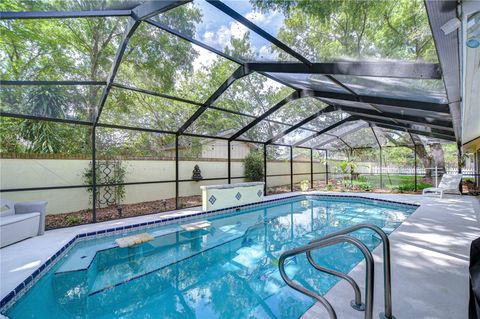
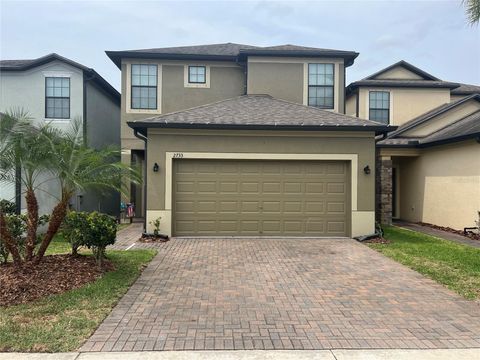
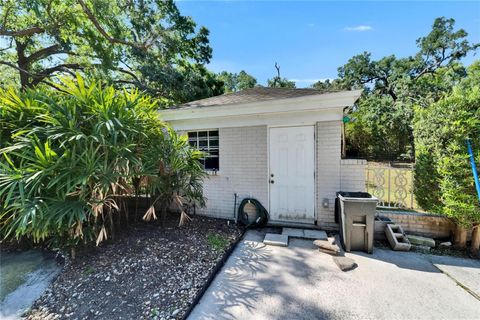
Active
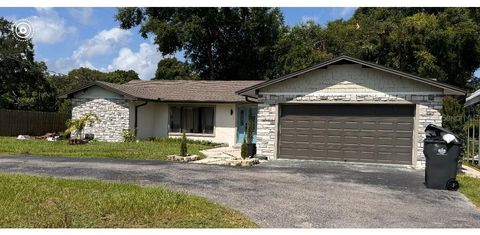
$475,000
3
bds
|
2
ba
|
2,233
sqft
|
built
1991
2020 Elk Spring Dr, Brandon, FL 33511
$-1,220
Cash flow
-13.4%
Cash-on-Cash Return
3.1%
Cap rate
0.5%
Rent to Value Ratio

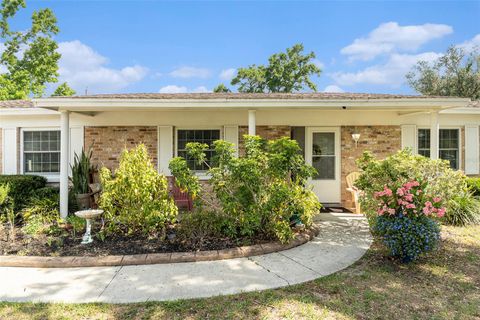
Active
$385,000
4
bds
|
2
ba
|
1,511
sqft
|
built
1988
2816 Manor Hill Dr, Brandon, FL 33511
$-557
Cash flow
-7.5%
Cash-on-Cash Return
4.4%
Cap rate
0.6%
Rent to Value Ratio
Active
$230,000
3
bds
|
2
ba
|
1,256
sqft
|
built
1975
3203 Doe Ct, Brandon, FL 33511
$-283
Cash flow
-6.4%
Cash-on-Cash Return
4.7%
Cap rate
0.8%
Rent to Value Ratio

Active
$342,000
3
bds
|
2
ba
|
1,409
sqft
|
built
1993
1654 Portsmouth Lake Dr, Brandon, FL 33511
$-787
Cash flow
-12.0%
Cash-on-Cash Return
3.4%
Cap rate
0.6%
Rent to Value Ratio

Active
$399,000
4
bds
|
2
ba
|
2,112
sqft
|
built
2002
1932 Sean Wood Cir, Brandon, FL 33510
$-366
Cash flow
-4.8%
Cash-on-Cash Return
5.0%
Cap rate
0.7%
Rent to Value Ratio
Active
$729,000
4
bds
|
3
ba
|
2,837
sqft
|
built
1984
124 Barrington Dr, Brandon, FL 33511
$-2,020
Cash flow
-14.5%
Cash-on-Cash Return
2.8%
Cap rate
0.4%
Rent to Value Ratio
Active
$444,900
3
bds
|
3
ba
|
1,846
sqft
|
built
1965
626 Marphil Loop, Brandon, FL 33511
$-598
Cash flow
-7.0%
Cash-on-Cash Return
4.7%
Cap rate
0.6%
Rent to Value Ratio
Active
$299,900
3
bds
|
2
ba
|
1,644
sqft
|
built
1959
1111 Briarwood Rd, Brandon, FL 33511
$-110
Cash flow
-1.9%
Cash-on-Cash Return
5.7%
Cap rate
0.8%
Rent to Value Ratio
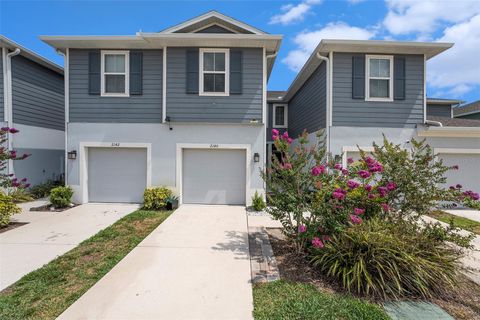
Active
$285,000
3
bds
|
3
ba
|
1,536
sqft
|
built
2020
2140 Laceflower Dr, Brandon, FL 33510
$-571
Cash flow
-10.5%
Cash-on-Cash Return
3.7%
Cap rate
0.7%
Rent to Value Ratio
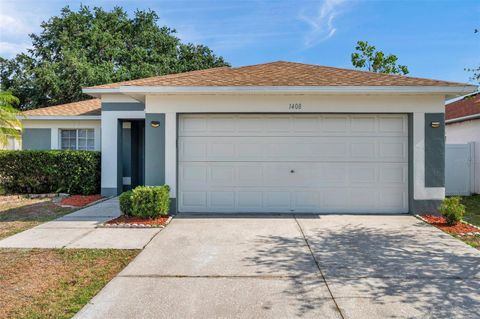
Active
$329,900
3
bds
|
2
ba
|
1,176
sqft
|
built
2000
1408 Birchstone Ave, Brandon, FL 33511
$-683
Cash flow
-10.8%
Cash-on-Cash Return
3.7%
Cap rate
0.6%
Rent to Value Ratio
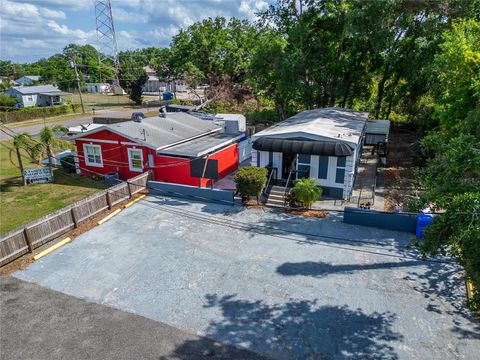
Active
$290,000
2
bds
|
1
ba
|
1,418
sqft
|
built
1953
108 E Morgan St, Brandon, FL 33510
$-478
Cash flow
-8.6%
Cash-on-Cash Return
4.2%
Cap rate
0.7%
Rent to Value Ratio
Active
$389,000
3
bds
|
2
ba
|
1,856
sqft
|
built
2000
944 Ridge Haven Dr, Brandon, FL 33511
$-847
Cash flow
-11.4%
Cash-on-Cash Return
3.5%
Cap rate
0.6%
Rent to Value Ratio
Active
$350,000
4
bds
|
2
ba
|
1,542
sqft
|
built
1969
508 E Brentridge Dr, Brandon, FL 33511
$-403
Cash flow
-6.0%
Cash-on-Cash Return
4.8%
Cap rate
0.6%
Rent to Value Ratio
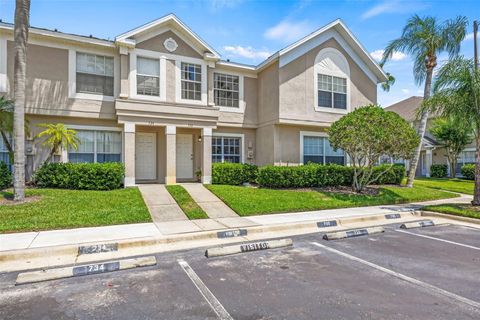
Active
$264,900
2
bds
|
3
ba
|
1,396
sqft
|
built
1998
732 Kensington Lake Cir, Brandon, FL 33511
$-479
Cash flow
-9.4%
Cash-on-Cash Return
4.0%
Cap rate
0.8%
Rent to Value Ratio
Active
$850,000
2
bds
|
3
ba
|
1,832
sqft
|
built
1954
126 Ridgewood Ave, Brandon, FL 33510
$-3,551
Cash flow
-21.8%
Cash-on-Cash Return
1.1%
Cap rate
0.2%
Rent to Value Ratio
Active
$434,000
4
bds
|
3
ba
|
2,008
sqft
|
built
1959
505 Hedge Row Rd, Brandon, FL 33510
$-528
Cash flow
-6.3%
Cash-on-Cash Return
4.7%
Cap rate
0.6%
Rent to Value Ratio
Active
$409,000
4
bds
|
2
ba
|
1,970
sqft
|
built
1961
918 Skyview Dr, Brandon, FL 33510
$-876
Cash flow
-11.2%
Cash-on-Cash Return
3.6%
Cap rate
0.5%
Rent to Value Ratio
Active
$399,999
4
bds
|
3
ba
|
1,608
sqft
|
built
1975
616 Highview Cir S, Brandon, FL 33510
$-510
Cash flow
-6.7%
Cash-on-Cash Return
4.6%
Cap rate
0.6%
Rent to Value Ratio

Active
$440,000
3
bds
|
2
ba
|
2,235
sqft
|
built
1962
505 S Larry Cir, Brandon, FL 33511
$-735
Cash flow
-8.7%
Cash-on-Cash Return
4.3%
Cap rate
0.6%
Rent to Value Ratio
Active
$435,000
3
bds
|
2
ba
|
2,061
sqft
|
built
2000
1415 Saddle Gold Ct, Brandon, FL 33511
$-961
Cash flow
-11.5%
Cash-on-Cash Return
3.5%
Cap rate
0.6%
Rent to Value Ratio
Active
$570,000
4
bds
|
2
ba
|
2,456
sqft
|
built
1980
620 Lithia Pinecrest Rd, Brandon, FL 33511
$-1,481
Cash flow
-13.6%
Cash-on-Cash Return
3.0%
Cap rate
0.5%
Rent to Value Ratio
Active
$319,000
3
bds
|
4
ba
|
1,917
sqft
|
built
2008
2547 Lexington Oak Dr, Brandon, FL 33511
$-792
Cash flow
-13.0%
Cash-on-Cash Return
3.2%
Cap rate
0.8%
Rent to Value Ratio
Active
$849,900
5
bds
|
4
ba
|
3,712
sqft
|
built
1983
1007 Morfield Ln, Brandon, FL 33511
$-1,138
Cash flow
-7.0%
Cash-on-Cash Return
4.5%
Cap rate
0.7%
Rent to Value Ratio
Active
$345,000
3
bds
|
2
ba
|
1,729
sqft
|
built
1990
1227 Tuxford Dr, Brandon, FL 33511
$-742
Cash flow
-11.2%
Cash-on-Cash Return
3.6%
Cap rate
0.6%
Rent to Value Ratio
Active
$459,999
4
bds
|
3
ba
|
2,347
sqft
|
built
1985
1502 Creekbend Dr, Brandon, FL 33510
$-1,011
Cash flow
-11.5%
Cash-on-Cash Return
3.5%
Cap rate
0.6%
Rent to Value Ratio
Active
$469,000
4
bds
|
3
ba
|
2,559
sqft
|
built
1996
923 Tuscanny St, Brandon, FL 33511
$-593
Cash flow
-6.6%
Cash-on-Cash Return
4.6%
Cap rate
0.7%
Rent to Value Ratio
Active
$550,000
4
bds
|
3
ba
|
2,877
sqft
|
built
1989
1811 Tawnee Pl, Brandon, FL 33510
$-942
Cash flow
-8.9%
Cash-on-Cash Return
4.1%
Cap rate
0.6%
Rent to Value Ratio

Active
$249,900
3
bds
|
3
ba
|
1,496
sqft
|
built
2012
778 Spring Flowers Trl, Brandon, FL 33511
$-596
Cash flow
-12.4%
Cash-on-Cash Return
3.3%
Cap rate
0.8%
Rent to Value Ratio

Active
$444,500
4
bds
|
2
ba
|
2,061
sqft
|
built
2000
1406 Bloomingdale Trails Blvd, Brandon, FL 33511
$-1,117
Cash flow
-13.1%
Cash-on-Cash Return
3.1%
Cap rate
0.6%
Rent to Value Ratio
Active
$394,900
3
bds
|
2
ba
|
1,392
sqft
|
built
1990
1511 Woonsocket Ln, Brandon, FL 33511
$-780
Cash flow
-10.3%
Cash-on-Cash Return
3.8%
Cap rate
0.5%
Rent to Value Ratio

Active
$615,000
4
bds
|
4
ba
|
2,644
sqft
|
built
1988
1004 Hollyberry Ct, Brandon, FL 33511
$-1,524
Cash flow
-12.9%
Cash-on-Cash Return
3.2%
Cap rate
0.5%
Rent to Value Ratio
Active
$435,000
5
bds
|
3
ba
|
2,600
sqft
|
built
2014
2733 Hampton Green Ln, Brandon, FL 33511
$-1,011
Cash flow
-12.1%
Cash-on-Cash Return
3.4%
Cap rate
0.6%
Rent to Value Ratio

Active
$450,000
3
bds
|
2
ba
|
1,957
sqft
|
built
1986
3810 Hollister Pl, Brandon, FL 33511
$-1,172
Cash flow
-13.6%
Cash-on-Cash Return
3.0%
Cap rate
0.5%
Rent to Value Ratio
Active
$374,995
3
bds
|
2
ba
|
1,516
sqft
|
built
1986
1529 High Knoll Dr, Brandon, FL 33511
$-847
Cash flow
-11.8%
Cash-on-Cash Return
3.4%
Cap rate
0.6%
Rent to Value Ratio
Active
$439,000
4
bds
|
2
ba
|
2,018
sqft
|
built
1995
1517 Little Brook Ln, Brandon, FL 33511
$-979
Cash flow
-11.6%
Cash-on-Cash Return
3.5%
Cap rate
0.6%
Rent to Value Ratio
Active
$289,000
3
bds
|
3
ba
|
1,718
sqft
|
built
2004
2819 Conch Hollow Dr, Brandon, FL 33511
$-909
Cash flow
-16.4%
Cash-on-Cash Return
2.4%
Cap rate
0.7%
Rent to Value Ratio
Active
$850,000
5
bds
|
4
ba
|
3,484
sqft
|
built
1967
1603 Cottagewood Dr, Brandon, FL 33510
$-1,675
Cash flow
-10.3%
Cash-on-Cash Return
3.8%
Cap rate
0.5%
Rent to Value Ratio

Active
$685,000
5
bds
|
3
ba
|
3,273
sqft
|
built
2009
607 Vintage Way, Brandon, FL 33511
$-1,400
Cash flow
-10.7%
Cash-on-Cash Return
3.7%
Cap rate
0.7%
Rent to Value Ratio

Active
$445,000
5
bds
|
3
ba
|
2,620
sqft
|
built
2014
1227 Ballard Green Pl, Brandon, FL 33511
$-842
Cash flow
-9.9%
Cash-on-Cash Return
3.9%
Cap rate
0.6%
Rent to Value Ratio