Brandon, FL Investment Properties for Sale
Browse homes for sale and investment properties in Brandon, FL. Refine your search by price, property type, or more.
Best cash flowing properties in Brandon, FL
Active
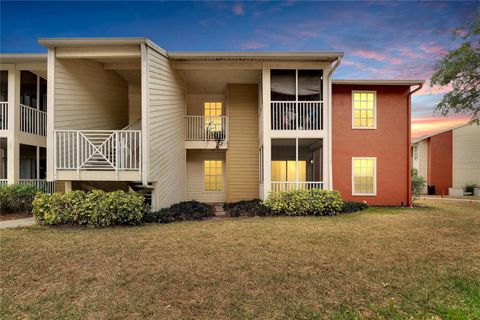
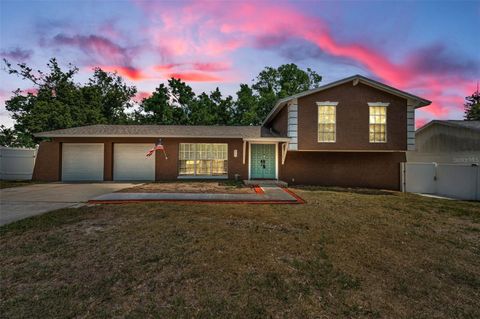
$184,999
2
bds
|
2
ba
|
811
sqft
|
built
1988
209 Lake Brook Cir, Brandon, FL 33511
$-32
Cash flow
-0.9%
Cash-on-Cash Return
5.9%
Cap rate
0.9%
Rent to Value Ratio
Active
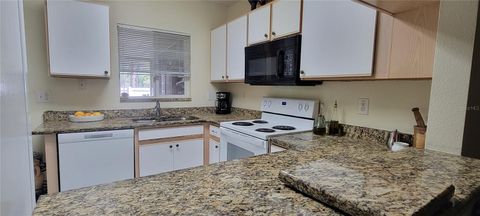
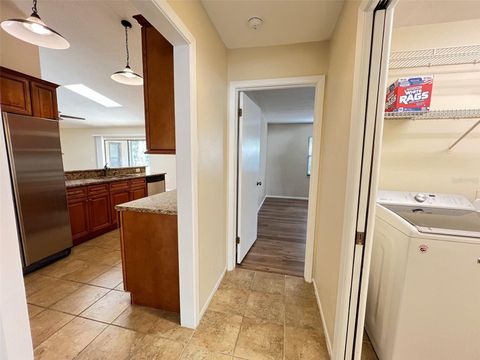
$238,000
2
bds
|
3
ba
|
1,490
sqft
|
built
2002
2213 Fluorshire Dr, Brandon, FL 33511
$-161
Cash flow
-3.5%
Cash-on-Cash Return
5.3%
Cap rate
0.8%
Rent to Value Ratio
172 out of 216 properties for sale in Brandon, FL
Limited Results Shown
Create a free account, or log in to reveal all property listings and enjoy the complete experience.

Active
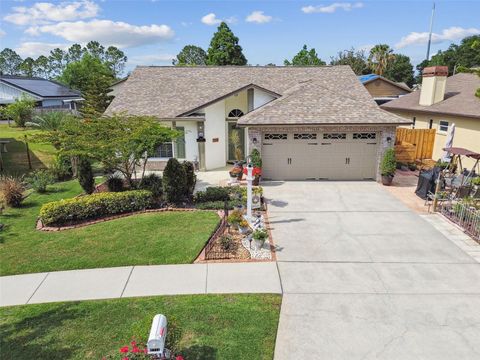
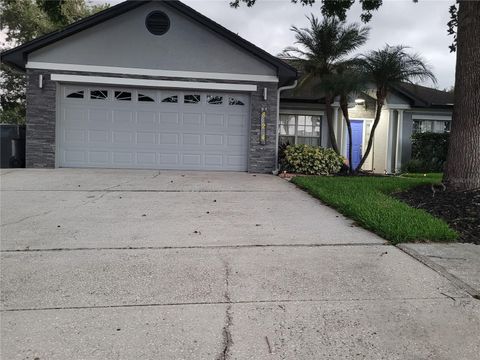
$249,900
3
bds
|
3
ba
|
1,496
sqft
|
built
2012
778 Spring Flowers Trl, Brandon, FL 33511
$-596
Cash flow
-12.4%
Cash-on-Cash Return
3.3%
Cap rate
0.8%
Rent to Value Ratio

Active
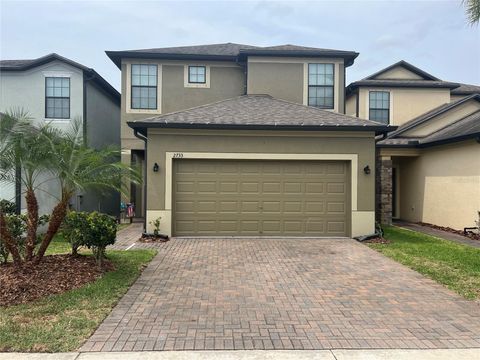
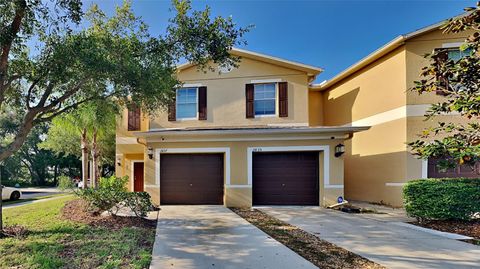
$444,500
4
bds
|
2
ba
|
2,061
sqft
|
built
2000
1406 Bloomingdale Trails Blvd, Brandon, FL 33511
$-1,117
Cash flow
-13.1%
Cash-on-Cash Return
3.1%
Cap rate
0.6%
Rent to Value Ratio
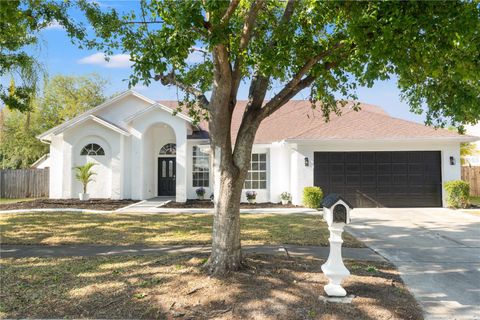
Active
$394,900
3
bds
|
2
ba
|
1,392
sqft
|
built
1990
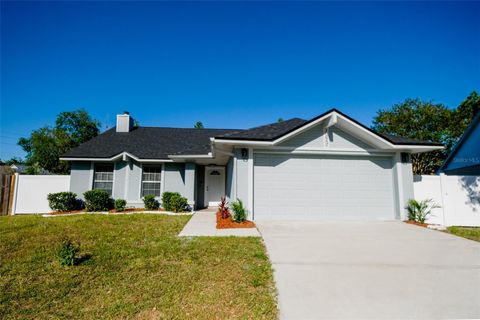
1511 Woonsocket Ln, Brandon, FL 33511
$-780
Cash flow
-10.3%
Cash-on-Cash Return
3.8%
Cap rate
0.5%
Rent to Value Ratio

Active
$615,000
4
bds
|
4
ba
|
2,644
sqft
|
built
1988
1004 Hollyberry Ct, Brandon, FL 33511
$-1,524
Cash flow
-12.9%
Cash-on-Cash Return
3.2%
Cap rate
0.5%
Rent to Value Ratio
Active
$435,000
5
bds
|
3
ba
|
2,600
sqft
|
built
2014
2733 Hampton Green Ln, Brandon, FL 33511
$-1,011
Cash flow
-12.1%
Cash-on-Cash Return
3.4%
Cap rate
0.6%
Rent to Value Ratio

Active
$450,000
3
bds
|
2
ba
|
1,957
sqft
|
built
1986
3810 Hollister Pl, Brandon, FL 33511
$-1,172
Cash flow
-13.6%
Cash-on-Cash Return
3.0%
Cap rate
0.5%
Rent to Value Ratio
Active
$374,995
3
bds
|
2
ba
|
1,516
sqft
|
built
1986
1529 High Knoll Dr, Brandon, FL 33511
$-847
Cash flow
-11.8%
Cash-on-Cash Return
3.4%
Cap rate
0.6%
Rent to Value Ratio
Active
$439,000
4
bds
|
2
ba
|
2,018
sqft
|
built
1995
1517 Little Brook Ln, Brandon, FL 33511
$-979
Cash flow
-11.6%
Cash-on-Cash Return
3.5%
Cap rate
0.6%
Rent to Value Ratio
Active
$289,000
3
bds
|
3
ba
|
1,718
sqft
|
built
2004
2819 Conch Hollow Dr, Brandon, FL 33511
$-909
Cash flow
-16.4%
Cash-on-Cash Return
2.4%
Cap rate
0.7%
Rent to Value Ratio
Active
$850,000
5
bds
|
4
ba
|
3,484
sqft
|
built
1967
1603 Cottagewood Dr, Brandon, FL 33510
$-1,675
Cash flow
-10.3%
Cash-on-Cash Return
3.8%
Cap rate
0.5%
Rent to Value Ratio

Active
$685,000
5
bds
|
3
ba
|
3,273
sqft
|
built
2009
607 Vintage Way, Brandon, FL 33511
$-1,400
Cash flow
-10.7%
Cash-on-Cash Return
3.7%
Cap rate
0.7%
Rent to Value Ratio

Active
$445,000
5
bds
|
3
ba
|
2,620
sqft
|
built
2014
1227 Ballard Green Pl, Brandon, FL 33511
$-842
Cash flow
-9.9%
Cash-on-Cash Return
3.9%
Cap rate
0.6%
Rent to Value Ratio
Active
$459,900
4
bds
|
3
ba
|
1,994
sqft
|
built
1977
613 Valley Hill Dr, Brandon, FL 33510
$-1,088
Cash flow
-12.3%
Cash-on-Cash Return
3.3%
Cap rate
0.5%
Rent to Value Ratio
Active
$459,000
4
bds
|
3
ba
|
2,150
sqft
|
built
1987
3907 Applegate Cir, Brandon, FL 33511
$-914
Cash flow
-10.4%
Cash-on-Cash Return
3.8%
Cap rate
0.6%
Rent to Value Ratio

Active
$430,000
4
bds
|
2
ba
|
1,621
sqft
|
built
1976
1204 Croydonwood Cir, Brandon, FL 33510
$-840
Cash flow
-10.2%
Cash-on-Cash Return
3.8%
Cap rate
0.5%
Rent to Value Ratio
Active
$389,900
3
bds
|
2
ba
|
1,556
sqft
|
built
1990
824 Greenbelt Cir, Brandon, FL 33510
$-597
Cash flow
-8.0%
Cash-on-Cash Return
4.3%
Cap rate
0.7%
Rent to Value Ratio
Active
$259,900
2
bds
|
3
ba
|
1,548
sqft
|
built
2011
2837 Santego Bay Ct, Brandon, FL 33511
$-701
Cash flow
-14.1%
Cash-on-Cash Return
2.9%
Cap rate
0.8%
Rent to Value Ratio
Active
$475,000
4
bds
|
2
ba
|
2,186
sqft
|
built
1996
1608 Ledgestone Dr, Brandon, FL 33511
$-1,504
Cash flow
-16.5%
Cash-on-Cash Return
2.3%
Cap rate
0.5%
Rent to Value Ratio
Active
$540,000
2
bds
|
0
ba
|
1,694
sqft
|
built
1965
122 N Oakwood Ave, Brandon, FL 33510
$-790
Cash flow
-7.6%
Cash-on-Cash Return
4.4%
Cap rate
0.6%
Rent to Value Ratio
Active
$210,000
2
bds
|
3
ba
|
1,110
sqft
|
built
2002
2362 Lake Woodberry Cir, Brandon, FL 33510
$-486
Cash flow
-12.1%
Cash-on-Cash Return
3.4%
Cap rate
0.9%
Rent to Value Ratio
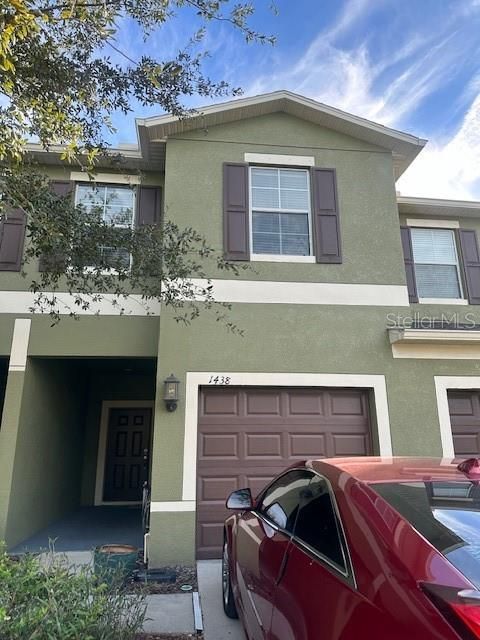
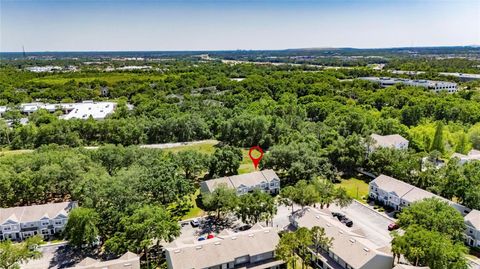
Active
$289,900
3
bds
|
3
ba
|
1,670
sqft
|
built
2013
1438 Mallory Sail Pl, Brandon, FL 33511
$-652
Cash flow
-11.7%
Cash-on-Cash Return
3.4%
Cap rate
0.8%
Rent to Value Ratio

Active
$1,995,000
8
bds
|
0
ba
|
3,457
sqft
|
built
1985
3101 Bloomingdale Villas Ct, Brandon, FL 33511
$-9,744
Cash flow
-25.5%
Cash-on-Cash Return
0.3%
Cap rate
0.1%
Rent to Value Ratio
Active
$238,000
2
bds
|
3
ba
|
1,490
sqft
|
built
2002
2213 Fluorshire Dr, Brandon, FL 33511
$-161
Cash flow
-3.5%
Cash-on-Cash Return
5.3%
Cap rate
0.8%
Rent to Value Ratio
Active
$460,000
4
bds
|
3
ba
|
2,386
sqft
|
built
2017
935 Terra Vista St, Brandon, FL 33511
$-922
Cash flow
-10.5%
Cash-on-Cash Return
3.7%
Cap rate
0.7%
Rent to Value Ratio
Active
$405,000
4
bds
|
2
ba
|
1,544
sqft
|
built
1984
1312 Foxboro Dr, Brandon, FL 33511
$-809
Cash flow
-10.4%
Cash-on-Cash Return
3.8%
Cap rate
0.6%
Rent to Value Ratio
Active
$414,900
4
bds
|
2
ba
|
1,940
sqft
|
built
2015
838 Vino Verde Cir, Brandon, FL 33511
$-844
Cash flow
-10.6%
Cash-on-Cash Return
3.7%
Cap rate
0.7%
Rent to Value Ratio
Active
$650,000
2
bds
|
2
ba
|
2,499
sqft
|
built
1963
832 S Parsons Ave, Brandon, FL 33511
$-2,351
Cash flow
-18.9%
Cash-on-Cash Return
1.8%
Cap rate
0.4%
Rent to Value Ratio
Active
$519,900
4
bds
|
2
ba
|
2,688
sqft
|
built
1989
1807 Tawnee Pl, Brandon, FL 33510
$-525
Cash flow
-5.3%
Cash-on-Cash Return
4.9%
Cap rate
0.6%
Rent to Value Ratio
Active
$299,900
3
bds
|
1
ba
|
1,328
sqft
|
built
1962
1204 E Camellia Dr, Brandon, FL 33510
$-434
Cash flow
-7.6%
Cash-on-Cash Return
4.4%
Cap rate
0.7%
Rent to Value Ratio
Active
$1,594,900
5
bds
|
3
ba
|
2,083
sqft
|
built
1979
4701 Rambling River Rd, Brandon, FL 33511
$-5,865
Cash flow
-19.2%
Cash-on-Cash Return
1.7%
Cap rate
0.3%
Rent to Value Ratio
Active
$439,900
3
bds
|
2
ba
|
1,722
sqft
|
built
2001
1419 Trail Boss Ln, Brandon, FL 33511
$-986
Cash flow
-11.7%
Cash-on-Cash Return
3.5%
Cap rate
0.6%
Rent to Value Ratio
Active
$279,000
2
bds
|
3
ba
|
1,560
sqft
|
built
2000
1304 Kelridge Pl, Brandon, FL 33511
$-530
Cash flow
-9.9%
Cash-on-Cash Return
3.9%
Cap rate
0.7%
Rent to Value Ratio
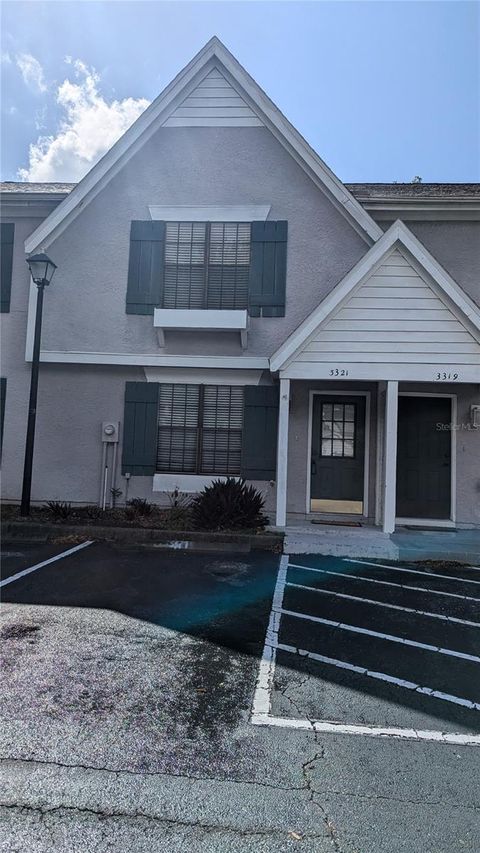
Active
$270,000
2
bds
|
3
ba
|
1,088
sqft
|
built
1985
3321 Laurel View Dr, Brandon, FL 33511
$-506
Cash flow
-9.8%
Cash-on-Cash Return
3.9%
Cap rate
0.7%
Rent to Value Ratio
Active
$269,000
3
bds
|
3
ba
|
1,558
sqft
|
built
2006
2441 Hibiscus Bay Ln, Brandon, FL 33511
$-646
Cash flow
-12.5%
Cash-on-Cash Return
3.3%
Cap rate
0.7%
Rent to Value Ratio
Active
$184,999
2
bds
|
2
ba
|
811
sqft
|
built
1988
209 Lake Brook Cir, Brandon, FL 33511
$-32
Cash flow
-0.9%
Cash-on-Cash Return
5.9%
Cap rate
0.9%
Rent to Value Ratio
Active
$510,000
4
bds
|
4
ba
|
1,735
sqft
|
built
1978
500 Hillpine Way, Brandon, FL 33510
$-1,020
Cash flow
-10.4%
Cash-on-Cash Return
3.7%
Cap rate
0.5%
Rent to Value Ratio
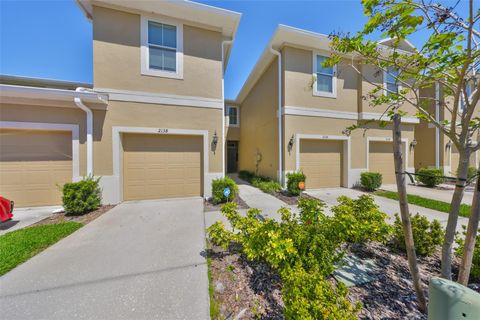
Active
$284,900
3
bds
|
3
ba
|
1,536
sqft
|
built
2016
2138 Broadway View Ave, Brandon, FL 33510
$-683
Cash flow
-12.5%
Cash-on-Cash Return
3.3%
Cap rate
0.7%
Rent to Value Ratio
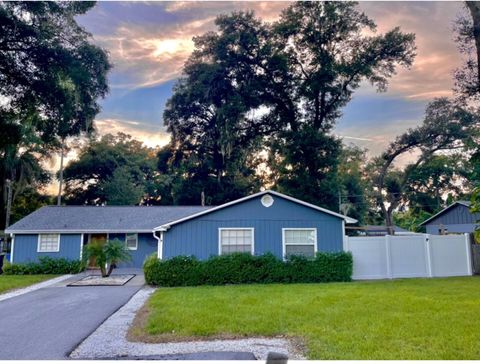
Active
$419,900
3
bds
|
2
ba
|
2,035
sqft
|
built
1974
1006 Mandalay Dr, Brandon, FL 33511
$-974
Cash flow
-12.1%
Cash-on-Cash Return
3.4%
Cap rate
0.5%
Rent to Value Ratio
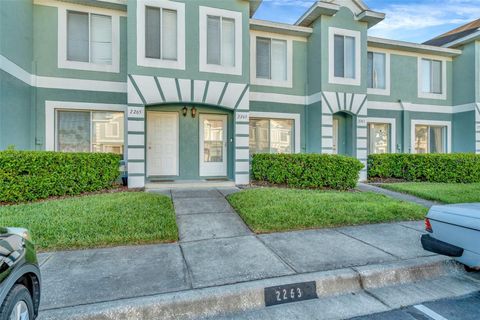
Active
$229,000
2
bds
|
3
ba
|
1,490
sqft
|
built
2002
2263 Fluorshire Dr, Brandon, FL 33511
$-449
Cash flow
-10.2%
Cash-on-Cash Return
3.8%
Cap rate
0.8%
Rent to Value Ratio
Active
$384,900
4
bds
|
2
ba
|
1,700
sqft
|
built
1972
724 Tradewinds Dr, Brandon, FL 33511
$-590
Cash flow
-8.0%
Cash-on-Cash Return
4.3%
Cap rate
0.6%
Rent to Value Ratio