Broken Arrow, OK Investment Properties for Sale
Browse homes for sale and investment properties in Broken Arrow, OK. Refine your search by price, property type, or more.
Best cash flowing properties in Broken Arrow, OK
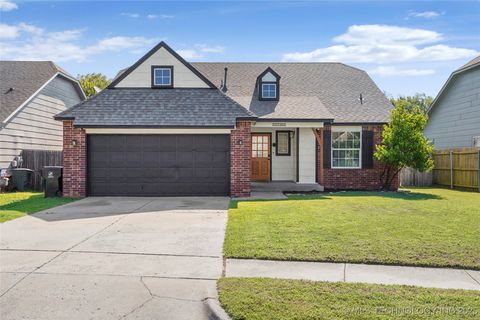
Active
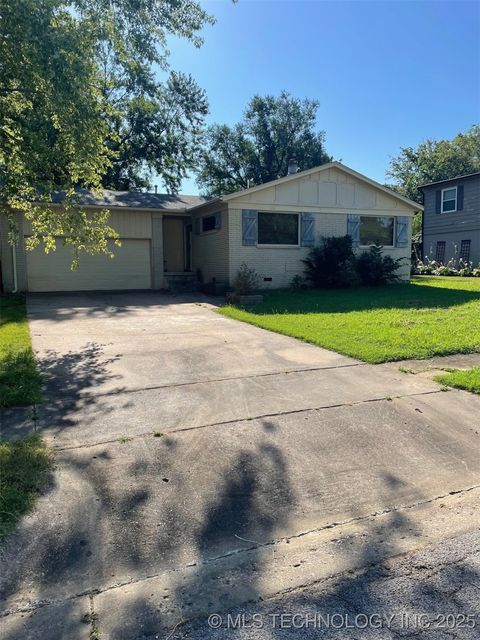
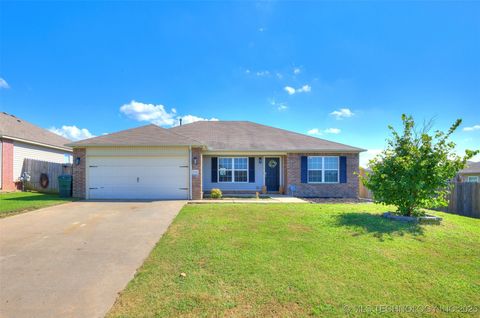
$175,000
3
bds
|
2
ba
|
1,222
sqft
|
built
1965
301 N 10th St, Broken Arrow, OK 74012
$89
Cash flow
2.7%
Cash-on-Cash Return
6.3%
Cap rate
0.9%
Rent to Value Ratio
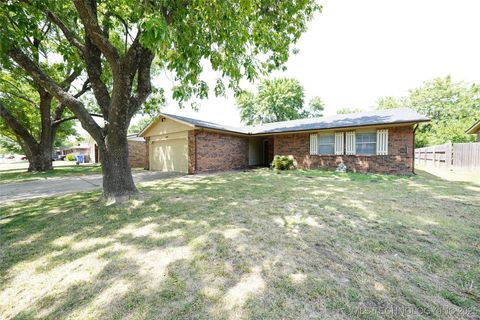
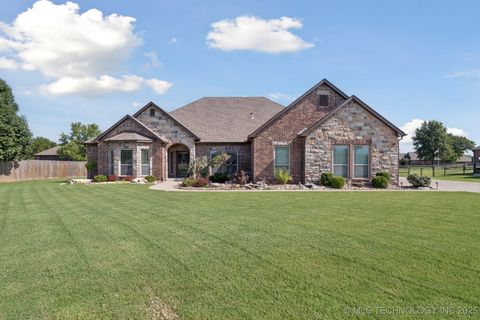
Active
$199,900
3
bds
|
2
ba
|
1,232
sqft
|
built
1978
1808 W Gary St, Broken Arrow, OK 74012
$13
Cash flow
0.3%
Cash-on-Cash Return
5.8%
Cap rate
0.8%
Rent to Value Ratio
253 out of 414 properties for sale in Broken Arrow, OK
Limited Results Shown
Create a free account, or log in to reveal all property listings and enjoy the complete experience.
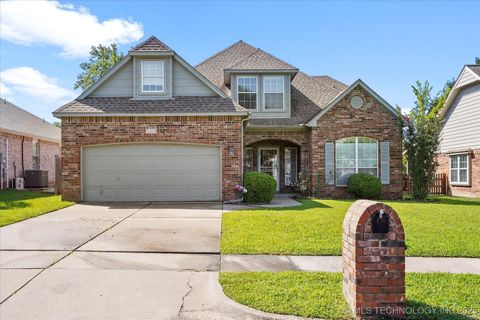
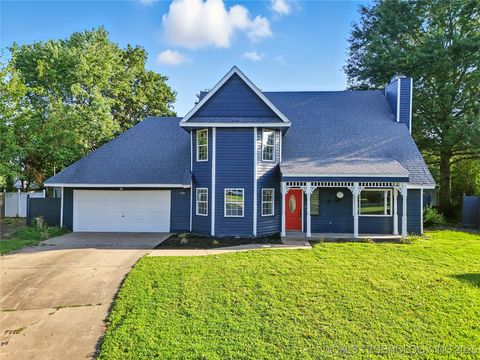
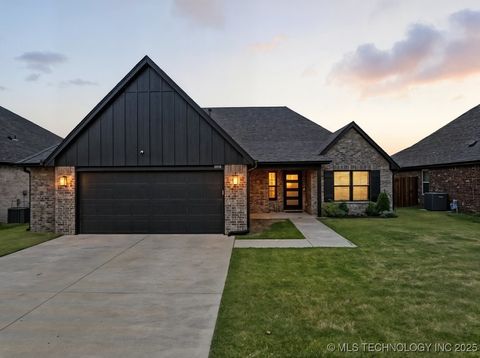
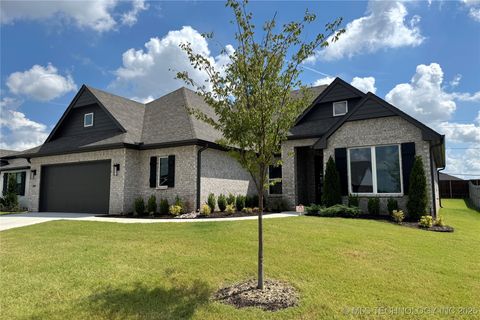
Active
$325,000
4
bds
|
3
ba
|
2,659
sqft
|
built
1995
3309 W Freeport St, Broken Arrow, OK 74012
$-443
Cash flow
-7.1%
Cash-on-Cash Return
4.0%
Cap rate
0.6%
Rent to Value Ratio
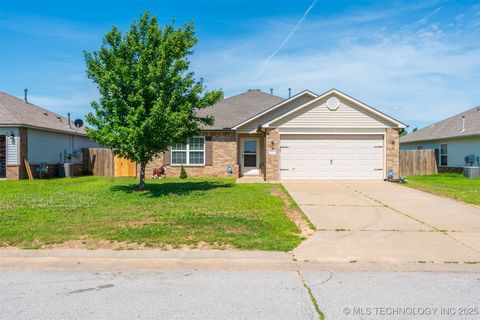
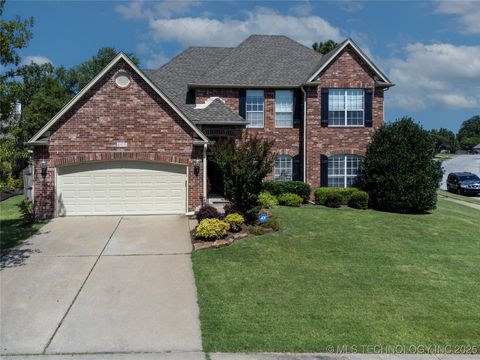
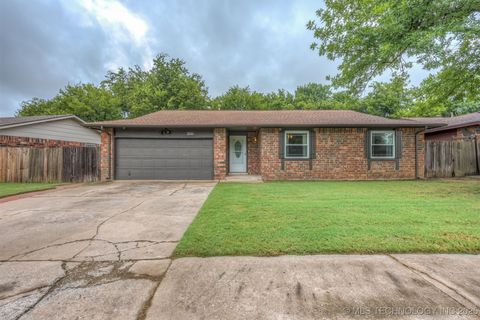
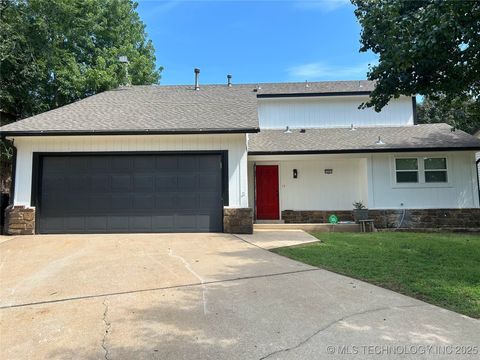
Active
$255,000
3
bds
|
2
ba
|
1,539
sqft
|
built
2014
9222 S 251st East Ave, Broken Arrow, OK 74014
$-302
Cash flow
-6.2%
Cash-on-Cash Return
4.3%
Cap rate
0.6%
Rent to Value Ratio
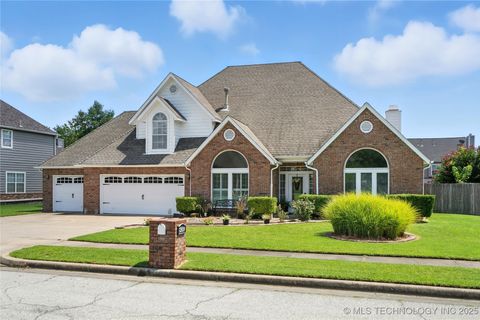
Active
$400,000
3
bds
|
3
ba
|
2,868
sqft
|
built
2022
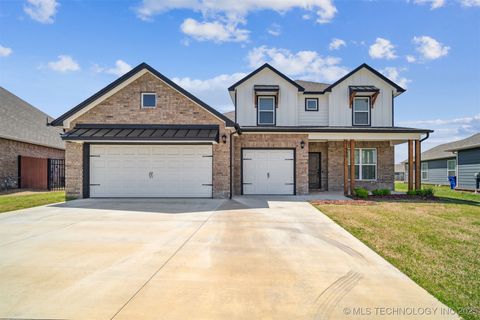
31950 E 62nd St S, Broken Arrow, OK 74014
$-520
Cash flow
-6.8%
Cash-on-Cash Return
4.1%
Cap rate
0.7%
Rent to Value Ratio
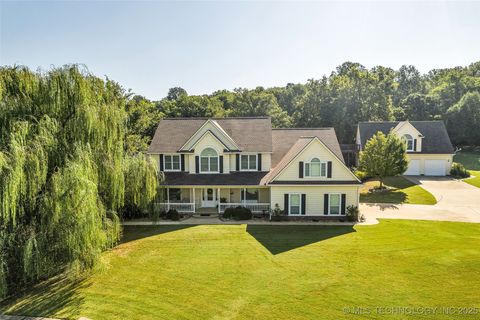
Active
$399,500
4
bds
|
3
ba
|
2,944
sqft
|
built
2007
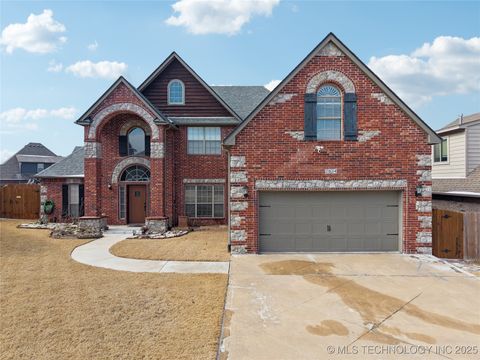
2834 N Hickory Ct, Broken Arrow, OK 74012
$-310
Cash flow
-4.0%
Cash-on-Cash Return
4.7%
Cap rate
0.7%
Rent to Value Ratio
Active
$349,000
3
bds
|
2
ba
|
2,569
sqft
|
built
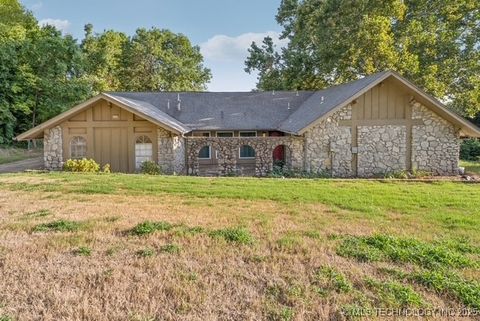
1971
12723 E 137th St S, Broken Arrow, OK 74011
$-437
Cash flow
-6.5%
Cash-on-Cash Return
4.2%
Cap rate
0.6%
Rent to Value Ratio
Active
$350,000
4
bds
|
3
ba
|
2,824
sqft
|
built
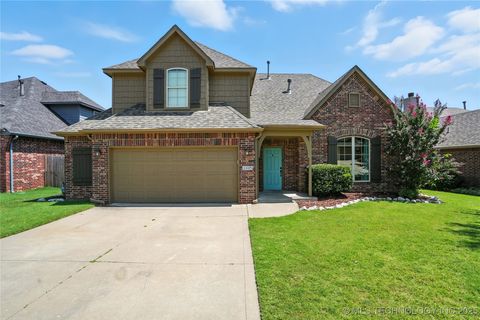
2012
3305 S 18th St, Broken Arrow, OK 74012
$-385
Cash flow
-5.7%
Cash-on-Cash Return
4.4%
Cap rate
0.7%
Rent to Value Ratio
Active
$495,000
3
bds
|
3
ba
|
3,045
sqft
|
built
1977
11 Cedar Ridge Rd, Broken Arrow, OK 74011
$-961
Cash flow
-10.1%
Cash-on-Cash Return
3.3%
Cap rate
0.5%
Rent to Value Ratio

Active
$649,000
4
bds
|
4
ba
|
3,978
sqft
|
built
1999
3816 S Yellow Pine Ave, Broken Arrow, OK 74011
$-1,351
Cash flow
-10.9%
Cash-on-Cash Return
3.2%
Cap rate
0.5%
Rent to Value Ratio
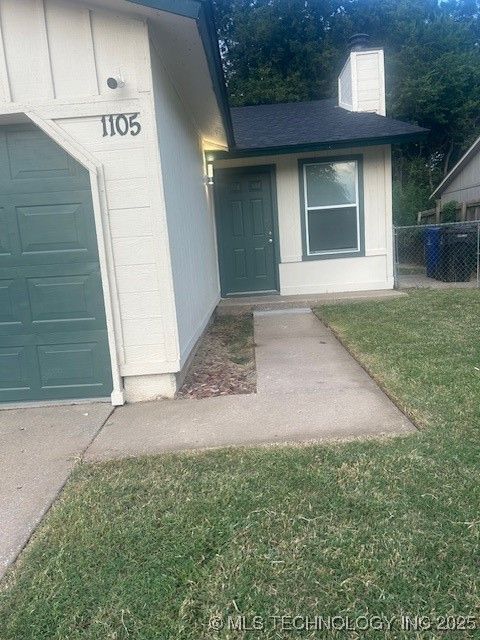
Active
$184,000
3
bds
|
2
ba
|
1,142
sqft
|
built
1983
1105 N Narcissus Ave, Broken Arrow, OK 74012
$9
Cash flow
0.3%
Cash-on-Cash Return
5.7%
Cap rate
0.8%
Rent to Value Ratio
Active
$290,000
4
bds
|
3
ba
|
2,089
sqft
|
built
1979
500 S 25th St, Broken Arrow, OK 74014
$-205
Cash flow
-3.7%
Cash-on-Cash Return
4.8%
Cap rate
0.7%
Rent to Value Ratio

Active
$219,900
3
bds
|
2
ba
|
1,371
sqft
|
built
1976
904 W Norman St, Broken Arrow, OK 74012
$-91
Cash flow
-2.2%
Cash-on-Cash Return
5.2%
Cap rate
0.7%
Rent to Value Ratio
Active
$1,800,000
5
bds
|
5
ba
|
5,768
sqft
|
built
2007
26175 E 93rd St S, Broken Arrow, OK 74014
$-5,658
Cash flow
-16.4%
Cash-on-Cash Return
1.9%
Cap rate
0.3%
Rent to Value Ratio
Active
$330,000
4
bds
|
3
ba
|
2,645
sqft
|
built
2002
4200 N Oak Ave, Broken Arrow, OK 74012
$-324
Cash flow
-5.1%
Cash-on-Cash Return
4.5%
Cap rate
0.7%
Rent to Value Ratio
Active
$559,000
4
bds
|
3
ba
|
2,689
sqft
|
built
2022
6323 N 25th St, Broken Arrow, OK 74014
$-1,598
Cash flow
-14.9%
Cash-on-Cash Return
2.2%
Cap rate
0.4%
Rent to Value Ratio
Active
$499,000
4
bds
|
3
ba
|
2,678
sqft
|
built
2021
815 N 87th St, Broken Arrow, OK 74014
$-1,158
Cash flow
-12.1%
Cash-on-Cash Return
2.9%
Cap rate
0.5%
Rent to Value Ratio
Active
$287,000
3
bds
|
2
ba
|
1,742
sqft
|
built
2007
20495 E 33rd Pl S, Broken Arrow, OK 74014
$-360
Cash flow
-6.5%
Cash-on-Cash Return
4.2%
Cap rate
0.6%
Rent to Value Ratio
Active
$398,000
4
bds
|
2
ba
|
2,430
sqft
|
built
1970
12833 S 114th East Ave, Broken Arrow, OK 74011
$-753
Cash flow
-9.9%
Cash-on-Cash Return
3.4%
Cap rate
0.5%
Rent to Value Ratio
Active
$430,000
5
bds
|
3
ba
|
2,897
sqft
|
built
2007
4708 N Maple Ave, Broken Arrow, OK 74012
$-554
Cash flow
-6.7%
Cash-on-Cash Return
4.1%
Cap rate
0.7%
Rent to Value Ratio
Active
$315,000
3
bds
|
2
ba
|
1,736
sqft
|
built
2017
3405 E Sandusky St, Broken Arrow, OK 74014
$-469
Cash flow
-7.8%
Cash-on-Cash Return
3.9%
Cap rate
0.6%
Rent to Value Ratio
Active
$319,500
3
bds
|
2
ba
|
1,748
sqft
|
built
1973
1400 W Quinton St, Broken Arrow, OK 74011
$-352
Cash flow
-5.7%
Cash-on-Cash Return
4.4%
Cap rate
0.6%
Rent to Value Ratio
Active
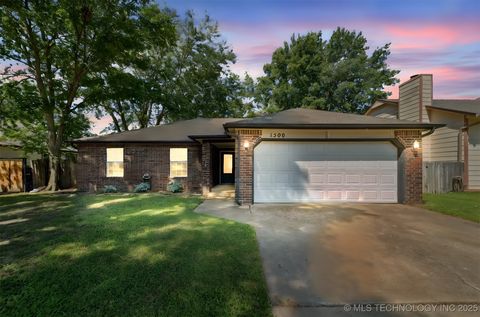
$239,900
3
bds
|
2
ba
|
1,277
sqft
|
built
1991
1500 N 24th St, Broken Arrow, OK 74014
$-210
Cash flow
-4.6%
Cash-on-Cash Return
4.6%
Cap rate
0.7%
Rent to Value Ratio
Active
$349,000
3
bds
|
3
ba
|
2,284
sqft
|
built
1973
7845 S Townsend Ave, Broken Arrow, OK 74014
$-425
Cash flow
-6.4%
Cash-on-Cash Return
4.2%
Cap rate
0.6%
Rent to Value Ratio
Active
$299,000
3
bds
|
2
ba
|
1,841
sqft
|
built
2006
925 S 75th St, Broken Arrow, OK 74014
$-412
Cash flow
-7.2%
Cash-on-Cash Return
4.0%
Cap rate
0.6%
Rent to Value Ratio
Active
$290,000
3
bds
|
2
ba
|
1,931
sqft
|
built
2007
5123 N 34th St, Broken Arrow, OK 74014
$-444
Cash flow
-8.0%
Cash-on-Cash Return
3.8%
Cap rate
0.6%
Rent to Value Ratio
Active
$450,000
4
bds
|
3
ba
|
2,557
sqft
|
built
2012
30217 E 69th St S, Broken Arrow, OK 74014
$-1,001
Cash flow
-11.6%
Cash-on-Cash Return
3.0%
Cap rate
0.4%
Rent to Value Ratio
Active
$285,000
3
bds
|
3
ba
|
1,892
sqft
|
built
1981
4000 S Chestnut Ave, Broken Arrow, OK 74011
$-293
Cash flow
-5.4%
Cash-on-Cash Return
4.4%
Cap rate
0.6%
Rent to Value Ratio
Active
$435,000
4
bds
|
3
ba
|
3,232
sqft
|
built
1996
4400 W Freeport Cir, Broken Arrow, OK 74012
$-595
Cash flow
-7.1%
Cash-on-Cash Return
4.0%
Cap rate
0.6%
Rent to Value Ratio
Active
$385,000
5
bds
|
3
ba
|
2,810
sqft
|
built
2006
1310 S Aster Pl, Broken Arrow, OK 74012
$-456
Cash flow
-6.2%
Cash-on-Cash Return
4.3%
Cap rate
0.6%
Rent to Value Ratio
Active
$299,500
4
bds
|
2
ba
|
1,690
sqft
|
built
2020
1227 E San Antonio St, Broken Arrow, OK 74012
$-434
Cash flow
-7.6%
Cash-on-Cash Return
3.9%
Cap rate
0.6%
Rent to Value Ratio
Active
$210,000
3
bds
|
1
ba
|
1,092
sqft
|
built
1955
1505 S Elm Pl, Broken Arrow, OK 74012
$-110
Cash flow
-2.7%
Cash-on-Cash Return
5.1%
Cap rate
0.7%
Rent to Value Ratio
Active
$434,777
4
bds
|
3
ba
|
2,275
sqft
|
built
2022
908 E Fulton Ct, Broken Arrow, OK 74012
$-649
Cash flow
-7.8%
Cash-on-Cash Return
3.9%
Cap rate
0.6%
Rent to Value Ratio
Active
$350,000
4
bds
|
2
ba
|
2,159
sqft
|
built
2022
10106 S 228th East Ave, Broken Arrow, OK 74014
$-499
Cash flow
-7.4%
Cash-on-Cash Return
4.0%
Cap rate
0.6%
Rent to Value Ratio
Active
$240,000
3
bds
|
2
ba
|
1,477
sqft
|
built
1978
2016 W Delmar St, Broken Arrow, OK 74012
$-197
Cash flow
-4.3%
Cash-on-Cash Return
4.7%
Cap rate
0.7%
Rent to Value Ratio
Active
$355,000
4
bds
|
3
ba
|
2,981
sqft
|
built
1990
1309 E Concord St, Broken Arrow, OK 74012
$-361
Cash flow
-5.3%
Cash-on-Cash Return
4.5%
Cap rate
0.6%
Rent to Value Ratio
Active
$1,195,000
6
bds
|
5
ba
|
5,708
sqft
|
built
2006
28899 E 95th St S, Broken Arrow, OK 74014
$-4,141
Cash flow
-18.1%
Cash-on-Cash Return
1.5%
Cap rate
0.3%
Rent to Value Ratio
Active
$242,500
3
bds
|
2
ba
|
1,583
sqft
|
built
2015
25158 E 92nd Ct S, Broken Arrow, OK 74014
$-245
Cash flow
-5.3%
Cash-on-Cash Return
4.5%
Cap rate
0.7%
Rent to Value Ratio
Active
$389,900
3
bds
|
2
ba
|
1,929
sqft
|
built
2024
2919 S 8th St, Broken Arrow, OK 74012
$-155
Cash flow
-2.1%
Cash-on-Cash Return
5.2%
Cap rate
0.6%
Rent to Value Ratio
Active
$298,950
3
bds
|
3
ba
|
2,038
sqft
|
built
1985
7301 S Juniper Ave, Broken Arrow, OK 74011
$-263
Cash flow
-4.6%
Cash-on-Cash Return
4.6%
Cap rate
0.7%
Rent to Value Ratio