Broken Arrow, OK Investment Properties for Sale
Browse homes for sale and investment properties in Broken Arrow, OK. Refine your search by price, property type, or more.
Best cash flowing properties in Broken Arrow, OK
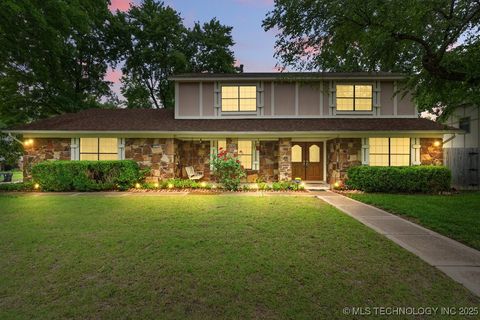
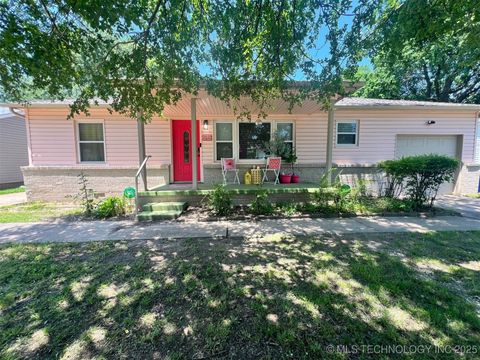
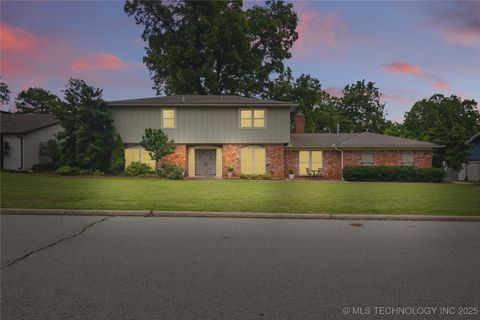
Active
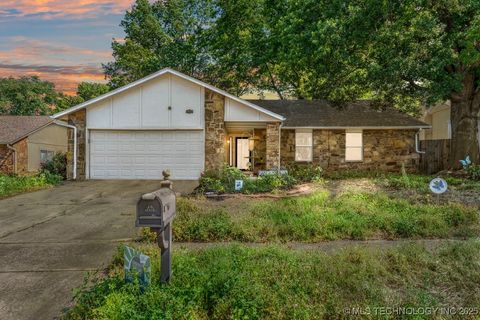
$242,500
3
bds
|
2
ba
|
1,604
sqft
|
built
1980
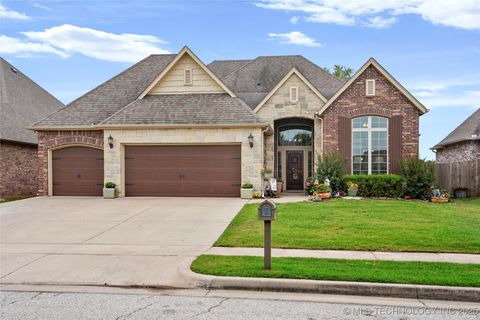
412 W Los Angeles St, Broken Arrow, OK 74011
$-58
Cash flow
-1.2%
Cash-on-Cash Return
5.4%
Cap rate
0.8%
Rent to Value Ratio
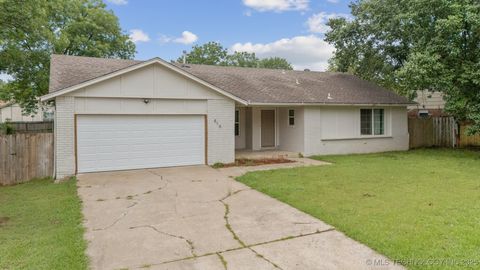
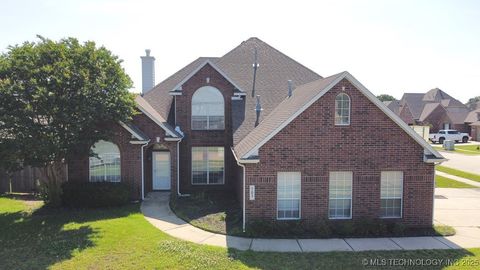
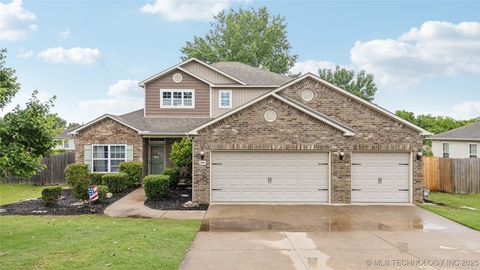
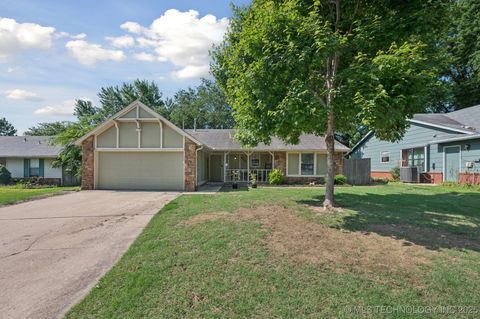
Active
$225,000
3
bds
|
2
ba
|
1,404
sqft
|
built
1978
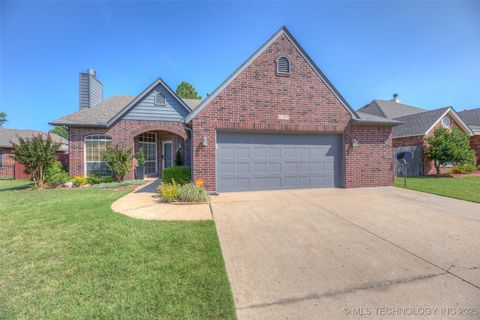
816 W Birmingham St, Broken Arrow, OK 74011
$-85
Cash flow
-2.0%
Cash-on-Cash Return
5.2%
Cap rate
0.8%
Rent to Value Ratio
278 out of 399 properties for sale in Broken Arrow, OK
Limited Results Shown
Create a free account, or log in to reveal all property listings and enjoy the complete experience.
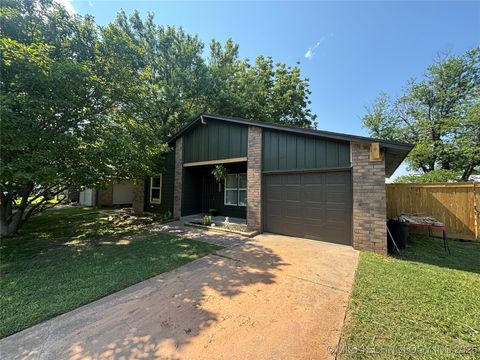
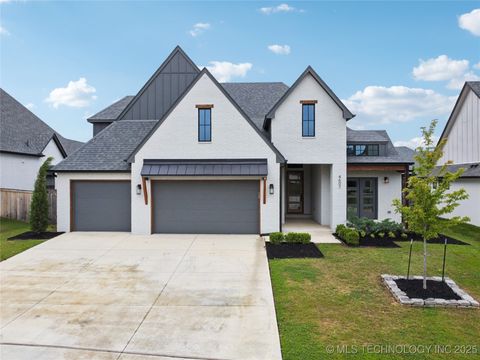
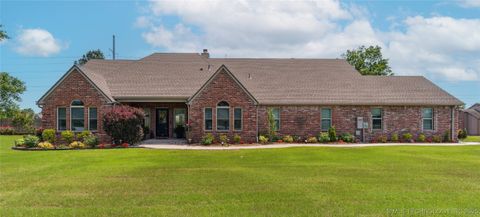
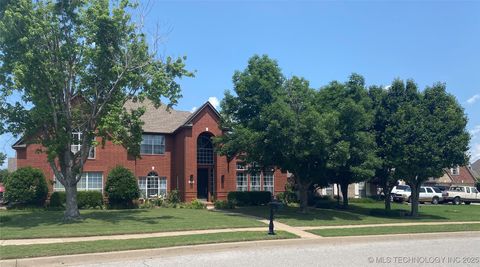
Active
$222,500
3
bds
|
1
ba
|
1,061
sqft
|
built
1980
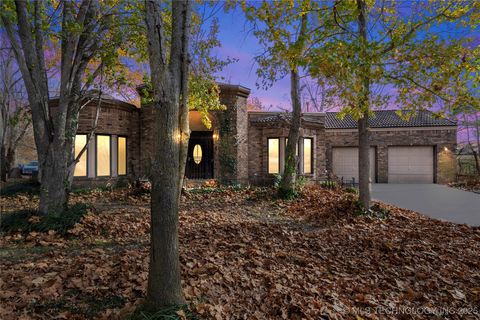
722 W Commercial St, Broken Arrow, OK 74012
$-174
Cash flow
-4.1%
Cash-on-Cash Return
4.7%
Cap rate
0.6%
Rent to Value Ratio
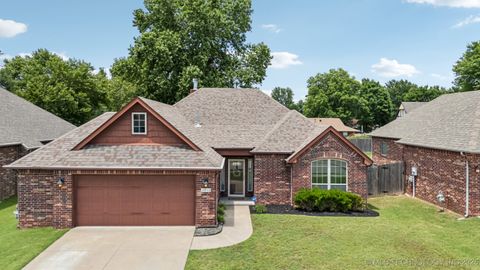
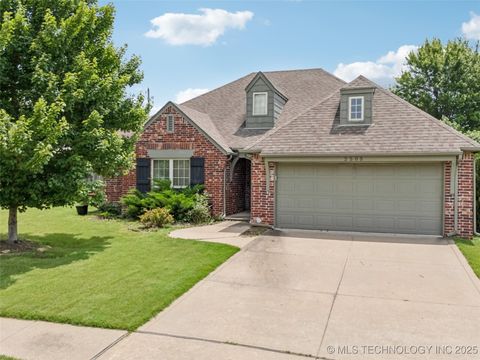
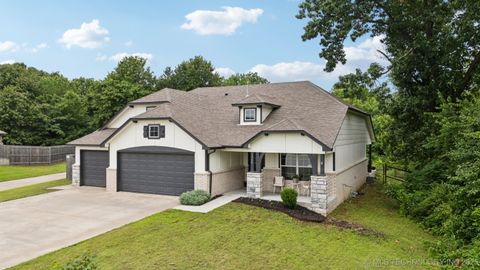
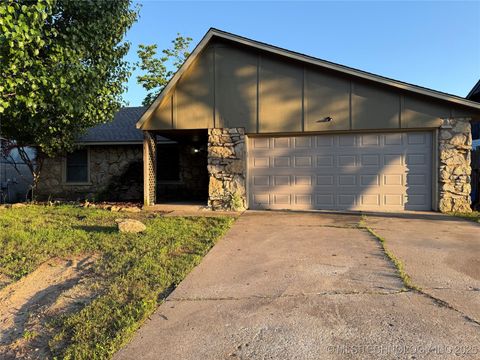
Active
$320,000
3
bds
|
2
ba
|
1,859
sqft
|
built
2012
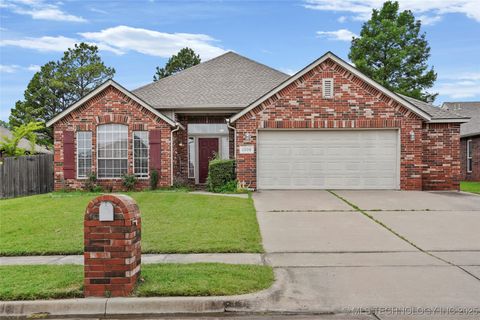
3012 W Mobile St, Broken Arrow, OK 74011
$-701
Cash flow
-11.4%
Cash-on-Cash Return
3.6%
Cap rate
0.6%
Rent to Value Ratio
Active
$289,900
4
bds
|
3
ba
|
2,384
sqft
|
built
1978
2612 W Quincy St, Broken Arrow, OK 74012
$-307
Cash flow
-5.5%
Cash-on-Cash Return
4.4%
Cap rate
0.6%
Rent to Value Ratio
Active
$369,900
4
bds
|
3
ba
|
2,874
sqft
|
built
2000
703 N Butternut Ct, Broken Arrow, OK 74012
$-369
Cash flow
-5.2%
Cash-on-Cash Return
4.5%
Cap rate
0.7%
Rent to Value Ratio
Active
$750,000
4
bds
|
5
ba
|
3,850
sqft
|
built
2022
4607 S Retana Pl, Broken Arrow, OK 74011
$-1,798
Cash flow
-12.5%
Cash-on-Cash Return
2.8%
Cap rate
0.5%
Rent to Value Ratio
Active
$399,900
4
bds
|
3
ba
|
2,917
sqft
|
built
2005
2505 S Willow Ave, Broken Arrow, OK 74012
$-613
Cash flow
-8.0%
Cash-on-Cash Return
3.8%
Cap rate
0.6%
Rent to Value Ratio
Active
$360,000
4
bds
|
2
ba
|
2,121
sqft
|
built
2021
2005 E Union St, Broken Arrow, OK 74011
$-533
Cash flow
-7.7%
Cash-on-Cash Return
3.9%
Cap rate
0.6%
Rent to Value Ratio
Active
$349,900
3
bds
|
2
ba
|
2,201
sqft
|
built
1996
4204 W Freeport St, Broken Arrow, OK 74012
$-653
Cash flow
-9.7%
Cash-on-Cash Return
3.4%
Cap rate
0.5%
Rent to Value Ratio
Active
$309,000
3
bds
|
2
ba
|
1,905
sqft
|
built
1977
2604 W Broadway St, Broken Arrow, OK 74012
$-572
Cash flow
-9.7%
Cash-on-Cash Return
3.5%
Cap rate
0.5%
Rent to Value Ratio
Active
$320,000
5
bds
|
2
ba
|
2,427
sqft
|
built
1989
1802 S Fir Pl, Broken Arrow, OK 74012
$-423
Cash flow
-6.9%
Cash-on-Cash Return
4.1%
Cap rate
0.6%
Rent to Value Ratio
Active
$475,000
5
bds
|
3
ba
|
3,398
sqft
|
built
2011
3501 W Gary St, Broken Arrow, OK 74012
$-595
Cash flow
-6.5%
Cash-on-Cash Return
4.2%
Cap rate
0.7%
Rent to Value Ratio
Active
$379,900
4
bds
|
2
ba
|
2,212
sqft
|
built
2005
4108 W Fulton St, Broken Arrow, OK 74012
$-742
Cash flow
-10.2%
Cash-on-Cash Return
3.3%
Cap rate
0.5%
Rent to Value Ratio
Active
$990,000
3
bds
|
3
ba
|
2,921
sqft
|
built
1989
11601 S 193rd East Ave, Broken Arrow, OK 74014
$-2,845
Cash flow
-15.0%
Cash-on-Cash Return
2.2%
Cap rate
0.3%
Rent to Value Ratio
Active
$295,000
4
bds
|
2
ba
|
2,050
sqft
|
built
2003
1908 N 7th St, Broken Arrow, OK 74012
$-278
Cash flow
-4.9%
Cash-on-Cash Return
4.5%
Cap rate
0.7%
Rent to Value Ratio
Active
$1,500,000
5
bds
|
4
ba
|
5,220
sqft
|
built
1997
9914 S Garnett Rd, Broken Arrow, OK 74012
$-5,221
Cash flow
-18.2%
Cash-on-Cash Return
1.5%
Cap rate
0.3%
Rent to Value Ratio
Active
$399,900
3
bds
|
3
ba
|
2,207
sqft
|
built
2020
7000 S Elder Ave, Broken Arrow, OK 74011
$-779
Cash flow
-10.2%
Cash-on-Cash Return
3.3%
Cap rate
0.6%
Rent to Value Ratio

Active
$339,900
4
bds
|
2
ba
|
1,967
sqft
|
built
2020
7221 S Indianwood Ave, Broken Arrow, OK 74011
$-552
Cash flow
-8.5%
Cash-on-Cash Return
3.7%
Cap rate
0.6%
Rent to Value Ratio
Active
$400,000
4
bds
|
3
ba
|
2,501
sqft
|
built
2001
2817 W Oakland St, Broken Arrow, OK 74012
$-778
Cash flow
-10.1%
Cash-on-Cash Return
3.3%
Cap rate
0.5%
Rent to Value Ratio
Active
$555,000
4
bds
|
4
ba
|
3,150
sqft
|
built
2021
6705 S Palm Ave, Broken Arrow, OK 74011
$-1,386
Cash flow
-13.0%
Cash-on-Cash Return
2.7%
Cap rate
0.5%
Rent to Value Ratio
Active
$225,000
3
bds
|
2
ba
|
1,416
sqft
|
built
1960
1138 N Gum Ave, Broken Arrow, OK 74012
$-116
Cash flow
-2.7%
Cash-on-Cash Return
5.1%
Cap rate
0.7%
Rent to Value Ratio
Active
$619,900
3
bds
|
2
ba
|
2,158
sqft
|
built
2023
3406 W Quantico Pl, Broken Arrow, OK 74011
$-1,656
Cash flow
-13.9%
Cash-on-Cash Return
2.5%
Cap rate
0.5%
Rent to Value Ratio
Active
$349,900
3
bds
|
2
ba
|
1,898
sqft
|
built
2021
23313 E 101st Pl S, Broken Arrow, OK 74014
$-621
Cash flow
-9.3%
Cash-on-Cash Return
3.5%
Cap rate
0.6%
Rent to Value Ratio
Active
$549,000
3
bds
|
4
ba
|
3,359
sqft
|
built
2006
913 E Shreveport St, Broken Arrow, OK 74011
$-909
Cash flow
-8.6%
Cash-on-Cash Return
3.7%
Cap rate
0.6%
Rent to Value Ratio
Active
$395,000
3
bds
|
2
ba
|
1,440
sqft
|
built
1983
7205 S Date Pl, Broken Arrow, OK 74011
$-1,056
Cash flow
-13.9%
Cash-on-Cash Return
2.5%
Cap rate
0.4%
Rent to Value Ratio
Active
$189,900
3
bds
|
1
ba
|
868
sqft
|
built
1972
11522 E 64th St, Broken Arrow, OK 74012
$-101
Cash flow
-2.8%
Cash-on-Cash Return
5.0%
Cap rate
0.7%
Rent to Value Ratio
Active
$599,000
4
bds
|
4
ba
|
4,738
sqft
|
built
1992
23240 E 90th St S, Broken Arrow, OK 74014
$-1,053
Cash flow
-9.2%
Cash-on-Cash Return
3.6%
Cap rate
0.5%
Rent to Value Ratio
Active
$339,500
3
bds
|
2
ba
|
1,886
sqft
|
built
2024
2508 S Sycamore Ave, Broken Arrow, OK 74012
$-1,119
Cash flow
-17.2%
Cash-on-Cash Return
1.7%
Cap rate
0.4%
Rent to Value Ratio
Active
$315,000
3
bds
|
2
ba
|
1,696
sqft
|
built
1955
1610 S Ash Ave, Broken Arrow, OK 74012
$-480
Cash flow
-8.0%
Cash-on-Cash Return
3.9%
Cap rate
0.5%
Rent to Value Ratio
Active
$350,000
3
bds
|
3
ba
|
2,110
sqft
|
built
2011
2704 W Imperial St, Broken Arrow, OK 74011
$-597
Cash flow
-8.9%
Cash-on-Cash Return
3.6%
Cap rate
0.6%
Rent to Value Ratio
Active
$600,000
4
bds
|
3
ba
|
3,276
sqft
|
built
1994
21542 E 103rd St S, Broken Arrow, OK 74014
$-1,439
Cash flow
-12.5%
Cash-on-Cash Return
2.8%
Cap rate
0.4%
Rent to Value Ratio
Active
$370,000
4
bds
|
2
ba
|
1,967
sqft
|
built
2019
7504 S Indianwood Ave, Broken Arrow, OK 74011
$-691
Cash flow
-9.7%
Cash-on-Cash Return
3.4%
Cap rate
0.5%
Rent to Value Ratio
Active
$324,590
3
bds
|
3
ba
|
2,297
sqft
|
built
1971
8313 Shadowood Ave, Broken Arrow, OK 74011
$-427
Cash flow
-6.9%
Cash-on-Cash Return
4.1%
Cap rate
0.6%
Rent to Value Ratio
Active
$245,000
3
bds
|
2
ba
|
1,588
sqft
|
built
1984
4509 W Toledo St, Broken Arrow, OK 74012
$-106
Cash flow
-2.3%
Cash-on-Cash Return
5.2%
Cap rate
0.7%
Rent to Value Ratio
Active
$499,900
4
bds
|
4
ba
|
3,715
sqft
|
built
2001
1816 W Sandusky St, Broken Arrow, OK 74012
$-897
Cash flow
-9.4%
Cash-on-Cash Return
3.5%
Cap rate
0.6%
Rent to Value Ratio
Active
$208,500
3
bds
|
2
ba
|
1,195
sqft
|
built
1980
211 E Waco Pl, Broken Arrow, OK 74011
$-146
Cash flow
-3.7%
Cash-on-Cash Return
4.8%
Cap rate
0.7%
Rent to Value Ratio

Active
$479,900
3
bds
|
3
ba
|
2,843
sqft
|
built
2022
7509 S Chestnut Ave, Broken Arrow, OK 74011
$-597
Cash flow
-6.5%
Cash-on-Cash Return
4.2%
Cap rate
0.5%
Rent to Value Ratio
Active
$359,900
4
bds
|
2
ba
|
2,112
sqft
|
built
2021
7417 E Jackson St, Broken Arrow, OK 74014
$-714
Cash flow
-10.4%
Cash-on-Cash Return
3.3%
Cap rate
0.6%
Rent to Value Ratio
Active
$260,000
3
bds
|
2
ba
|
2,119
sqft
|
built
1976
4004 S Hickory Ave, Broken Arrow, OK 74011
$-106
Cash flow
-2.1%
Cash-on-Cash Return
5.2%
Cap rate
0.7%
Rent to Value Ratio