Buford, GA Investment Properties for Sale
Browse homes for sale and investment properties in Buford, GA. Refine your search by price, property type, or more.
Best cash flowing properties in Buford, GA
Active
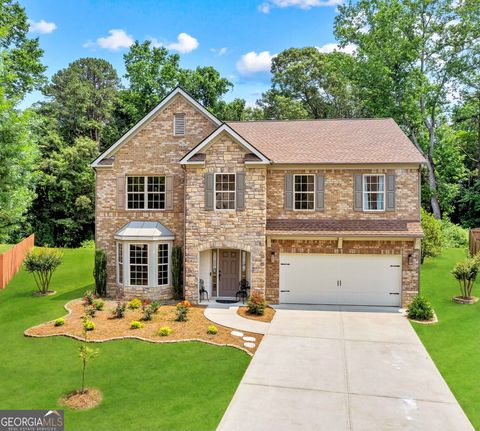
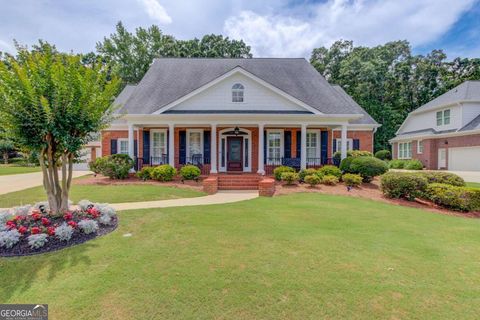
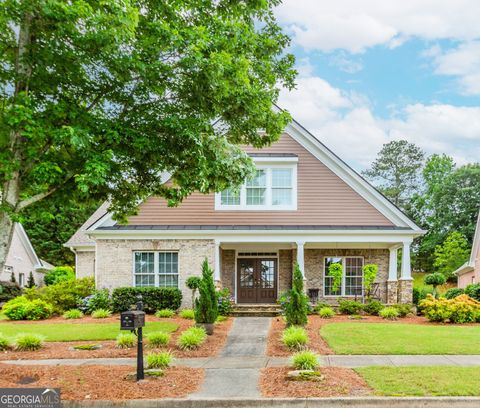
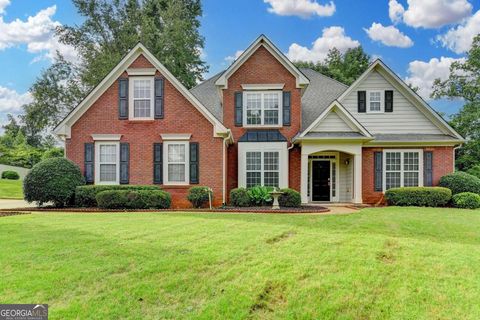
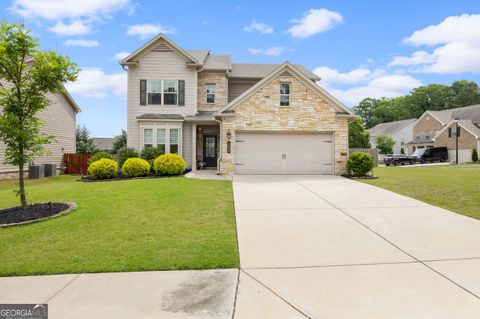
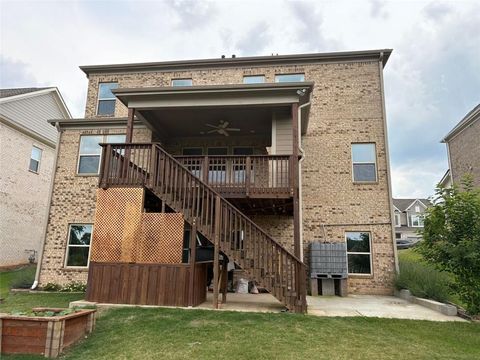
$499,000
5
bds
|
0
ba
|
2,878
sqft
|
built
2011
3547 Edenridge Ct, Buford, GA 30519
$-678
Cash flow
-7.1%
Cash-on-Cash Return
4.5%
Cap rate
0.6%
Rent to Value Ratio

Active
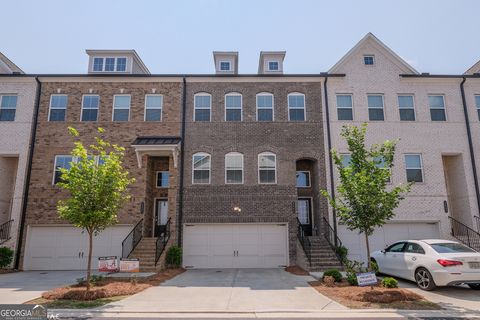
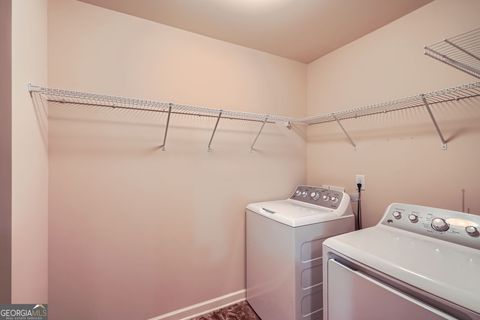
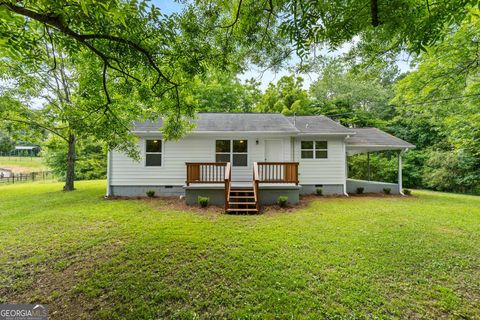
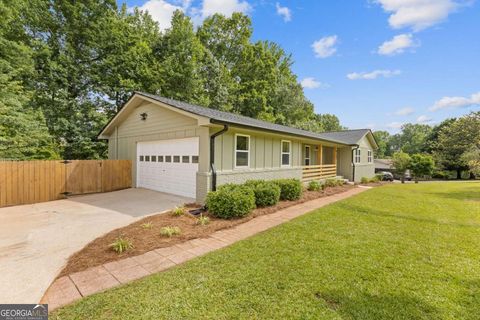
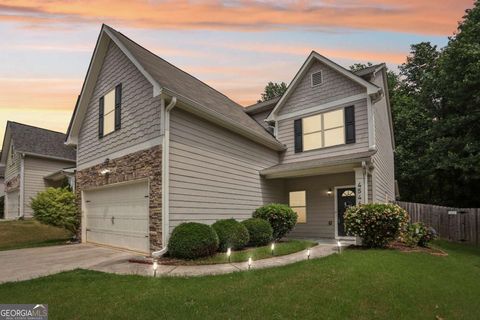
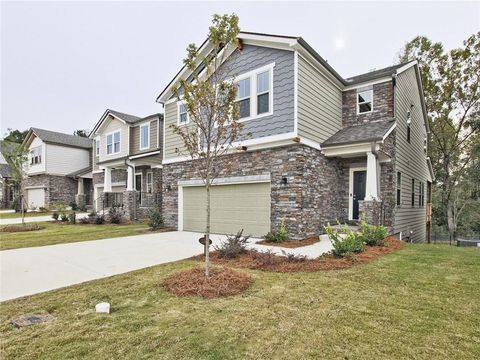
$374,900
3
bds
|
0
ba
|
1,924
sqft
|
built
2014
3511 Brockenhurst Dr, Buford, GA 30519
$-707
Cash flow
-9.8%
Cash-on-Cash Return
3.9%
Cap rate
0.6%
Rent to Value Ratio
265 out of 282 properties for sale in Buford, GA
Limited Results Shown
Create a free account, or log in to reveal all property listings and enjoy the complete experience.
Active
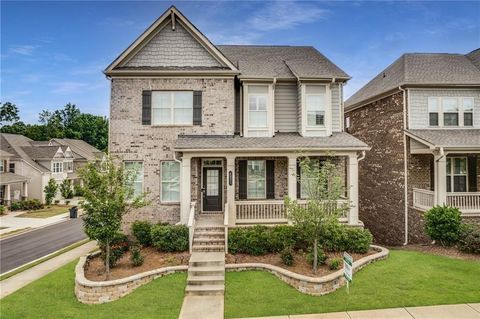
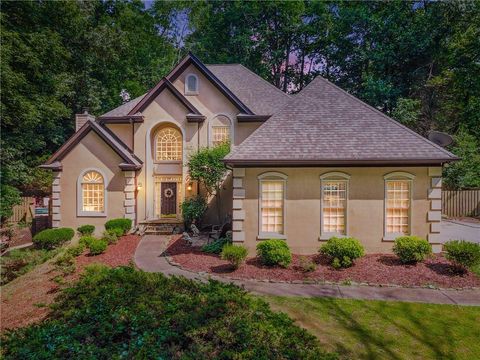
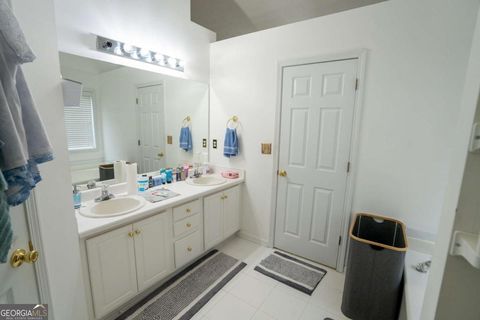
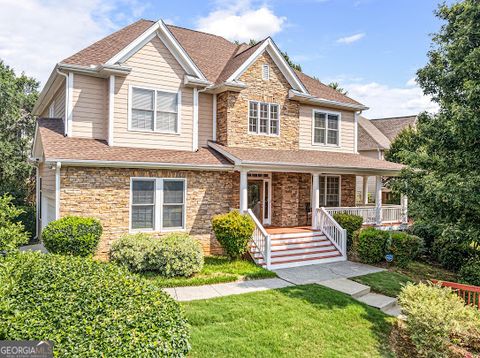
$599,000
4
bds
|
0
ba
|
0
sqft
|
built
2021
2247 Pink Hawthorn Dr, Buford, GA 30518
$-1,363
Cash flow
-11.9%
Cash-on-Cash Return
3.4%
Cap rate
0.5%
Rent to Value Ratio
Active
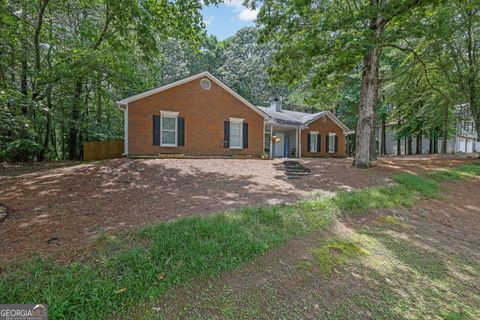
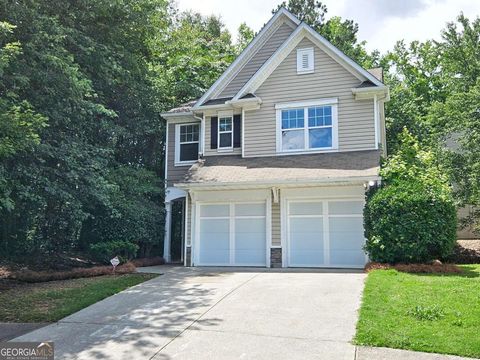
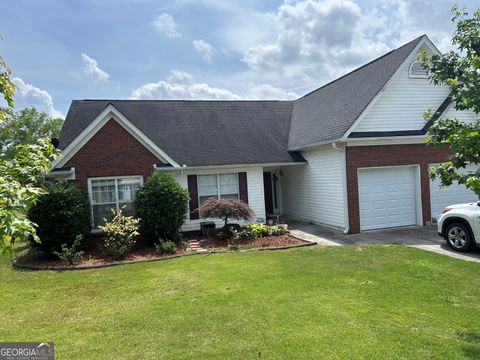
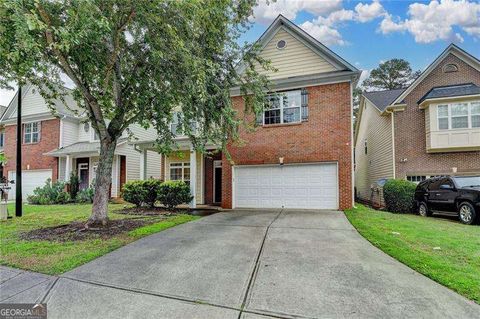
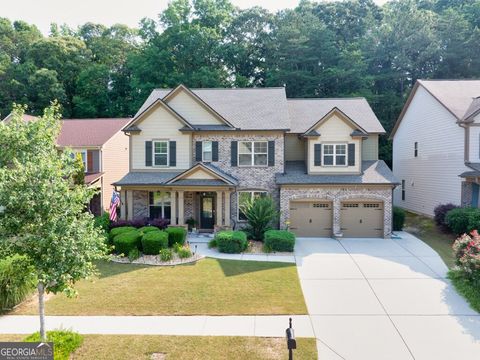
$390,000
3
bds
|
0
ba
|
1,665
sqft
|
built
1991
4180 Gables Pl, Buford, GA 30519
$-889
Cash flow
-11.9%
Cash-on-Cash Return
3.5%
Cap rate
0.6%
Rent to Value Ratio
Active
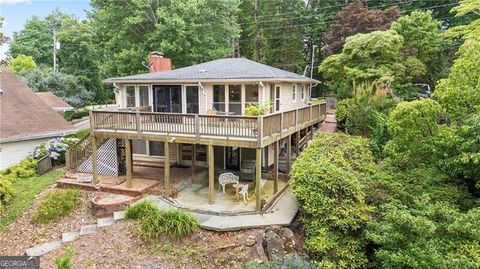
$839,900
2
bds
|
0
ba
|
1,700
sqft
|
built
1960
6381 Lakeview Dr, Buford, GA 30518
$-2,934
Cash flow
-18.2%
Cash-on-Cash Return
2.1%
Cap rate
0.3%
Rent to Value Ratio
Active
$524,900
4
bds
|
0
ba
|
2,797
sqft
|
built
1994
5820 Elm Tree Dr, Buford, GA 30518
$-1,201
Cash flow
-11.9%
Cash-on-Cash Return
3.5%
Cap rate
0.4%
Rent to Value Ratio
Active
$849,999
5
bds
|
0
ba
|
5,222
sqft
|
built
2014
6248 Sunshine Cove Ln, Buford, GA 30518
$-2,489
Cash flow
-15.3%
Cash-on-Cash Return
2.8%
Cap rate
0.5%
Rent to Value Ratio
Active
$524,900
5
bds
|
0
ba
|
2,885
sqft
|
built
2001
2540 Ridgehurst Dr, Buford, GA 30518
$-1,138
Cash flow
-11.3%
Cash-on-Cash Return
3.7%
Cap rate
0.6%
Rent to Value Ratio
Active
$635,000
4
bds
|
0
ba
|
2,620
sqft
|
built
2021
2090 Harvester Ln, Buford, GA 30518
$-1,331
Cash flow
-10.9%
Cash-on-Cash Return
3.6%
Cap rate
0.5%
Rent to Value Ratio
Active
$749,900
4
bds
|
0
ba
|
3,678
sqft
|
built
2002
3468 Aberrone Pl, Buford, GA 30519
$-2,223
Cash flow
-15.5%
Cash-on-Cash Return
2.6%
Cap rate
0.4%
Rent to Value Ratio
Active
$415,000
4
bds
|
0
ba
|
0
sqft
|
built
2015
3280 Hallmark Ln, Buford, GA 30519
$-1,143
Cash flow
-14.4%
Cash-on-Cash Return
2.8%
Cap rate
0.6%
Rent to Value Ratio
Active
$779,000
4
bds
|
4
ba
|
4,567
sqft
|
built
2018
4831 Miller Hill Rd, Buford, GA 30518
$-1,717
Cash flow
-11.5%
Cash-on-Cash Return
3.5%
Cap rate
0.5%
Rent to Value Ratio
Active
$399,990
4
bds
|
0
ba
|
1,969
sqft
|
built
2005
1346 Upshur Pl, Buford, GA 30519
$-1,011
Cash flow
-13.2%
Cash-on-Cash Return
3.2%
Cap rate
0.6%
Rent to Value Ratio
Active
$489,000
3
bds
|
0
ba
|
2,757
sqft
|
built
2008
6131 Sparkling Cove Ln, Buford, GA 30518
$-1,124
Cash flow
-12.0%
Cash-on-Cash Return
3.4%
Cap rate
0.5%
Rent to Value Ratio

Active
$1,350,000
5
bds
|
0
ba
|
4,825
sqft
|
built
2013
120 Slate Dr, Buford, GA 30518
$-4,449
Cash flow
-17.2%
Cash-on-Cash Return
2.2%
Cap rate
0.3%
Rent to Value Ratio
Active
$422,000
3
bds
|
0
ba
|
0
sqft
|
built
1992
3227 Ivy Lake Ct, Buford, GA 30519
$-1,312
Cash flow
-16.2%
Cash-on-Cash Return
2.4%
Cap rate
0.5%
Rent to Value Ratio

Active
$515,000
3
bds
|
0
ba
|
2,080
sqft
|
built
2004
554 Grand Ashbury Ln, Buford, GA 30518
$-1,069
Cash flow
-10.8%
Cash-on-Cash Return
3.7%
Cap rate
0.5%
Rent to Value Ratio
Active
$535,000
5
bds
|
0
ba
|
3,267
sqft
|
built
2017
3291 Meadow Lily Ct, Buford, GA 30519
$-1,466
Cash flow
-14.3%
Cash-on-Cash Return
2.9%
Cap rate
0.5%
Rent to Value Ratio
Active
$1,890,000
4
bds
|
5
ba
|
3,978
sqft
|
built
1988
6313 Shoreland Cir, Buford, GA 30518
$-6,321
Cash flow
-17.4%
Cash-on-Cash Return
2.1%
Cap rate
0.3%
Rent to Value Ratio
Active
$699,000
3
bds
|
0
ba
|
3,520
sqft
|
built
2005
2727 Bearcreek Pl, Buford, GA 30519
$-1,902
Cash flow
-14.2%
Cash-on-Cash Return
2.9%
Cap rate
0.4%
Rent to Value Ratio
Active
$525,000
3
bds
|
0
ba
|
1,248
sqft
|
built
1957
1179 Chatham Rd, Buford, GA 30518
$-1,620
Cash flow
-16.1%
Cash-on-Cash Return
2.4%
Cap rate
0.4%
Rent to Value Ratio

Active
$499,900
3
bds
|
4
ba
|
2,484
sqft
|
built
1986
2011 Sturbridge Ln, Buford, GA 30519
$-1,180
Cash flow
-12.3%
Cash-on-Cash Return
3.3%
Cap rate
0.5%
Rent to Value Ratio
Active
$694,900
6
bds
|
5
ba
|
0
sqft
|
built
1993
2505 Ridgehurst Dr, Buford, GA 30518
$-1,676
Cash flow
-12.6%
Cash-on-Cash Return
3.3%
Cap rate
0.5%
Rent to Value Ratio
Active
$399,000
3
bds
|
0
ba
|
2,126
sqft
|
built
1998
2256 Hansford Pass, Buford, GA 30519
$-923
Cash flow
-12.1%
Cash-on-Cash Return
3.4%
Cap rate
0.6%
Rent to Value Ratio
Active
$485,000
4
bds
|
0
ba
|
0
sqft
|
built
1999
5036 Weatherstone Dr, Buford, GA 30519
$-1,276
Cash flow
-13.7%
Cash-on-Cash Return
3.0%
Cap rate
0.5%
Rent to Value Ratio
Active
$649,999
5
bds
|
0
ba
|
2,966
sqft
|
built
1972
6142 Hutchins Dr, Buford, GA 30518
$-2,046
Cash flow
-16.4%
Cash-on-Cash Return
2.4%
Cap rate
0.3%
Rent to Value Ratio
Active
$407,000
3
bds
|
0
ba
|
1,918
sqft
|
built
2001
2840 General Lee Way, Buford, GA 30519
$-805
Cash flow
-10.3%
Cash-on-Cash Return
3.8%
Cap rate
0.6%
Rent to Value Ratio

Active
$625,000
4
bds
|
0
ba
|
3,000
sqft
|
built
2019
2649 Ogden Trl, Buford, GA 30519
$-1,847
Cash flow
-15.4%
Cash-on-Cash Return
2.6%
Cap rate
0.5%
Rent to Value Ratio
Active
$459,900
4
bds
|
0
ba
|
0
sqft
|
built
2008
2280 Copper Trail Ln, Buford, GA 30519
$-1,170
Cash flow
-13.3%
Cash-on-Cash Return
3.1%
Cap rate
0.5%
Rent to Value Ratio
Active
$585,000
5
bds
|
0
ba
|
4,070
sqft
|
built
1996
3648 Clark Hill Way, Buford, GA 30519
$-1,262
Cash flow
-11.3%
Cash-on-Cash Return
3.6%
Cap rate
0.5%
Rent to Value Ratio
Active
$479,900
5
bds
|
0
ba
|
0
sqft
|
built
2014
3522 Fallen Oak Dr, Buford, GA 30519
$-1,233
Cash flow
-13.4%
Cash-on-Cash Return
3.1%
Cap rate
0.5%
Rent to Value Ratio
Active
$1,245,000
5
bds
|
0
ba
|
0
sqft
|
built
2016
3111 Old Thompson Mill Rd, Buford, GA 30519
$-2,746
Cash flow
-11.5%
Cash-on-Cash Return
3.5%
Cap rate
0.5%
Rent to Value Ratio
Active
$595,000
5
bds
|
0
ba
|
3,706
sqft
|
built
1994
2722 Brookhaven Ln, Buford, GA 30518
$-1,469
Cash flow
-12.9%
Cash-on-Cash Return
3.2%
Cap rate
0.5%
Rent to Value Ratio
Active
$557,000
4
bds
|
0
ba
|
2,634
sqft
|
built
2017
1998 Lakeview Bend Way, Buford, GA 30519
$-1,379
Cash flow
-12.9%
Cash-on-Cash Return
3.2%
Cap rate
0.6%
Rent to Value Ratio
Active
$599,500
5
bds
|
0
ba
|
3,467
sqft
|
built
2000
2810 Promenade Pl, Buford, GA 30519
$-1,681
Cash flow
-14.6%
Cash-on-Cash Return
2.8%
Cap rate
0.5%
Rent to Value Ratio
Active
$445,000
5
bds
|
0
ba
|
2,378
sqft
|
built
2014
4546 Water Mill Dr, Buford, GA 30519
$-1,060
Cash flow
-12.4%
Cash-on-Cash Return
3.3%
Cap rate
0.6%
Rent to Value Ratio
Active
$524,880
5
bds
|
0
ba
|
2,906
sqft
|
built
2013
2525 Well Springs Dr, Buford, GA 30519
$-1,291
Cash flow
-12.8%
Cash-on-Cash Return
3.2%
Cap rate
0.5%
Rent to Value Ratio

Active
$450,000
2
bds
|
0
ba
|
0
sqft
|
built
1950
575 E Main St, Buford, GA 30518
$-1,181
Cash flow
-13.7%
Cash-on-Cash Return
3.0%
Cap rate
0.4%
Rent to Value Ratio
Active
$788,000
4
bds
|
3
ba
|
2,965
sqft
|
built
2020
4933 Greenard Watson Ln, Buford, GA 30518
$-2,614
Cash flow
-17.3%
Cash-on-Cash Return
2.2%
Cap rate
0.4%
Rent to Value Ratio
Active
$499,999
4
bds
|
4
ba
|
0
sqft
|
built
2018
3305 Morgan Rd, Buford, GA 30519
$-824
Cash flow
-8.6%
Cash-on-Cash Return
4.2%
Cap rate
0.6%
Rent to Value Ratio