Alameda County Investment Properties for Sale
Browse homes for sale and investment properties in Alameda County. Refine your search by price, property type, or more.
Best cash flowing properties in Alameda County
Active
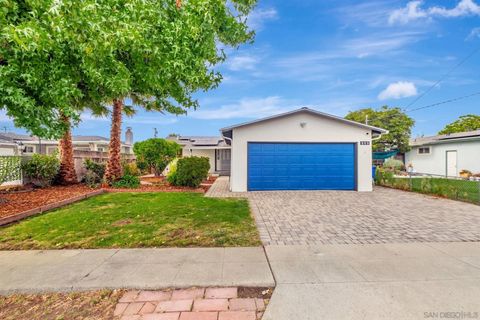
$400,000
3
bds
|
2
ba
|
1,325
sqft
|
built
2007
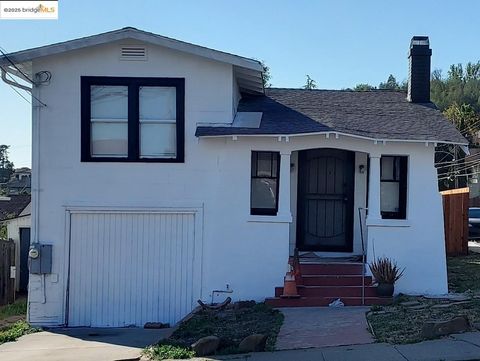
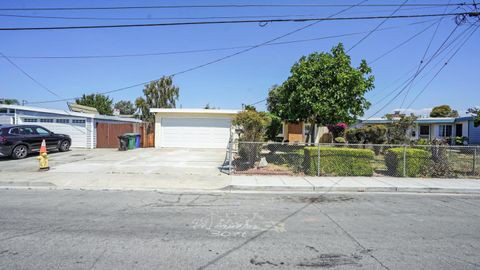
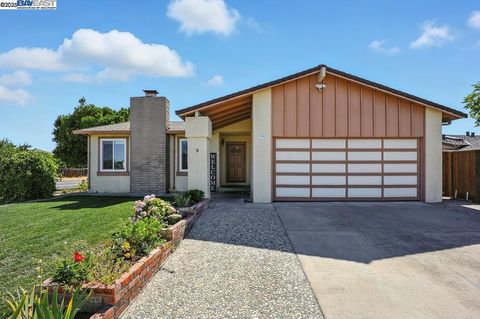
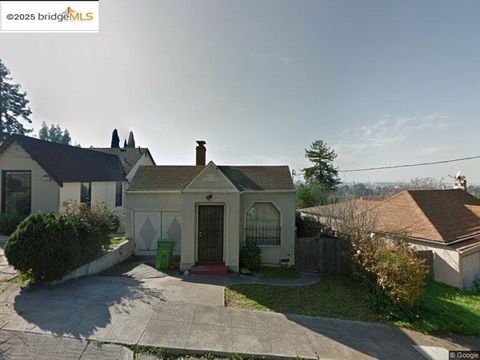
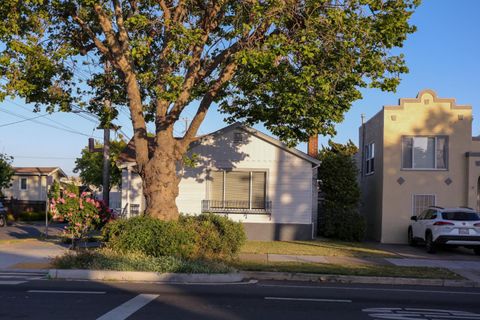
1615 167th Ave, San Leandro, CA 94578
$392
Cash flow
5.1%
Cash-on-Cash Return
7.2%
Cap rate
0.9%
Rent to Value Ratio
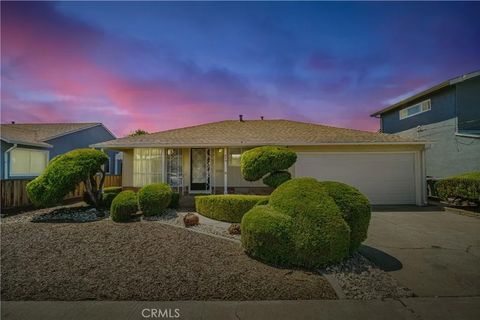
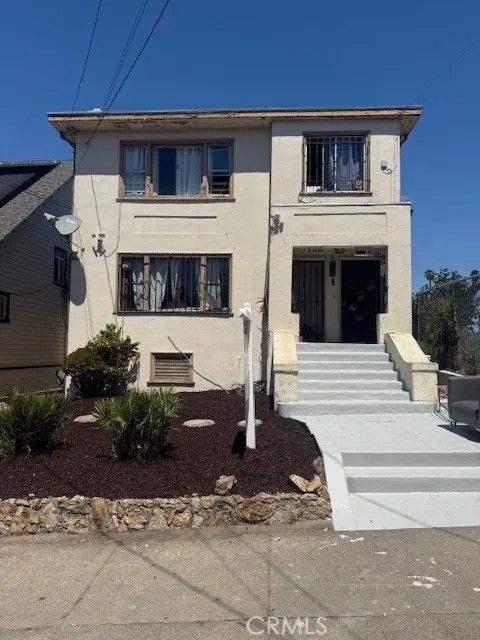
Active
$449,000
2
bds
|
1
ba
|
742
sqft
|
built
1910
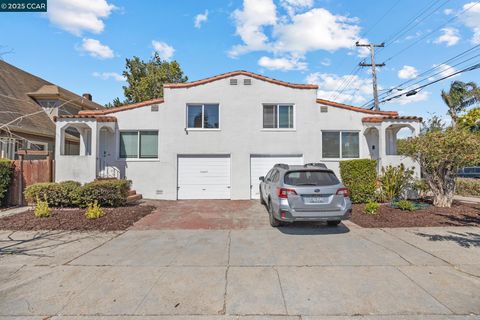
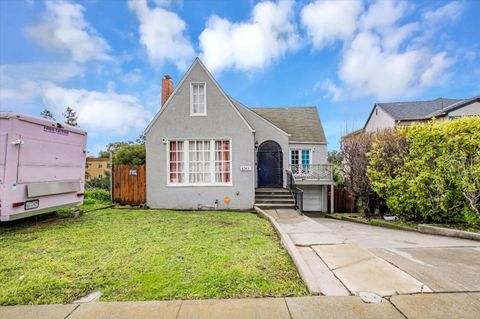
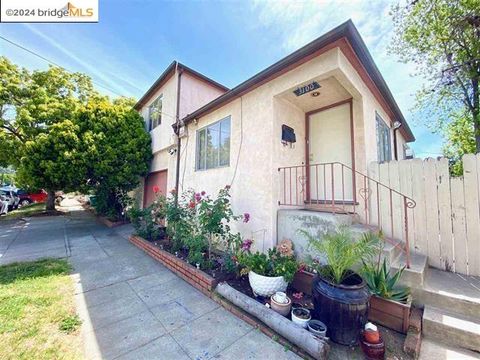
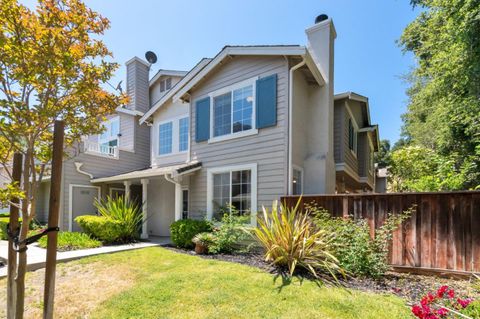
2645 23rd Ave, Oakland, CA 94606
$-338
Cash flow
-3.9%
Cash-on-Cash Return
5.2%
Cap rate
0.6%
Rent to Value Ratio
206 out of 1,227 properties for sale in Alameda County
Limited Results Shown
Create a free account, or log in to reveal all property listings and enjoy the complete experience.
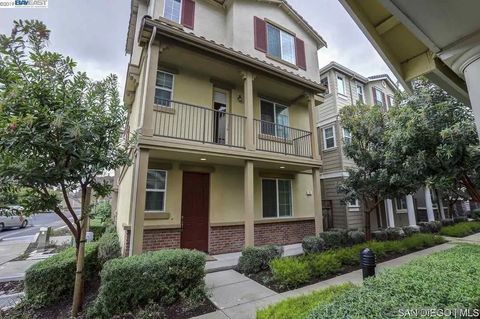
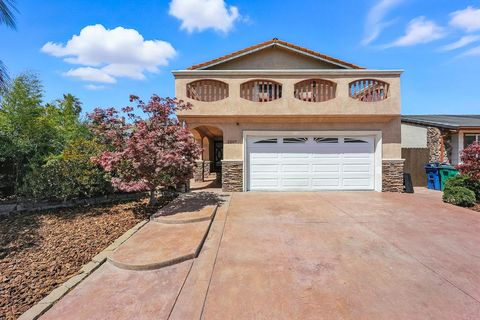
Active
$959,888
3
bds
|
2
ba
|
1,180
sqft
|
built
1955
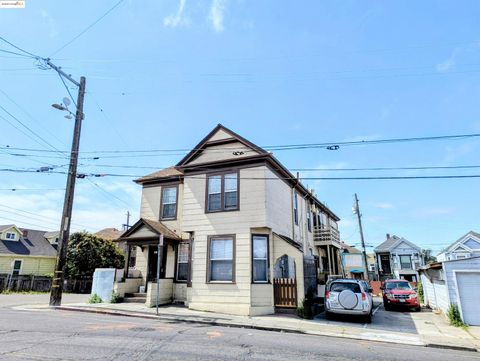
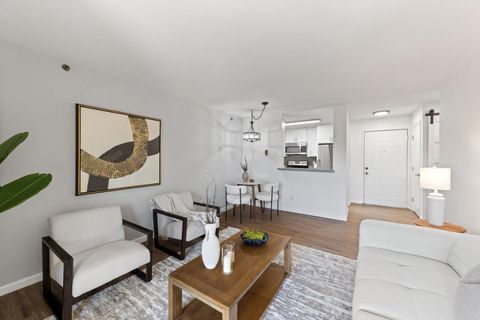
669 Minerva St, Hayward, CA 94544
$-1,749
Cash flow
-9.5%
Cash-on-Cash Return
3.9%
Cap rate
0.5%
Rent to Value Ratio
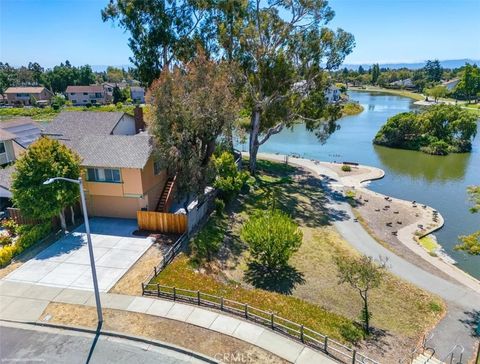
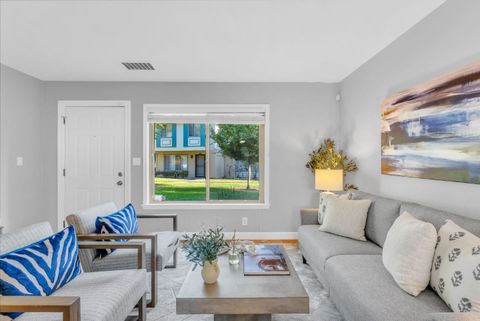
Active
$839,888
3
bds
|
1
ba
|
1,417
sqft
|
built
1954
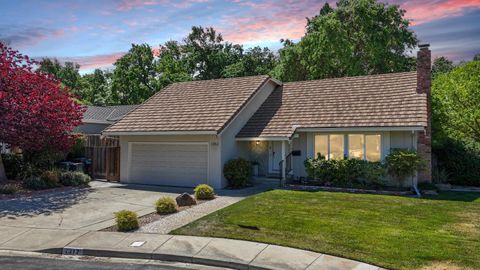
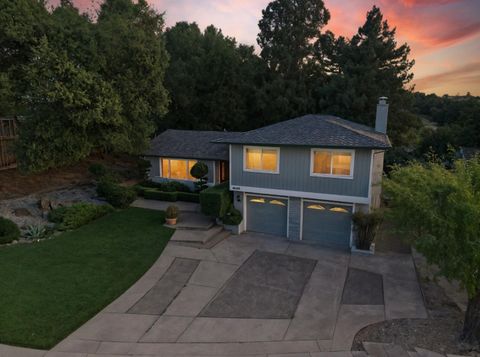
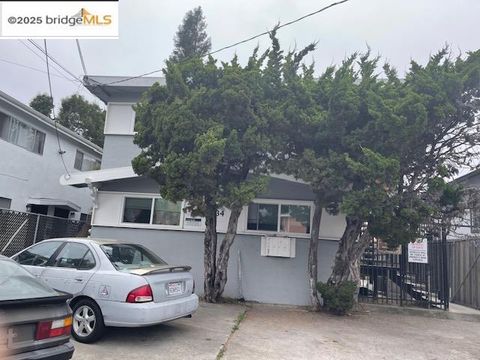
849 Serra Dr, San Leandro, CA 94578
$-2,039
Cash flow
-12.7%
Cash-on-Cash Return
3.2%
Cap rate
0.4%
Rent to Value Ratio
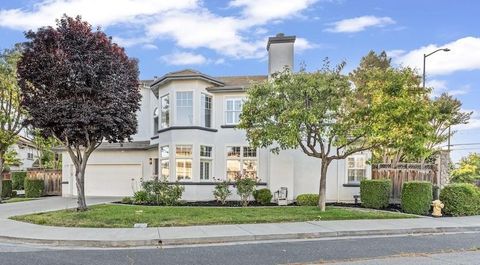
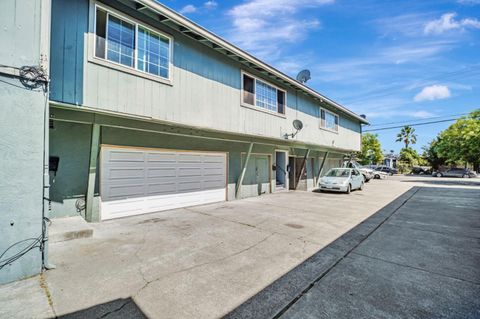
Active
$1,150,000
4
bds
|
4
ba
|
2,043
sqft
|
built
2015
75 Middleton Pl, Hayward, CA 94544
$-3,048
Cash flow
-13.8%
Cash-on-Cash Return
2.9%
Cap rate
0.4%
Rent to Value Ratio
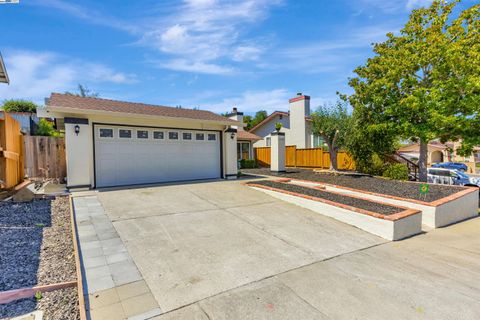
Active
$1,725,000
4
bds
|
4
ba
|
2,144
sqft
|
built
1971
35605 Scarborough Dr, Newark, CA 94560
$-5,273
Cash flow
-15.9%
Cash-on-Cash Return
2.4%
Cap rate
0.3%
Rent to Value Ratio
Active
$649,000
3
bds
|
2
ba
|
0
sqft
|
built
1922
2445 10th Ave, Oakland, CA 94606
$-1,074
Cash flow
-8.6%
Cash-on-Cash Return
4.1%
Cap rate
0.5%
Rent to Value Ratio
Active
$1,799,000
4
bds
|
3
ba
|
2,240
sqft
|
built
1994
38101 Cambridge Ct, Fremont, CA 94536
$-5,578
Cash flow
-16.2%
Cash-on-Cash Return
2.3%
Cap rate
0.3%
Rent to Value Ratio
Active
$1,501,000
4
bds
|
4
ba
|
2,402
sqft
|
built
2019
29356 Taylor Ave, Hayward, CA 94544
$-3,726
Cash flow
-13.0%
Cash-on-Cash Return
3.1%
Cap rate
0.4%
Rent to Value Ratio
Active
$745,000
3
bds
|
3
ba
|
1,516
sqft
|
built
2013
1202 Martin Luther King Dr, Hayward, CA 94541
$-1,378
Cash flow
-9.7%
Cash-on-Cash Return
3.8%
Cap rate
0.5%
Rent to Value Ratio
Active
$898,000
4
bds
|
0
ba
|
2,173
sqft
|
built
1914
473 Newton Ave, Oakland, CA 94606
$-2,126
Cash flow
-12.4%
Cash-on-Cash Return
3.2%
Cap rate
0.4%
Rent to Value Ratio
Active
$500,000
2
bds
|
0
ba
|
2,016
sqft
|
built
1925
1423 73rd Ave, Oakland, CA 94621
$-1,010
Cash flow
-10.5%
Cash-on-Cash Return
3.6%
Cap rate
0.4%
Rent to Value Ratio
Active
$598,800
3
bds
|
2
ba
|
1,193
sqft
|
built
1931
3265 Nicol Ave, Oakland, CA 94602
$-544
Cash flow
-4.7%
Cash-on-Cash Return
5.0%
Cap rate
0.6%
Rent to Value Ratio
Active
$499,000
2
bds
|
2
ba
|
1,252
sqft
|
built
2005
3090 Glascock St, Oakland, CA 94601
$-955
Cash flow
-10.0%
Cash-on-Cash Return
3.8%
Cap rate
0.6%
Rent to Value Ratio
Active
$1,049,888
3
bds
|
2
ba
|
1,242
sqft
|
built
1970
42930 Corte Habana, Fremont, CA 94539
$-3,008
Cash flow
-14.9%
Cash-on-Cash Return
2.6%
Cap rate
0.4%
Rent to Value Ratio
Active
$849,000
2
bds
|
2
ba
|
1,168
sqft
|
built
1987
874 Cherry Glen Cir, Fremont, CA 94536
$-2,393
Cash flow
-14.7%
Cash-on-Cash Return
2.7%
Cap rate
0.4%
Rent to Value Ratio
Active
$510,000
2
bds
|
1
ba
|
1,023
sqft
|
built
1927
2957 73rd Ave, Oakland, CA 94605
$-647
Cash flow
-6.6%
Cash-on-Cash Return
4.5%
Cap rate
0.5%
Rent to Value Ratio
Active
$1,559,100
5
bds
|
3
ba
|
2,417
sqft
|
built
1970
1312 Vintner Way, Pleasanton, CA 94566
$-4,365
Cash flow
-14.6%
Cash-on-Cash Return
2.7%
Cap rate
0.3%
Rent to Value Ratio
Active
$749,000
5
bds
|
0
ba
|
2,226
sqft
|
built
1876
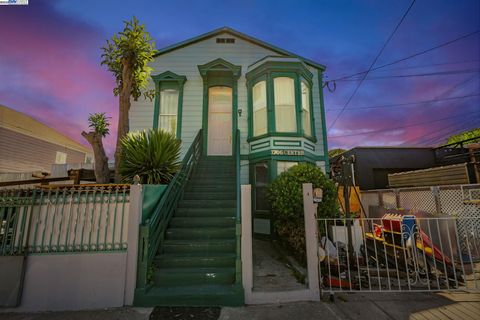
1706 Center St, Oakland, CA 94607
$-2,062
Cash flow
-14.4%
Cash-on-Cash Return
2.8%
Cap rate
0.3%
Rent to Value Ratio
Active
$997,000
3
bds
|
0
ba
|
2,057
sqft
|
built
1951
3038 Shattuck Ave, Berkeley, CA 94705
$-2,005
Cash flow
-10.5%
Cash-on-Cash Return
3.7%
Cap rate
0.4%
Rent to Value Ratio
Active
$1,199,999
4
bds
|
3
ba
|
1,852
sqft
|
built
1974
2507 Constellation Dr, Hayward, CA 94545
$-3,032
Cash flow
-13.2%
Cash-on-Cash Return
3.0%
Cap rate
0.4%
Rent to Value Ratio
Active
$578,000
2
bds
|
2
ba
|
988
sqft
|
built
1970
27459 Ponderosa Ct, Hayward, CA 94545
$-1,266
Cash flow
-11.4%
Cash-on-Cash Return
3.4%
Cap rate
0.5%
Rent to Value Ratio
Active
$1,199,000
7
bds
|
0
ba
|
3,046
sqft
|
built
1975
188 Sunset Blvd, Hayward, CA 94541
$-3,924
Cash flow
-17.1%
Cash-on-Cash Return
2.1%
Cap rate
0.3%
Rent to Value Ratio
Active
$899,999
3
bds
|
2
ba
|
1,280
sqft
|
built
1979
22561 Mossy Rock Dr, Hayward, CA 94541
$-1,860
Cash flow
-10.8%
Cash-on-Cash Return
3.6%
Cap rate
0.4%
Rent to Value Ratio
Active
$1,645,888
4
bds
|
3
ba
|
2,538
sqft
|
built
1978
5529 Feather Ct, Castro Valley, CA 94552
$-4,459
Cash flow
-14.1%
Cash-on-Cash Return
2.8%
Cap rate
0.3%
Rent to Value Ratio
Active
$968,888
3
bds
|
2
ba
|
1,190
sqft
|
built
1954
36720 Charles St, Newark, CA 94560
$-2,208
Cash flow
-11.9%
Cash-on-Cash Return
3.3%
Cap rate
0.4%
Rent to Value Ratio
Active
$569,500
2
bds
|
2
ba
|
996
sqft
|
built
1927
3939 Edgemoor Pl, Oakland, CA 94605
$-948
Cash flow
-8.7%
Cash-on-Cash Return
4.1%
Cap rate
0.5%
Rent to Value Ratio

Active
$1,295,000
8
bds
|
0
ba
|
3,296
sqft
|
built
1958
5664 Gaskill St, Oakland, CA 94608
$-4,409
Cash flow
-17.8%
Cash-on-Cash Return
2.0%
Cap rate
0.2%
Rent to Value Ratio
Active
$768,000
4
bds
|
2
ba
|
1,342
sqft
|
built
1972
4210 Comet Cir, Union City, CA 94587
$-2,032
Cash flow
-13.8%
Cash-on-Cash Return
2.9%
Cap rate
0.4%
Rent to Value Ratio
Active
$1,299,888
4
bds
|
2
ba
|
1,544
sqft
|
built
1973
2702 Chinook Ct, Union City, CA 94587
$-3,537
Cash flow
-14.2%
Cash-on-Cash Return
2.8%
Cap rate
0.3%
Rent to Value Ratio
Active
$849,000
3
bds
|
1
ba
|
1,117
sqft
|
built
1961
3263 Kelly St, Hayward, CA 94541
$-1,602
Cash flow
-9.8%
Cash-on-Cash Return
3.8%
Cap rate
0.5%
Rent to Value Ratio
Active
$1,100,000
4
bds
|
4
ba
|
1,967
sqft
|
built
2019
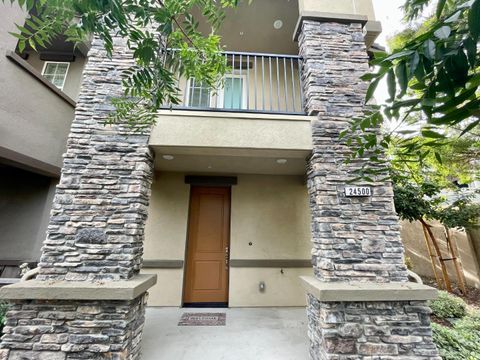
24500 Autumn Mist Way, Hayward, CA 94544
$-2,603
Cash flow
-12.3%
Cash-on-Cash Return
3.2%
Cap rate
0.4%
Rent to Value Ratio
Active
$950,000
5
bds
|
3
ba
|
3,000
sqft
|
built
1955
8245 Golf Links Rd, Oakland, CA 94605
$-1,354
Cash flow
-7.4%
Cash-on-Cash Return
4.4%
Cap rate
0.5%
Rent to Value Ratio
Active
$519,000
2
bds
|
1
ba
|
969
sqft
|
built
1928
3000 Partridge Ave, Oakland, CA 94605
$-416
Cash flow
-4.2%
Cash-on-Cash Return
5.1%
Cap rate
0.6%
Rent to Value Ratio
Active
$600,000
4
bds
|
0
ba
|
2,785
sqft
|
built
1961
3104 60th Ave, Oakland, CA 94605
$-1,309
Cash flow
-11.4%
Cash-on-Cash Return
3.5%
Cap rate
0.4%
Rent to Value Ratio
Active
$825,000
8
bds
|
0
ba
|
3,537
sqft
|
built
1900
1607 Miller Ave, Oakland, CA 94601
$-1,757
Cash flow
-11.1%
Cash-on-Cash Return
3.5%
Cap rate
0.4%
Rent to Value Ratio
Active
$995,000
8
bds
|
0
ba
|
3,200
sqft
|
built
1965
3234 E 27th St, Oakland, CA 94601
$-3,168
Cash flow
-16.6%
Cash-on-Cash Return
2.2%
Cap rate
0.3%
Rent to Value Ratio
Active
$645,000
3
bds
|
2
ba
|
1,217
sqft
|
built
1939
2570 Havenscourt Blvd, Oakland, CA 94605
$-1,053
Cash flow
-8.5%
Cash-on-Cash Return
4.1%
Cap rate
0.5%
Rent to Value Ratio
Active
$998,000
3
bds
|
3
ba
|
1,520
sqft
|
built
1996
7445 Brigadoon Way, Dublin, CA 94568
$-2,855
Cash flow
-14.9%
Cash-on-Cash Return
2.6%
Cap rate
0.4%
Rent to Value Ratio
Active
$419,000
1
bds
|
1
ba
|
644
sqft
|
built
1988
685 Dartmore Ln, Hayward, CA 94544
$-1,088
Cash flow
-13.5%
Cash-on-Cash Return
3.0%
Cap rate
0.5%
Rent to Value Ratio