Alameda County Investment Properties for Sale
Browse homes for sale and investment properties in Alameda County. Refine your search by price, property type, or more.
Best cash flowing properties in Alameda County
Active
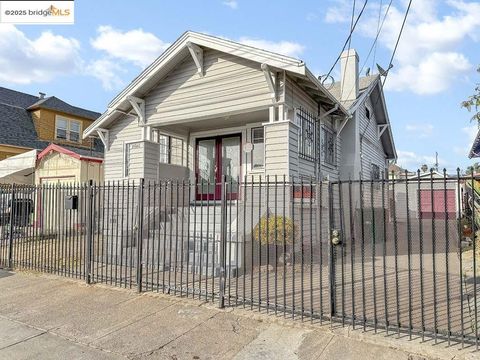
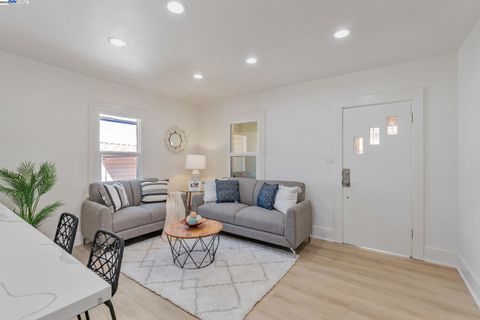
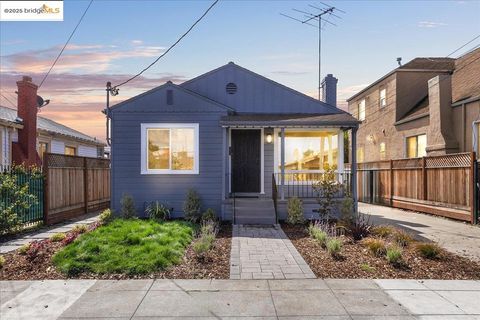
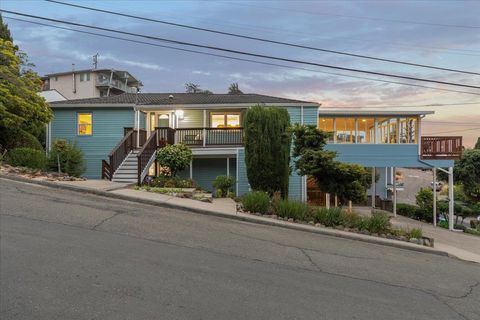
$565,000
3
bds
|
2
ba
|
1,239
sqft
|
built
1920
5540 E 17th St, Oakland, CA 94621
$-742
Cash flow
-6.9%
Cash-on-Cash Return
4.7%
Cap rate
0.6%
Rent to Value Ratio

Active
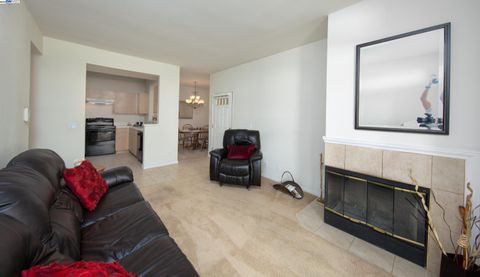
$449,000
2
bds
|
1
ba
|
1,013
sqft
|
built
1972
127 Bayo Vista Ave, Oakland, CA 94611
$-1,016
Cash flow
-11.8%
Cash-on-Cash Return
3.5%
Cap rate
0.7%
Rent to Value Ratio
397 out of 2,186 properties for sale in Alameda County
Limited Results Shown
Create a free account, or log in to reveal all property listings and enjoy the complete experience.
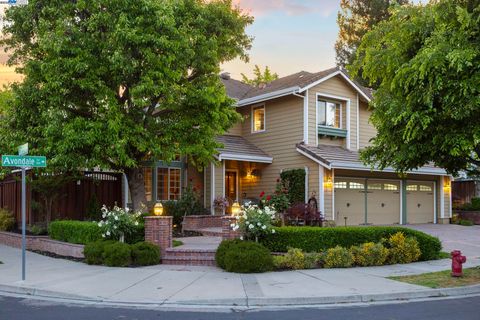
Active
$1,825,000
4
bds
|
4
ba
|
3,116
sqft
|
built
1992
304 Avondale Ln, Livermore, CA 94551
$-5,733
Cash flow
-16.4%
Cash-on-Cash Return
2.5%
Cap rate
0.3%
Rent to Value Ratio

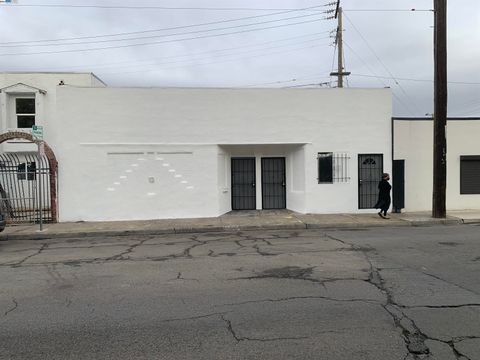
Active
$899,000
9
bds
|
0
ba
|
4,113
sqft
|
built
1963
4546 San Carlos Ave, Oakland, CA 94601
$-3,382
Cash flow
-19.6%
Cash-on-Cash Return
1.7%
Cap rate
0.2%
Rent to Value Ratio
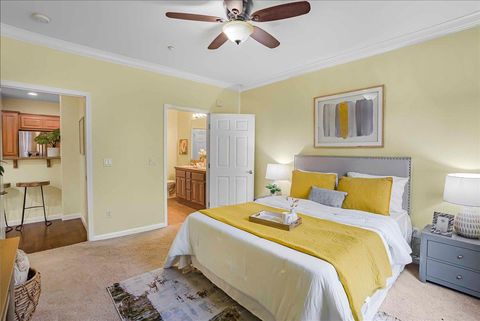
Active
$548,000
2
bds
|
1
ba
|
897
sqft
|
built
1908
2720 Short St, Oakland, CA 94619
$-1,067
Cash flow
-10.2%
Cash-on-Cash Return
3.9%
Cap rate
0.5%
Rent to Value Ratio
Active
$1,429,000
3
bds
|
2
ba
|
1,269
sqft
|
built
1961
4510 Calaveras Ave, Fremont, CA 94538
$-4,700
Cash flow
-17.2%
Cash-on-Cash Return
2.3%
Cap rate
0.3%
Rent to Value Ratio

Active
$499,888
2
bds
|
2
ba
|
1,007
sqft
|
built
1989
1234 Stanhope Ln, Hayward, CA 94545
$-1,099
Cash flow
-11.5%
Cash-on-Cash Return
3.6%
Cap rate
0.6%
Rent to Value Ratio

Active
$549,000
4
bds
|
0
ba
|
1,140
sqft
|
built
1950
4028 E 18th St, Oakland, CA 94601
$-1,348
Cash flow
-12.8%
Cash-on-Cash Return
3.3%
Cap rate
0.4%
Rent to Value Ratio

Active
$698,000
2
bds
|
2
ba
|
1,448
sqft
|
built
1984
39903 Parada St, Newark, CA 94560
$-1,695
Cash flow
-12.7%
Cash-on-Cash Return
3.4%
Cap rate
0.5%
Rent to Value Ratio

Active
$533,000
2
bds
|
2
ba
|
906
sqft
|
built
1988
665 Dartmore Ln, Hayward, CA 94544
$-1,432
Cash flow
-14.0%
Cash-on-Cash Return
3.0%
Cap rate
0.5%
Rent to Value Ratio

Active
$868,888
3
bds
|
1
ba
|
1,221
sqft
|
built
1951
32027 Carroll Ave, Hayward, CA 94544
$-1,776
Cash flow
-10.7%
Cash-on-Cash Return
3.8%
Cap rate
0.5%
Rent to Value Ratio
Active
$1,299,000
4
bds
|
4
ba
|
1,568
sqft
|
built
2007
40840 Townsend Ter, Fremont, CA 94538
$-3,743
Cash flow
-15.0%
Cash-on-Cash Return
2.8%
Cap rate
0.4%
Rent to Value Ratio
Active
$449,000
2
bds
|
1
ba
|
1,013
sqft
|
built
1972
127 Bayo Vista Ave, Oakland, CA 94611
$-1,016
Cash flow
-11.8%
Cash-on-Cash Return
3.5%
Cap rate
0.7%
Rent to Value Ratio
Active
$12,499,000
4
bds
|
4
ba
|
4,242
sqft
|
built
1974
6033 Dagnino Rd, Livermore, CA 94551
$-60,907
Cash flow
-25.4%
Cash-on-Cash Return
0.4%
Cap rate
0.1%
Rent to Value Ratio
Active
$899,000
3
bds
|
3
ba
|
2,119
sqft
|
built
2017
1633 15th St, Oakland, CA 94607
$-1,588
Cash flow
-9.2%
Cash-on-Cash Return
4.1%
Cap rate
0.5%
Rent to Value Ratio
Active
$1,680,000
4
bds
|
3
ba
|
1,942
sqft
|
built
1970
1347 Vintner Way, Pleasanton, CA 94566
$-4,907
Cash flow
-15.2%
Cash-on-Cash Return
2.8%
Cap rate
0.3%
Rent to Value Ratio
Active
$779,000
4
bds
|
0
ba
|
1,555
sqft
|
built
1939
2224 107th Ave, Oakland, CA 94603
$-1,928
Cash flow
-12.9%
Cash-on-Cash Return
3.3%
Cap rate
0.4%
Rent to Value Ratio
Active
$1,110,000
3
bds
|
2
ba
|
1,479
sqft
|
built
2021
45049 Challenge Cmn, Fremont, CA 94538
$-3,535
Cash flow
-16.6%
Cash-on-Cash Return
2.4%
Cap rate
0.4%
Rent to Value Ratio
Active
$1,898,000
4
bds
|
3
ba
|
3,058
sqft
|
built
1987
6318 Boone Dr, Castro Valley, CA 94552
$-6,052
Cash flow
-16.6%
Cash-on-Cash Return
2.4%
Cap rate
0.3%
Rent to Value Ratio
Active
$949,999
4
bds
|
2
ba
|
1,767
sqft
|
built
1947
22075 Baywood Ave, Castro Valley, CA 94546
$-2,200
Cash flow
-12.1%
Cash-on-Cash Return
3.5%
Cap rate
0.4%
Rent to Value Ratio
Active
$1,428,000
3
bds
|
3
ba
|
2,169
sqft
|
built
2021
45139 Challenge Cmn, Fremont, CA 94538
$-4,350
Cash flow
-15.9%
Cash-on-Cash Return
2.6%
Cap rate
0.3%
Rent to Value Ratio
Active
$1,098,000
2
bds
|
2
ba
|
1,405
sqft
|
built
1984
4160 Tanager Cmn, Fremont, CA 94555
$-3,272
Cash flow
-15.5%
Cash-on-Cash Return
2.7%
Cap rate
0.4%
Rent to Value Ratio
Active
$790,000
3
bds
|
3
ba
|
1,378
sqft
|
built
1921
3036 23rd Ave, Oakland, CA 94602
$-1,088
Cash flow
-7.2%
Cash-on-Cash Return
4.6%
Cap rate
0.6%
Rent to Value Ratio
Active
$1,090,000
4
bds
|
4
ba
|
1,829
sqft
|
built
2018
37634 Cape Cod Rd, Newark, CA 94560
$-2,684
Cash flow
-12.8%
Cash-on-Cash Return
3.3%
Cap rate
0.4%
Rent to Value Ratio
Active
$1,049,000
2
bds
|
3
ba
|
1,326
sqft
|
built
2017
3858 Development Ter, Fremont, CA 94538
$-2,495
Cash flow
-12.4%
Cash-on-Cash Return
3.4%
Cap rate
0.5%
Rent to Value Ratio
Active
$998,000
2
bds
|
2
ba
|
979
sqft
|
built
1905
1834 8th St, Alameda, CA 94501
$-2,519
Cash flow
-13.2%
Cash-on-Cash Return
3.2%
Cap rate
0.4%
Rent to Value Ratio
Active
$1,249,888
3
bds
|
3
ba
|
1,400
sqft
|
built
1982
34919 Oyster Bay Ter, Fremont, CA 94555
$-4,067
Cash flow
-17.0%
Cash-on-Cash Return
2.4%
Cap rate
0.3%
Rent to Value Ratio
Active
$640,000
2
bds
|
1
ba
|
768
sqft
|
built
1921
1225 Richard Pl, Hayward, CA 94541
$-1,340
Cash flow
-10.9%
Cash-on-Cash Return
3.8%
Cap rate
0.5%
Rent to Value Ratio
Active
$1,199,000
4
bds
|
3
ba
|
1,839
sqft
|
built
1950
2204 170th Ave, Castro Valley, CA 94546
$-3,569
Cash flow
-15.5%
Cash-on-Cash Return
2.7%
Cap rate
0.3%
Rent to Value Ratio
Active
$658,000
2
bds
|
2
ba
|
1,080
sqft
|
built
1992
7090 Dublin Meadows St, Dublin, CA 94568
$-1,668
Cash flow
-13.2%
Cash-on-Cash Return
3.2%
Cap rate
0.5%
Rent to Value Ratio
Active
$549,000
2
bds
|
0
ba
|
1,270
sqft
|
built
1956
11070 San Leandro St, Oakland, CA 94603
$-1,279
Cash flow
-12.2%
Cash-on-Cash Return
3.5%
Cap rate
0.4%
Rent to Value Ratio
Active
$678,000
2
bds
|
2
ba
|
1,066
sqft
|
built
2007
3465 Dublin Blvd, Dublin, CA 94568
$-1,773
Cash flow
-13.6%
Cash-on-Cash Return
3.1%
Cap rate
0.5%
Rent to Value Ratio

Active
$899,888
3
bds
|
3
ba
|
1,402
sqft
|
built
2015
1591 Glenn St, Hayward, CA 94545
$-2,484
Cash flow
-14.4%
Cash-on-Cash Return
3.0%
Cap rate
0.4%
Rent to Value Ratio

Active
$1,099,000
4
bds
|
0
ba
|
2,768
sqft
|
built
1920
3999 Clarke St, Oakland, CA 94609
$-2,978
Cash flow
-14.1%
Cash-on-Cash Return
3.0%
Cap rate
0.4%
Rent to Value Ratio
Active
$849,000
3
bds
|
2
ba
|
1,431
sqft
|
built
1938
3847 Fruitvale Ave, Oakland, CA 94602
$-1,672
Cash flow
-10.3%
Cash-on-Cash Return
3.9%
Cap rate
0.5%
Rent to Value Ratio
Active
$998,800
2
bds
|
2
ba
|
1,515
sqft
|
built
2021
183 Dora Falls Ter, Fremont, CA 94539
$-2,881
Cash flow
-15.0%
Cash-on-Cash Return
2.8%
Cap rate
0.4%
Rent to Value Ratio
Active
$565,000
3
bds
|
2
ba
|
1,239
sqft
|
built
1920
5540 E 17th St, Oakland, CA 94621
$-742
Cash flow
-6.9%
Cash-on-Cash Return
4.7%
Cap rate
0.6%
Rent to Value Ratio
Active
$798,000
2
bds
|
3
ba
|
1,213
sqft
|
built
1997
22938 Canyon Terrace Dr, Castro Valley, CA 94552
$-2,191
Cash flow
-14.3%
Cash-on-Cash Return
3.0%
Cap rate
0.5%
Rent to Value Ratio

Active
$1,170,000
6
bds
|
0
ba
|
4,698
sqft
|
built
1963
290 Park View Ter, Oakland, CA 94610
$-3,624
Cash flow
-16.2%
Cash-on-Cash Return
2.5%
Cap rate
0.3%
Rent to Value Ratio