San Francisco County Investment Properties for Sale
Browse homes for sale and investment properties in San Francisco County. Refine your search by price, property type, or more.
Best cash flowing properties in San Francisco County

Active
$338,689
1
bds
|
1
ba
|
630
sqft
|
built
2018
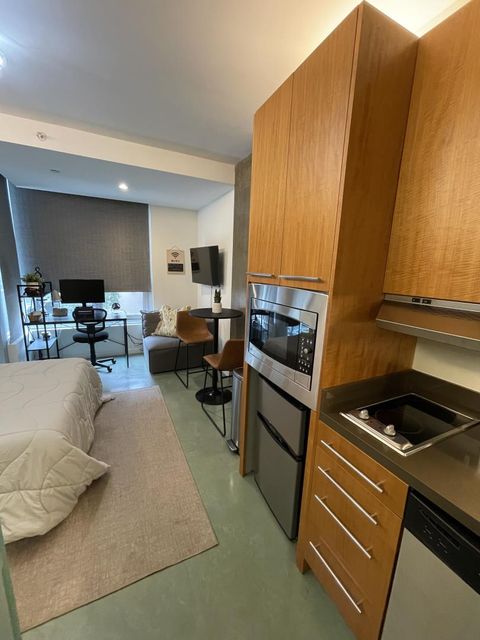
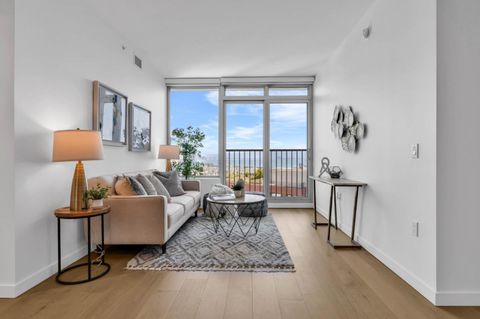
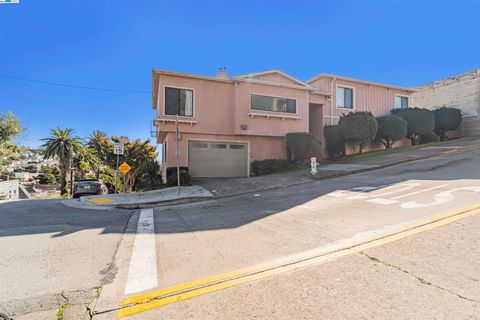
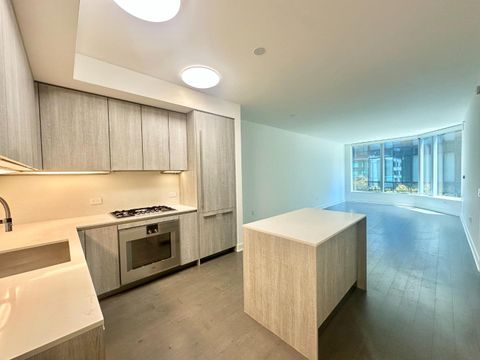
1075 Market St, San Francisco, CA 94103
$-383
Cash flow
-5.9%
Cash-on-Cash Return
4.7%
Cap rate
0.9%
Rent to Value Ratio
Active
$393,000
0
bds
|
1
ba
|
244
sqft
|
built
2008
766 Harrison St, San Francisco, CA 94107
$-466
Cash flow
-6.2%
Cash-on-Cash Return
4.6%
Cap rate
0.7%
Rent to Value Ratio
52 out of 117 properties for sale in San Francisco County
Limited Results Shown
Create a free account, or log in to reveal all property listings and enjoy the complete experience.
Active
$6,995,000
4
bds
|
4
ba
|
0
sqft
|
built
1965
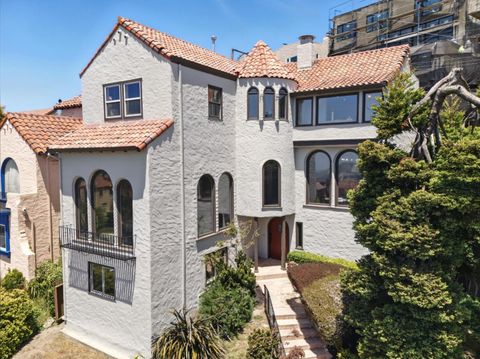
74 Crestline Dr, San Francisco, CA 94131
$-33,163
Cash flow
-24.7%
Cash-on-Cash Return
0.4%
Cap rate
0.0%
Rent to Value Ratio
Active
$1,398,000
2
bds
|
1
ba
|
1,800
sqft
|
built
1922
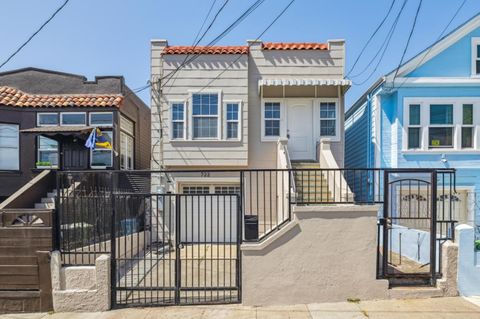
324 Holloway Ave, San Francisco, CA 94112
$-4,585
Cash flow
-17.1%
Cash-on-Cash Return
2.1%
Cap rate
0.3%
Rent to Value Ratio
Active
$850,000
2
bds
|
1
ba
|
822
sqft
|
built
1908
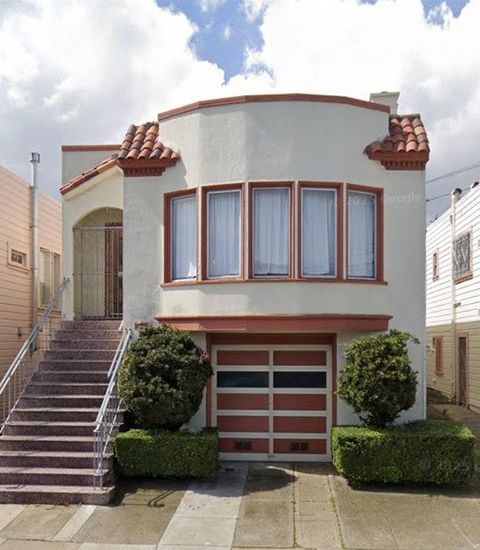
277 Munich St, San Francisco, CA 94112
$-2,090
Cash flow
-12.8%
Cash-on-Cash Return
3.1%
Cap rate
0.4%
Rent to Value Ratio
Active
$850,000
4
bds
|
2
ba
|
1,615
sqft
|
built
1936
1122 Gilman Ave, San Francisco, CA 94124
$-917
Cash flow
-5.6%
Cash-on-Cash Return
4.8%
Cap rate
0.6%
Rent to Value Ratio
Active
$520,000
bds
|
1
ba
|
397
sqft
|
built
2019
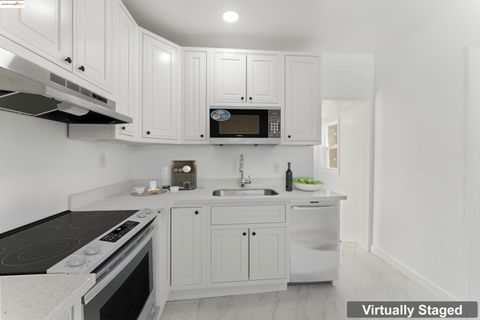
901 Tennessee St, San Francisco, CA 94107
$-697
Cash flow
-7.0%
Cash-on-Cash Return
4.5%
Cap rate
0.5%
Rent to Value Ratio
Active
$949,000
2
bds
|
1
ba
|
1,100
sqft
|
built
1929
214 Louisburg St, San Francisco, CA 94112
$-1,694
Cash flow
-9.3%
Cash-on-Cash Return
3.9%
Cap rate
0.5%
Rent to Value Ratio
Active
$718,000
1
bds
|
1
ba
|
900
sqft
|
built
1966
1200 Gough St, San Francisco, CA 94109
$-1,851
Cash flow
-13.5%
Cash-on-Cash Return
3.0%
Cap rate
0.6%
Rent to Value Ratio
Active
$868,888
3
bds
|
2
ba
|
1,120
sqft
|
built
1947
1174 Goettingen St, San Francisco, CA 94134
$-1,013
Cash flow
-6.1%
Cash-on-Cash Return
4.7%
Cap rate
0.6%
Rent to Value Ratio
Active
$730,000
3
bds
|
3
ba
|
1,360
sqft
|
built
1981
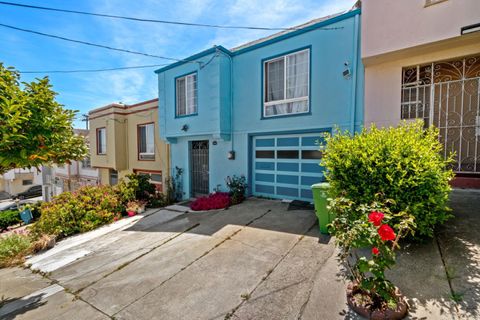
137 Nautilus Ct, San Francisco, CA 94124
$-1,312
Cash flow
-9.4%
Cash-on-Cash Return
3.9%
Cap rate
0.6%
Rent to Value Ratio
Active
$1,688,000
bds
|
0
ba
|
3,950
sqft
|
built
1915
459 11th Ave, San Francisco, CA 94118
$-6,810
Cash flow
-21.0%
Cash-on-Cash Return
1.2%
Cap rate
0.1%
Rent to Value Ratio
Active
$1,388,000
4
bds
|
0
ba
|
1,492
sqft
|
built
1912
58 Monterey Blvd, San Francisco, CA 94131
$-4,534
Cash flow
-17.0%
Cash-on-Cash Return
2.1%
Cap rate
0.3%
Rent to Value Ratio
Active
$1,950,000
2
bds
|
2
ba
|
1,319
sqft
|
built
2018
1000 3rd St, San Francisco, CA 94158
$-5,327
Cash flow
-14.3%
Cash-on-Cash Return
2.8%
Cap rate
0.4%
Rent to Value Ratio
Active
$1,095,000
3
bds
|
2
ba
|
1,475
sqft
|
built
1913
722 Naples St, San Francisco, CA 94112
$-2,777
Cash flow
-13.2%
Cash-on-Cash Return
3.0%
Cap rate
0.4%
Rent to Value Ratio
Active
$950,000
2
bds
|
1
ba
|
1,125
sqft
|
built
1926
406 Goettingen St, San Francisco, CA 94134
$-1,768
Cash flow
-9.7%
Cash-on-Cash Return
3.8%
Cap rate
0.5%
Rent to Value Ratio
Active
$650,000
3
bds
|
1
ba
|
570
sqft
|
built
1906
1213 Egbert Ave, San Francisco, CA 94124
$-872
Cash flow
-7.0%
Cash-on-Cash Return
4.5%
Cap rate
0.5%
Rent to Value Ratio

Active
$1,900,000
8
bds
|
3
ba
|
3,432
sqft
|
built
1900
3545 20th St, San Francisco, CA 94110
$-5,812
Cash flow
-16.0%
Cash-on-Cash Return
2.4%
Cap rate
0.3%
Rent to Value Ratio
Active
$1,250,000
3
bds
|
3
ba
|
2,025
sqft
|
built
1951
1601 Newhall St, San Francisco, CA 94124
$-2,802
Cash flow
-11.7%
Cash-on-Cash Return
3.4%
Cap rate
0.4%
Rent to Value Ratio
Active
$1,397,000
4
bds
|
4
ba
|
1,979
sqft
|
built
1922
459 Flood Ave, San Francisco, CA 94112
$-3,683
Cash flow
-13.8%
Cash-on-Cash Return
2.9%
Cap rate
0.4%
Rent to Value Ratio
Active
$1,300,000
4
bds
|
2
ba
|
1,904
sqft
|
built
1924
112 Peabody St, San Francisco, CA 94134
$-3,193
Cash flow
-12.8%
Cash-on-Cash Return
3.1%
Cap rate
0.4%
Rent to Value Ratio

Active
$4,200,000
3
bds
|
4
ba
|
2,911
sqft
|
built
2020
706 Mission St, San Francisco, CA 94103
$-17,586
Cash flow
-21.8%
Cash-on-Cash Return
1.0%
Cap rate
0.3%
Rent to Value Ratio
Active
$698,000
2
bds
|
1
ba
|
1,275
sqft
|
built
1927
444 Ellington Ave, San Francisco, CA 94112
$-769
Cash flow
-5.7%
Cash-on-Cash Return
4.7%
Cap rate
0.6%
Rent to Value Ratio

Active
$1,798,998
2
bds
|
3
ba
|
3,496
sqft
|
built
2002
767 Bryant St, San Francisco, CA 94107
$-4,502
Cash flow
-13.1%
Cash-on-Cash Return
3.1%
Cap rate
0.5%
Rent to Value Ratio
Active
$2,998,000
4
bds
|
4
ba
|
3,462
sqft
|
built
1928
1260 Monterey Blvd, San Francisco, CA 94127
$-7,503
Cash flow
-13.1%
Cash-on-Cash Return
3.1%
Cap rate
0.4%
Rent to Value Ratio
Active
$749,000
1
bds
|
2
ba
|
797
sqft
|
built
2002
1325 Indiana St, San Francisco, CA 94107
$-1,684
Cash flow
-11.7%
Cash-on-Cash Return
3.4%
Cap rate
0.5%
Rent to Value Ratio
Active
$924,999
2
bds
|
1
ba
|
952
sqft
|
built
2008
2443 Clement St, San Francisco, CA 94121
$-1,572
Cash flow
-8.9%
Cash-on-Cash Return
4.0%
Cap rate
0.5%
Rent to Value Ratio
Active
$1,080,000
5
bds
|
3
ba
|
3,158
sqft
|
built
1924
841 Geneva Ave, San Francisco, CA 94112
$-1,183
Cash flow
-5.7%
Cash-on-Cash Return
4.8%
Cap rate
0.6%
Rent to Value Ratio
Active
$998,000
2
bds
|
2
ba
|
1,126
sqft
|
built
1943
3530 Santiago St, San Francisco, CA 94116
$-1,941
Cash flow
-10.1%
Cash-on-Cash Return
3.7%
Cap rate
0.5%
Rent to Value Ratio
Active
$3,000,000
bds
|
0
ba
|
4,500
sqft
|
built
1907
414 Bryant St, San Francisco, CA 94107
$-10,892
Cash flow
-18.9%
Cash-on-Cash Return
1.7%
Cap rate
0.2%
Rent to Value Ratio
Active
$538,000
1
bds
|
1
ba
|
807
sqft
|
built
2007
401 Crescent Ct, San Francisco, CA 94134
$-1,524
Cash flow
-14.8%
Cash-on-Cash Return
2.7%
Cap rate
0.5%
Rent to Value Ratio
Active
$895,000
1
bds
|
1
ba
|
846
sqft
|
built
2007
325 Berry St, San Francisco, CA 94158
$-2,013
Cash flow
-11.7%
Cash-on-Cash Return
3.4%
Cap rate
0.5%
Rent to Value Ratio
Active
$3,195,000
6
bds
|
7
ba
|
3,000
sqft
|
built
1906
1208 Stanyan St, San Francisco, CA 94117
$-9,463
Cash flow
-15.5%
Cash-on-Cash Return
2.5%
Cap rate
0.3%
Rent to Value Ratio
Active
$2,888,000
3
bds
|
3
ba
|
2,154
sqft
|
built
1998
3941 19th St, San Francisco, CA 94114
$-8,762
Cash flow
-15.8%
Cash-on-Cash Return
2.4%
Cap rate
0.3%
Rent to Value Ratio
Active
$1,749,000
8
bds
|
0
ba
|
4,096
sqft
|
built
1940
745 Brazil Ave, San Francisco, CA 94112
$-6,705
Cash flow
-20.0%
Cash-on-Cash Return
1.5%
Cap rate
0.2%
Rent to Value Ratio
Active
$1,099,000
1
bds
|
1
ba
|
819
sqft
|
built
2008
425 1st St, San Francisco, CA 94105
$-3,218
Cash flow
-15.3%
Cash-on-Cash Return
2.6%
Cap rate
0.5%
Rent to Value Ratio
Active
$1,098,000
1
bds
|
2
ba
|
1,000
sqft
|
built
2015
318 Main St, San Francisco, CA 94105
$-4,053
Cash flow
-19.3%
Cash-on-Cash Return
1.6%
Cap rate
0.4%
Rent to Value Ratio
Active
$1,100,000
2
bds
|
1
ba
|
1,221
sqft
|
built
1909
108 Cortland Ave, San Francisco, CA 94110
$-2,802
Cash flow
-13.3%
Cash-on-Cash Return
3.0%
Cap rate
0.4%
Rent to Value Ratio
Active
$1,998,000
5
bds
|
4
ba
|
2,730
sqft
|
built
1926
783 31st Ave, San Francisco, CA 94121
$-5,273
Cash flow
-13.8%
Cash-on-Cash Return
2.9%
Cap rate
0.4%
Rent to Value Ratio
Active
$525,000
1
bds
|
1
ba
|
597
sqft
|
built
1993
240 Lombard St, San Francisco, CA 94111
$-1,397
Cash flow
-13.9%
Cash-on-Cash Return
2.9%
Cap rate
0.6%
Rent to Value Ratio